

-
林分蓄积量是反映森林资源质量与森林经营水平的重要依据,也是反映森林生产力的一个重要指标[1]。分析林分蓄积量与林分变量、气候因子的关系,对于评价森林生产力有重要的参考价值。气候变化对林分蓄积量影响的研究已经做了不少。如:Di Filippo等[2]发现夏季以及前一年夏秋的干旱指数导致土耳其栎(Quercus cerris L.)的蓄积生长量减少。Patrick等[3]利用森林资源连续清查中的无梗花栎(Quercus petraea Libelb)和樟子松(Pinus sylvestris var. mongolica Litv.)样地数据,探讨了环境气候、林分直径和林分密度对林分生长的影响,研究发现12月至次年7月的降水对每年的林分生长十分重要。林分变量因子,包括林分密度、立地条件、林龄、林分结构等,也能对森林生长变化产生一定的影响。汪玮和孟伟[4]以湖南省杉木(Cunninghamia lanceolata (Lamb.) Hook.)人工林为研究对象,基于7类立地因子数据,建立了湖南省杉木人工林林分蓄积量估测模型,提高了模型精度。气候因子和林分变量因子均对森林生长变化产生影响。而不同的影响因子对森林生长的影响又不同[5-7]。Toledo等[8]认为气候因子是玻利维亚热带森林生长的主要驱动因子,其次是土壤和人为的经营干扰。Zhang等[9]利用加拿大西部地区半个世纪的森林调查资料分析森林生长变化的驱动因子,得到结果为林木竞争因子是该地区森林生长变化的主要驱动因子,其次是气候因子。之后,Pricea等[10]对该结论提出了疑问,并认为气候变化才是加拿大西部地区森林生长变化的主要驱动因子。何理深和张超[11]采用因子分析法对13个影响因子进行组合(其中包括林分因子、温度因子、水分因子、密度因子与光照因子),构建了云南松(Pinus yunnanensis Franch.)林分蓄积量回归模型,发现蓄积量随林分因子的变动最为显著,且对温度因子和光照因子不敏感。
对于诸多的影响因子,选择合适的变量并分析其对林分蓄积量变化的影响很有必要。目前,用的比较多的方法是逐步回归(SR)。逐步回归根据变量的统计显著与否最终确定该变量是否保留在模型中。而在用该方法分析时,仅根据P值选择,存在一定的局限性,有可能还会选出冗余的变量[12]。此外,在建立模型时,一般是人为指定包含某些变量的某个模型为最优模型。而实际上事先并不知道包含哪些变量的模型为最优模型,即模型本身的不确定性[13-14]。当建立回归模型时,模型本身的不确定性可能很大,若忽略模型本身的不确定性而仅以单一特定模型的结果进行推断,一方面会低估模型的不确定性,导致模型的适用范围变窄,另一方面会更趋向于拒绝无效假设产生误导性判断[15-16]。
贝叶斯模型平均法(Bayesian model averaging,BMA)是变量选择和构建不确定性模型的另一种方法[17]。与传统方法不同,它并非仅得出一个“最佳”模型,而是考虑模型空间内所有可能变量的组合模型,用各模型的后验概率加权平均得到一个模型,然后根据各自变量估计值的后验概率分析该自变量的重要性[18-19]。近些年,BMA方法在林业上也有应用,如:直径分布模型[20]、生物量模型[17]、林分断面积模型[21-22]和枯损率模型[23]。但是,总体上对BMA模型的研究还不够。本研究以福建邵武28年的杉木人工林密度试验林为研究对象,分别利用贝叶斯模型平均法和逐步回归法分析杉木林分蓄积量与林分变量、气候因子之间的关系,比较不同影响因子的重要性,构建杉木林分蓄积量生长模型。
-
研究区位于福建省邵武市卫闽林场,地处武夷山北段中山山脉东南侧山区,为杉木的中心产区。地貌主要为低山、高丘,海拔250~700 m,坡度25°~35°。气候属亚热带季风气候,年平均气温17.7℃,极端低温−7.9℃,全年日照时数1740.7 h。年降水量1768 mm,年平均相对湿度82%。土壤以发育在花岗岩等母质上的红壤为主,土层比较厚,腐殖质含量丰富。林下灌木有木荷(Schima superba Gardn.et Champ.)、中华杜英(Elaeocarpus chinensis (Gardn. et Chanp.) Hook. f. ex Benth.)、丝栗栲(Castanopsis fargesii Franch.)和胡颓子(Elaeagnus pungens Thunb.)等,林下草本植物有狗脊(Woodwardia japonica (L. F.) Sm.)、芒萁(Dicranopteris dichotoma (Thunb.) Berhn.)、中华里白(Hicriopteris chinensis (Ros.) Ching)、半边旗(Pteris semipinnata L.Sp.)、华南毛蕨(Cyclosorus parasiticus (L.) Farwell.)等。
-
本研究数据来源于15块杉木密度实验林固定样地,样地大小为20 m × 30 m。1980年使用裸根苗造林,采用随机区组造林试验,设置5种造林密度,包括A:2 m × 3 m,B:2 m × 1.5 m,C:2 m × 1 m,D:1 m × 1.5 m,E:1 m × 1 m,每种密度重复3次。5种密度由小到大依次选取测量的株数为100株,200株,300株,400株,600株,并对其进行标号和每木检尺,测量胸径和树高。造林后1984—1990年每年测量1次,1992—2010年每2年测量1次,每次调查均在当年树木生长停止后的冬季或下一年开始生长前进行。其中1986年测量样地内所有树的树高,之后开始每个样地随机抽取50株并测量树高。在测量树高的时候采用5点取样法在每个样地的上、下部各取2株,中部取1株,共5株最高木作为林分优势木,以求林分优势木平均高。利用部颁杉木一元材积表经验公式计算出杉木单木材积:
$ v = 0.000\;065\;47DB{H^{2.681\;924\;908}}$
(1) 分别将样地中单木材积相加,得到样地林分蓄积量M(m3·hm−2)。样地林分因子统计量见表1。
表 1 样地林分因子统计值
Table 1. Summary statistics of stand variables of Chinese fir plantations
初植密度
Plantingdensity胸高断面积
BA/(m2·hm−2)株树
N/(tree·hm−2)林分优势高
Hd/m平均胸径
Dg/cm林分蓄积量
M/(m3·hm−2)Mean SD Mean SD Mean SD Mean SD Mean SD A 36.22 19.00 1621 120.51 13.71 6.44 16.01 5.83 245.65 156.67 B 41.79 20.33 3160 338.82 12.52 5.79 12.49 4.41 240.38 140.12 C 44.99 21.45 4465 854.97 12.35 5.96 11.19 4.24 242.03 139.56 D 48.68 24.02 5791 1225.28 11.52 5.85 10.32 4.10 249.43 152.39 E 45.17 18.60 7957 2625.04 10.65 5.11 9.02 3.77 210.22 116.13 本研究所利用的气候数据由ClimateAP软件获得[24]。该软件通过研究区的经纬度和海拔信息插值计算得到气候变量因子。气候变量包括年均气温(MAT),年均降水量(AP),最冷月的平均温度(MCMT),年均湿热指数(AHM),低于0℃天数(DD0),夏季平均最高温度(SMMT),冬季平均最低温度(WMMT),最热月的平均温度(MWMT)和春季平均气温(SMT)。1984—2010年的气候因子统计见表2。
表 2 气候因子统计值
Table 2. Summary statistics of climate variables
气候变量
Climate variables平均值
Mean标准差
SD年均气温(MAT)
Mean annual temperature/℃18.96 0.45 最热月平均温度(MWMT)
Mean warmest month temperature/℃28.26 0.94 最冷月平均温度(MCMT)
Mean coldest month temperature/℃8.34 1.17 年均降水量(AP)
Mean annual precipitation/mm1795.79 271.39 年均湿热指数(AHM)
Annual heat-moisture index16.45 2.35 低于0℃天数(DD0)
Degree-days below 0℃1.48 0.63 夏季平均最高温度(SMMT)
Summer mean maximum temperature/℃32.10 0.81 冬季平均最低温度(WMMT)
Winter mean minimum temperature/℃4.95 0.96 春季平均气温(SMT)
Spring (Mar. – May.) mean temperature/℃18.53 0.75 注:AHM = (MAT+10)/(AP/1000)。
Note: AHM = (MAT+10)/(AP/1 000). -
用于建模的自变量包括林分变量因子和气候因子。林分变量因子包括造林密度(PD)、林龄(A)、每公顷胸高断面积(BA)、每公顷株树(N),优势木平均高(Hd),林分平方平均胸径(Dg);气候因子包括MAT,AP,MCMT,AHM,DD0,SMMT,WMMT,MWMT,SMT。
-
本研究构建林分蓄积量模型采用的多元回归模型形式如下:
$ \begin{split} &\;\\ &M = {\beta _0} + {\beta _1}PD + {\beta _2}N + {\beta _3}BA + {\beta _4}Dg + {\beta _5}Hd + {\beta _6}A +\\ &{\beta _7}MCMT + {\beta _8}AP + {\beta _9}AHM + {\beta _{10}}SMMT + {\beta _{11}}WMWT + \\ &{\beta _{12}}SMT + {\beta _{13}}MAT + {\beta _{14}}DD0 + {\beta _{15}}MWMT \end{split}$
(2) 式中:M为林分蓄积量,β0—β15为模型参数。
-
假设y是研究的林分蓄积量,Z是调查所得的数据(包括气候因子和林分变量因子),f={f1,···,fk}(k=1,···,n)代表所有可能的模型组成的模型空间。则y的后验分布为:
$P{\rm{(}}y|Z{\rm{)}} = \sum\limits_{k = 1}^k {P{\rm{(}}{f_k}{\rm{|Z)}}P{\rm{(}}y{\rm{|}}{f_k}{\rm{,}}Z{\rm{)}}} $
(3) 式中:P(y | fk, Z)是在给定调查数据Z和模型fk的条件下y的后验分布,P(fk|Z)是在给定数据Z的情况下fk为最优模型的概率。从方程(3)可知,y的后验分布实际上是以后验概率P(fk|Z)为权重,对所有模型的后验分布进行加权的一个平均值。贝叶斯平均模型法涉及了模型空间中所有模型的计算。模型空间中所有模型的数量很大,若自变量个数为6个,那么即使在不考虑交互作用的情况下模型数量可达64个。从贝叶斯的观点看BMA的假设检验,其对应的备择假设H1为:Xk为杉木林分蓄积量变化的影响因子的后验概率有多大,即βk不等于0的后验概率有多大?BMA法以所有包含变量Xk的杉木林分蓄积量模型的后验概率的和作为βk不等于0的后验概率的估计:
$P({\beta _k} \ne 0|Z) = \sum\limits_{{f_i} \in \Omega } {P({f_i}|Z)} {I_i}({\beta _k} \ne 0)$
(4) 其中Ii为0/1指示变量,当βk在模型fi中,Ii=1,反之为0。Ω为模型空间。一般认为
$P({\beta _k} \ne 0|Z)$ < 0.5表示没有证据表明Xk是杉木林分蓄积量变化的影响因子;0.5 ≤$P({\beta _k} \ne 0|Z)$ < 0.75表示有弱的证据表明Xk是杉木林分蓄积量变化的影响因子;0.75 ≤$P({\beta _k} \ne 0|Z)$ < 0.95表示有强的证据表明Xk是杉木林分蓄积量变化的影响因子;$P({\beta _k} \ne 0|Z)$ ≥ 0.95表示有很强的证据表明Xk是杉木林分蓄积量变化的影响因子[25]。若Xk是杉木林分蓄积量变化的影响因子,则变量因子Xk的点估计的后验均值为:$E{\rm{(}}{\beta _k}|Z{\rm{)}} = \sum\limits_{i = 1}^n {{{\hat \beta }_k}P({f_i}|Z)} $
(5) 其中,
${\hat \beta _k} = E{\rm{(}}{\beta _k}|{f_i},Z{\rm{)}}$ 。然后根据该变量后验概率均值进行排序,比较引起杉木林分蓄积量变化的主要影响因子,并得到相应的不确定性生长变化模型。 -
本研究采用R2和平均相对误差(MD)作为模型预测的评价指标。一般来说,R2越大,MD绝对值越小,模型表现更好。
${R^2} = 1 - \sum\limits_{i = 1}^n ( {Y_i} - {\hat Y_i}{)^2}/\sum\limits_{i = 1}^n ( {Y_i} - \bar Y{)^2}$
(6) $MD{\rm{ = }}\sum\limits_{i{\rm{ = 1}}}^n {{\rm{(}}{Y_i} - {{\hat Y}_i}{\rm{)}}} {\rm{/}}n$
(7) 式中
$\bar Y$ 表示林分蓄积量Yi的平均值,${\hat Y_i}$ 是预测值的对数转换值。本研究随机抽取总数据的60%作为模拟数据,剩余40%作为预测数据。分别利用BMA与逐步回归法构建林分蓄积量模型。BMA通过贝叶斯自适应抽样包(BAS)实现[26],逐步回归通过step函数实现。所有的计算均在R软件中完成。在贝叶斯模型方法计算中,利用Zellner–Siow柯西先验分布[27]作为参数的先验分布。
-
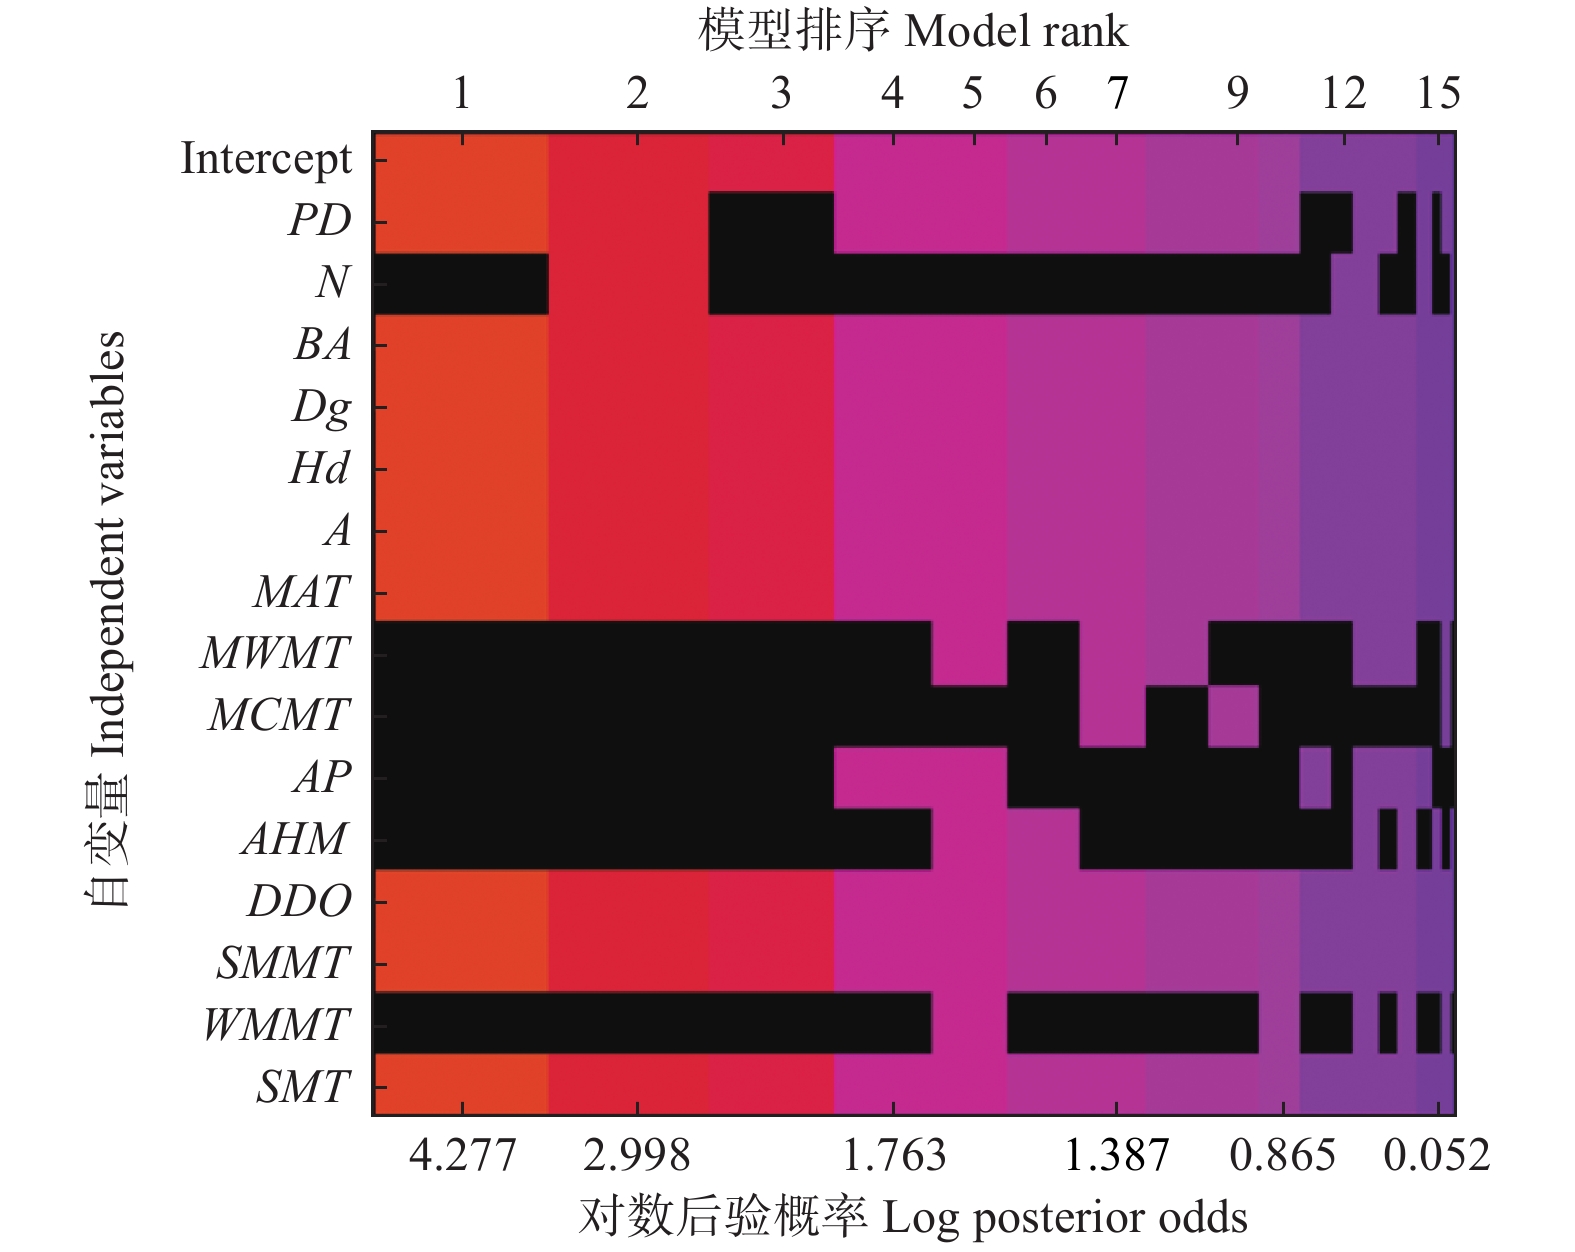
逐步回归法拟合的林分蓄积量模型与BMA后验概率最大的模型相似(表3)。但是BMA模型考虑了所有可能的变量组合,即考虑了林分蓄积量模型的不确定性(图1)。根据表3和图1即可发现,林分蓄积量模型并非只是一个简单的模型,而是由多种模型组合。
表 3 两种方法选择的林分蓄积量模型和BMA模型的后验概率
Table 3. Model selection and its posterior probability (Post prob) of forest volume model using BMA and stepwise regression model
模型及后验概率
Models and post prob选择的变量
Variables selectedBMA Mode l1 (0.429) PD, BA, Dg, Hd, A, MAT, DD0, SMMT, SMT Model 2 (0.119) PD, N, BA, Dg, Hd, A, MAT, DD0, SMMT, SMT Model 3 (0.102) BA, Dg, Hd, A, MAT, DD0, SMMT, SMT Model 4 (0.035) PD, BA, Dg, Hd, A, MAT, AP, DD0, SMMT, SMT Model 5 (0.028) PD, BA, Dg, Hd, A, MAT, MWMT, AP, AHM, DD0, SMMT, WMMT, SMT SR PD, N, BA, Dg, Hd, A, MAT, MWMT, AP, AHM, DD0, SMMT, WMMT, SMT 注:括号中是每个模型的后验概率。仅列出后验概率最大的前5个模型。
Note: Posterior probability of each model is in parenthesis. The top five models with the largest posterior probabilities were showed in this table.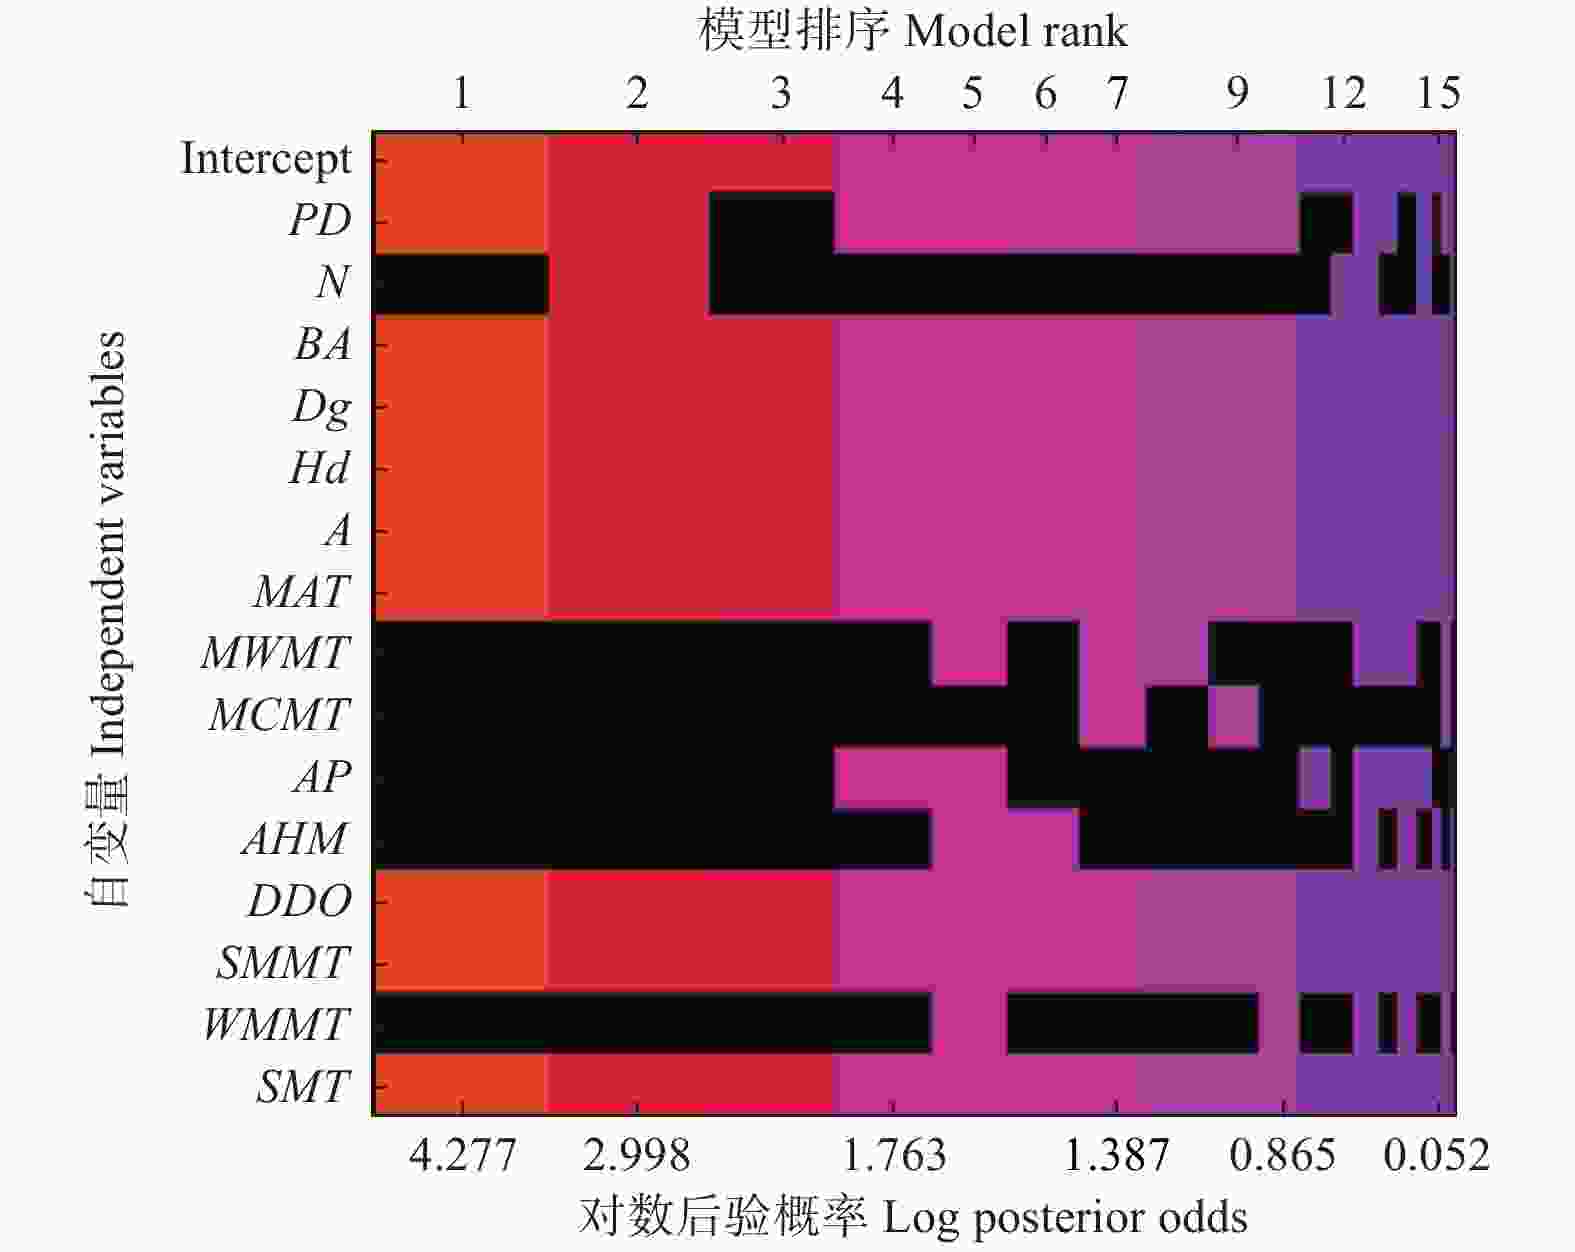
图 1 BMA法预测林分蓄积量模型的模型空间
Figure 1. The model space of forest volume model determined by BMA method
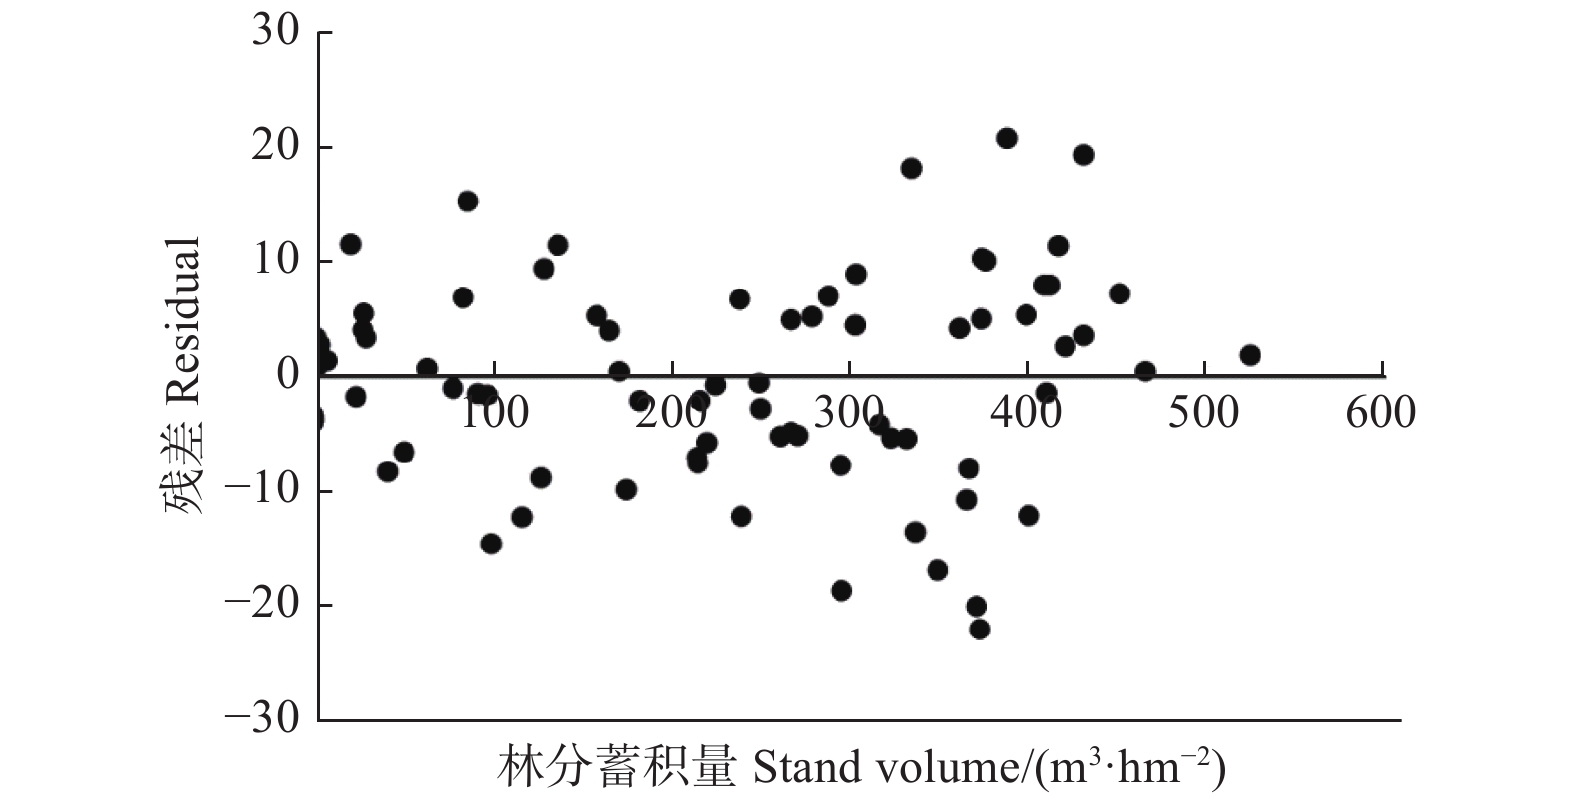
其次,在模型评价上,两种方法结果比较相近。这两种方法的R2相似(R2=0.99),BMA的MD为−0.55,逐步回归法的MD为0.55。此外,根据图2也可发现,根据BMA方法预测的杉木林分蓄积量残差波动比较平稳,没有明显的异方差。
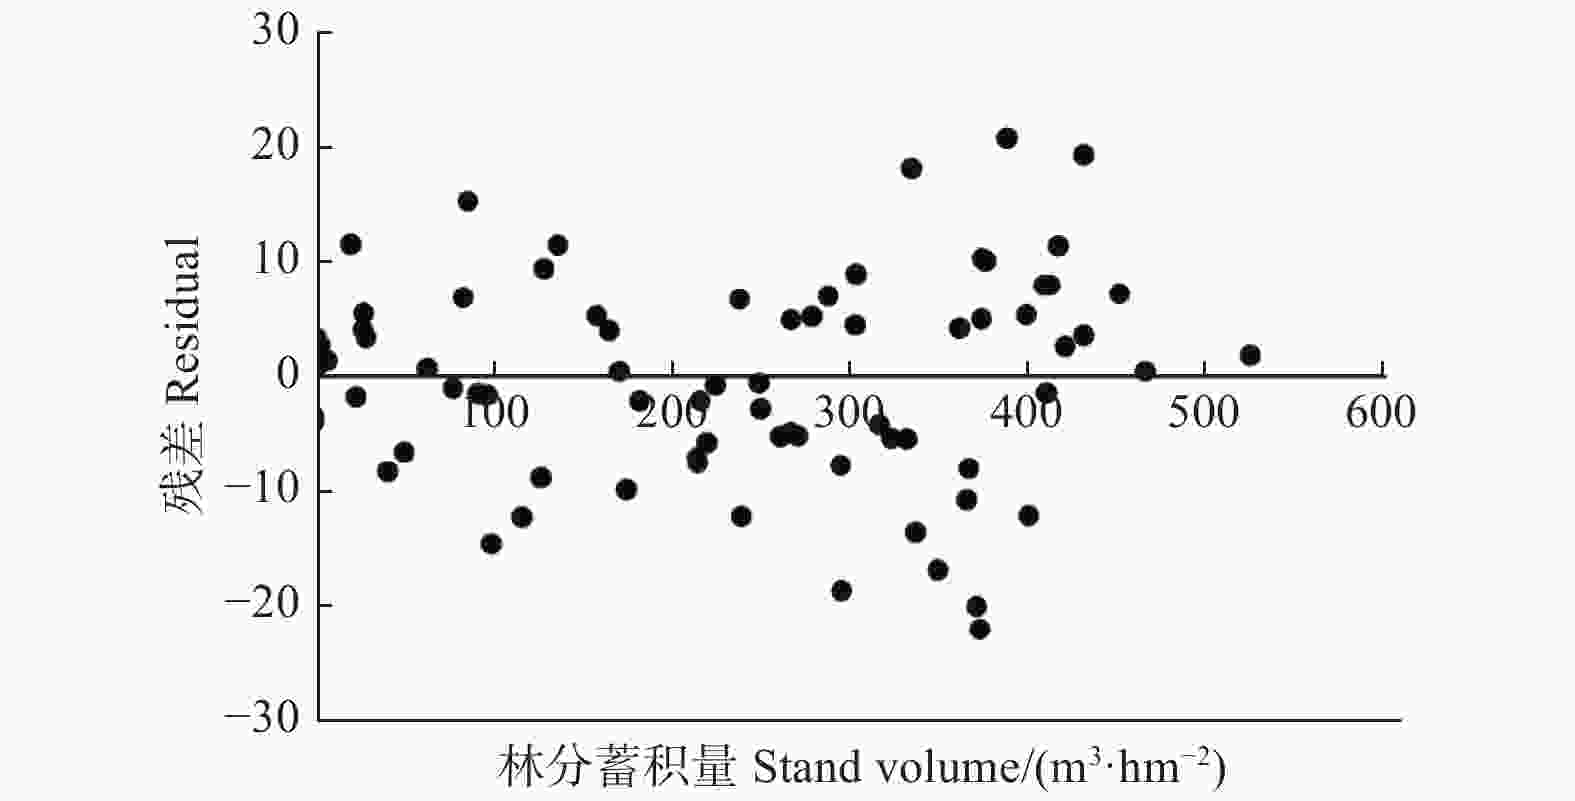
图 2 基于BMA模型预测的林分蓄积量残差
Figure 2. Residuals of stand volume against observed volume output from BMA model
-
BMA方法有强的证据表明杉木林分蓄积量生长与PD负相关(后验概率P=0.81 < 0.95),有很强的证据表明与BA,Dg,Hd,A,DD0,SMMT和SMT正相关,与年均气温负相关(后验概率P > 0.95,表4)。而在逐步回归法中,杉木林分蓄积量生长除了与上面一些变量相关显著相关外,还与N、AP、AHM和WMMT显著正相关,与MWMT显著负相关(表4)。
表 4 逐步回归法和BMA法构建林分蓄积量模型的参数估计值
Table 4. The parameter estimates of forest volume model determined by BMAand stepwise regression (SR) method
项目 Items PD N BA Dg Hd A MAT BMA 0.000 1(0.81) 0.249 9(1.00) 0.410 9(1.00) 0.207 7(0.98) 0.189 8(0.99) 3.372 0(1.00) SR 0.000 3* 0.000 2* 0.265 7* 0.427 3* 0.203 7* 0.250 7* 8.522 2* 项目 Items MWMT MCMT AP AHM DD0 SMMT WMMT SMT BMA 2.001 0(1.00) 1.414(1.00) 1.976(1.00) SR 1.135* 0.014 0* 1.444 5* 2.140 0* 3.776 0* 0.765 8* 3.019 0* 注:*表示在在逐步回归中参数P < 0.05。对于BMA方法,仅列出后验概率P大于0.75的参数估计值。
Note: * indicates that the parameter P < 0.05 in stepwise regression. For the BMA method, parameter with a posterior probability P > 0.75 is listed. -
在本研究中,分别用BMA模型法与逐步回归法分析杉木林分蓄积量与林分变量因子和气候因子的关系。逐步回归方法根据自变量的P值判断显著与否。然而,在变量选择之后使用P值可能会产生极大的误导。如:当样本量比较大时,P值可能明显地拒绝拟合效果比较好的模型,而当样本量比较小时,拟合效果比较差,模型结果不可靠[28]。此外,有研究表明逐步回归法忽略了模型的不确定性[16, 29]。而实际上事先并不知道包含哪些变量的模型为最佳模型,即模型本身的不确定性[14]。
BMA方法不同,它并非仅得出一个“最佳”的模型,而是考虑所有可能的单项模型以及各个模型的后验概率,用模型的后验概率加权平均得到一个贝叶斯平均模型,然后根据模型中的变量估计值不等于0的后验概率进行变量重要性的排序[18]。BMA不仅给出了最大后验概率模型,同时给出筛选的模型的后验概率,从后验概率的大小评价各模型的优劣,从而有效解决了林分蓄积量模型的不确定性[19]。
林分蓄积量模型中,逐步回归法所得到的模型并不在BMA法所确定的前5个后验概率高的模型中(表3)。这表明林分蓄积量模型存在不确定性,且逐步回归方法忽略了这一点。此外,逐步回归模型中更易选择冗余变量。在本研究中,逐步回归法多选择了N、MCMT、AP、AHM和WMMT。很明显,本研究区福建邵武气候温暖湿润,雨量充沛。故年均降水量AP和干旱指数AHM对于杉木林分生长并不存在显著的影响关系。而且该区域的最低温因子包括最冷月平均温MCMT和冬季平均最低温WMMT也很难对杉木林分生长起到重要的作用。此外,在逐步回归方法中多选的变量N很明显与BA相关。Genell等[30]通过模拟数据表明,BMA不选择冗余变量的概率高于逐步回归方法,并且选择真实预测因子的概率与逐步回归法相似。
一般来说模型变量越多,模型精度越高。而Madigan和Raftery[31]证明了BMA模型的精度绝对不会低于逐步回归模型所确定的单一模型。这在本研究中也得到了证实:两种方法的R2值相近。这或许是由于在大样本中,两种模型性能相当,而对于小样本,贝叶斯方法的性能优于传统方法[32-33]。Wang等[34]将层次贝叶斯方法与非线性混合效应模型进行比较,以估计地上树生物量,并表明这两种方法在汇集数据时表现相似,而对于小样本,贝叶斯模型方法要好得多。
-
林分变量因子中,蓄积量随着林分平方平均胸径,年龄,每公顷断面积和优势高的增加而增加。这与何理深和张超[11]的结果一致:平均年龄、平均胸径和平均树高对云南松蓄积量生长有促进作用。汪玮和孟伟[4]也认为杉木林分蓄积量与平均胸径和平均树高是正相关关系,但他们认为与平均林龄无关。王少杰等[35]在用基础模型预估林分蓄积量时,得出优势木平均高和林分断面积促进蓄积量增长的结论,与本研究结果一致。我们发现初植密度越大,蓄积量越小,这和以前的研究不同[4, 36],林分蓄积量由林分密度和单株材积的乘积取得,两者互为消长,因此林分蓄积量取决于哪个因子的作用更强[37]。密度较低时,初植密度处于支配地位,林分蓄积与密度是正相关关系,当密度达到一定程度时,蓄积量不再随初植密度的增加而变化,保持在一定水平[38]。本研究结果可能是由于初植密度越大,竞争越大,自然稀疏越多,保留株数急剧减少,因此林分蓄积量随之变小。刘新亮等[39]发现樟树林蓄积量随着初植密度的增大,呈现出先增大后减小的规律,在1111株·hm−2时,蓄积量最大。在高密度时,杉木个体对养分、光照等资源竞争激烈,树木发育受到明显抑制[40]。
气候因子中,夏季平均最高温、春季平均温和低于0℃天数都对林分蓄积量有促进作用。年均气温和最热月平均温与林分蓄积量是负相关关系。一般来说温度和降雨会促进杉木的生长。夏季温度高,杉木人工林的生长季将会有所延长,那么其生长量也会增加[41],最终会使得林分蓄积量增加。春季平均温的升高,使杉木得到迅速生长,其蓄积量相应得到增加。研究发现红松(Pinus koraiensis Sieb. et Zucc.)生长和年平均温是负相关关系,因为气温的上升增强了呼吸作用,消耗了积累的有机物质,影响了下一年树木的早材生长[42]。在本研究中,由于研究区属于温暖湿润,雨量充沛的气候区域,而杉木喜欢湿润的环境,因此降水量和干旱指数对杉木林分蓄积量的增长并不起显著作用。
-
本研究采用逐步回归方法和贝叶斯模型平均法分析杉木人工林林分蓄积量与林分变量因子和气候因子的关系。研究发现逐步回归法所确定的模型并不在BMA选出的后验概率较高的前5个模型中。从后验概率的角度说明,逐步回归模型精度比BMA模型精度低。其次,逐步回归法仅给出一个所谓的最优模型,而贝叶斯模型平均法根据不同模型的后验概率考虑所有可能模型的组合,表现出模型的不确定性。同时,逐步回归法相对于BMA方法更易选择冗余变量,冗余变量有N、MCMT、AP、AHM和WMMT。此外,这两种方法所表现出的模型预测精度相当。杉木林分蓄积量随着每公顷胸高断面积、平方平均胸径、优势高、年龄、夏季平均最高温、春季平均温和低于0℃天数的增加而增加。
基于贝叶斯模型平均法构建杉木林分蓄积量生长模型
Stand Volume Growth Model of Chinese Fir Plantations Based on Bayesian Model Averaging Approach
-
摘要:
目的 探究杉木林分蓄积量变化的影响因素,为在气候变化背景下科学经营管理杉木人工林提供理论支撑。 方法 以福建邵武卫闽林场的杉木(Cunninghamia lanceolata)人工密度试验林为研究对象,分别利用贝叶斯模型平均法(BMA)和逐步回归法(SR)构建杉木林分蓄积量与林分变量因子(包括初植密度、每公顷胸高断面积、每公顷株数、平方平均胸径、林分优势高、年龄)和气候因子(包括年均气温、最热月平均温度、最冷月平均温度、年均降水量、年均湿热指数、低于0℃天数、夏季平均最高温度、冬季平均最低温度、春季平均气温)的关系模型。 结果 杉木林分蓄积量随着每公顷胸高断面积、平方平均胸径、林分优势高、年龄、夏季平均最高温、春季平均温和低于0℃天数的增加而增加,对于诸多的影响因子,SR法所确定的模型并不在BMA选出的后验概率较高的前5个模型中,模型表现出一定的不确定性,从模型后验概率角度看,SR模型精度较低。 结论 杉木林分蓄积量受到林分变量因子和气候因子的显著影响。相比于SR法,在构建杉木林分蓄积量模型方面,BMA方法考虑了模型的不确定性,模型表现更好。 Abstract:Objective To study the factors influencing the stand volume change of Chinese fir (Cunninghamia lanceolata) plantations under the context of climate change. Method Based on the long term spacing trails of Chinese fir plantations established in Weimin Forest Farm, Shaowu, Fujian Province, the authors modeled the stand volume growth in relation to stand variables (including planting density, stand basal area per hectare, number of trees per hectare, stand quadratic mean diameter, dominant height, age) and climatic factors (including mean annual temperature, mean warmest month temperature, mean coldest month temperature, mean annual precipitation, annual heat-moisture index, degree-days below 0℃, summer mean maximum temperature, winter mean minimum temperature, spring (March to May) mean temperature) based on Bayesian model averaging (BMA) and stepwise regression methods (SR). Result The stand volume of Chinese fir increased with the increase of stand basal area per hectare, stand quadratic mean diameter, stand dominant height, age, summer mean maximum temperature, spring mean temperature, and Degree-days below 0℃. The model determined by SR method was not in the top five models with the highest posterior probability selected by BMA, which indicated that the model uncertainty. In view of the posterior probability of a model, SR method had lower accuracy. Conclusion The stand volume of Chinese fir plantations is significantly affected by stand and climate factors. Compared with SR method, BMA method shows a better performance because of its considering the model uncertainty. -
图 1 BMA法预测林分蓄积量模型的模型空间
Figure 1. The model space of forest volume model determined by BMA method
图 2 基于BMA模型预测的林分蓄积量残差
Figure 2. Residuals of stand volume against observed volume output from BMA model
表 1 样地林分因子统计值
Table 1. Summary statistics of stand variables of Chinese fir plantations
初植密度
Plantingdensity胸高断面积
BA/(m2·hm−2)株树
N/(tree·hm−2)林分优势高
Hd/m平均胸径
Dg/cm林分蓄积量
M/(m3·hm−2)Mean SD Mean SD Mean SD Mean SD Mean SD A 36.22 19.00 1621 120.51 13.71 6.44 16.01 5.83 245.65 156.67 B 41.79 20.33 3160 338.82 12.52 5.79 12.49 4.41 240.38 140.12 C 44.99 21.45 4465 854.97 12.35 5.96 11.19 4.24 242.03 139.56 D 48.68 24.02 5791 1225.28 11.52 5.85 10.32 4.10 249.43 152.39 E 45.17 18.60 7957 2625.04 10.65 5.11 9.02 3.77 210.22 116.13  下载: 导出CSV
表 2 气候因子统计值
Table 2. Summary statistics of climate variables
气候变量
Climate variables平均值
Mean标准差
SD年均气温(MAT)
Mean annual temperature/℃18.96 0.45 最热月平均温度(MWMT)
Mean warmest month temperature/℃28.26 0.94 最冷月平均温度(MCMT)
Mean coldest month temperature/℃8.34 1.17 年均降水量(AP)
Mean annual precipitation/mm1795.79 271.39 年均湿热指数(AHM)
Annual heat-moisture index16.45 2.35 低于0℃天数(DD0)
Degree-days below 0℃1.48 0.63 夏季平均最高温度(SMMT)
Summer mean maximum temperature/℃32.10 0.81 冬季平均最低温度(WMMT)
Winter mean minimum temperature/℃4.95 0.96 春季平均气温(SMT)
Spring (Mar. – May.) mean temperature/℃18.53 0.75 注:AHM = (MAT+10)/(AP/1000)。
Note: AHM = (MAT+10)/(AP/1 000).
下载: 导出CSV
表 3 两种方法选择的林分蓄积量模型和BMA模型的后验概率
Table 3. Model selection and its posterior probability (Post prob) of forest volume model using BMA and stepwise regression model
模型及后验概率
Models and post prob选择的变量
Variables selectedBMA Mode l1 (0.429) PD, BA, Dg, Hd, A, MAT, DD0, SMMT, SMT Model 2 (0.119) PD, N, BA, Dg, Hd, A, MAT, DD0, SMMT, SMT Model 3 (0.102) BA, Dg, Hd, A, MAT, DD0, SMMT, SMT Model 4 (0.035) PD, BA, Dg, Hd, A, MAT, AP, DD0, SMMT, SMT Model 5 (0.028) PD, BA, Dg, Hd, A, MAT, MWMT, AP, AHM, DD0, SMMT, WMMT, SMT SR PD, N, BA, Dg, Hd, A, MAT, MWMT, AP, AHM, DD0, SMMT, WMMT, SMT 注:括号中是每个模型的后验概率。仅列出后验概率最大的前5个模型。
Note: Posterior probability of each model is in parenthesis. The top five models with the largest posterior probabilities were showed in this table.
下载: 导出CSV
表 4 逐步回归法和BMA法构建林分蓄积量模型的参数估计值
Table 4. The parameter estimates of forest volume model determined by BMAand stepwise regression (SR) method
项目 Items PD N BA Dg Hd A MAT BMA 0.000 1(0.81) 0.249 9(1.00) 0.410 9(1.00) 0.207 7(0.98) 0.189 8(0.99) 3.372 0(1.00) SR 0.000 3* 0.000 2* 0.265 7* 0.427 3* 0.203 7* 0.250 7* 8.522 2* 项目 Items MWMT MCMT AP AHM DD0 SMMT WMMT SMT BMA 2.001 0(1.00) 1.414(1.00) 1.976(1.00) SR 1.135* 0.014 0* 1.444 5* 2.140 0* 3.776 0* 0.765 8* 3.019 0* 注:*表示在在逐步回归中参数P < 0.05。对于BMA方法,仅列出后验概率P大于0.75的参数估计值。
Note: * indicates that the parameter P < 0.05 in stepwise regression. For the BMA method, parameter with a posterior probability P > 0.75 is listed.
下载: 导出CSV
-
[1] Kimberley M, West G, Dean M, et al. The 300 index- a volume productivity index for radiata pine[J]. New Zealand Journalof Forestry, 2005, 50(2): 13-18. [2] Filippo A D, Alessandrini A, Biondi F, et al. Climate change and oak growth decline: dendroecology and stand productivity of a turkey oak (Quercus cerris L.) old stored coppice in central Italy[J]. Annals of Forest Science, 2010, 67(7): 1-14. [3] Patrick V, Agricultural P T J, Meteorology F. Coupling transversal and longitudinal models to better predict Quercus petraea and Pinus sylvestris stand growth under climate change[J]. Agriculturaland Forest Meteorology, 2018, 263: 258-266. doi: 10.1016/j.agrformet.2018.08.021 [4] 汪 玮, 孟 伟. 不同立地因子对杉木蓄积量的影响[J]. 热带林业, 2017, 45(3):23-26. doi: 10.3969/j.issn.1672-0938.2017.03.007 [5] 郭光智, 段爱国, 张建国. 南亚热带杉木林分蓄积量生长立地与密度效应[J]. 林业科学研究, 2019, 32(4):19-25. [6] Zhang X, Wang Z, Chhin S, et al. Relative contributions of competition, stand structure, age, and climate factors to tree mortality of Chinese fir plantations: long-term spacing trials in southern China[J]. Forest Ecology and Management, 2020, 465: 118103. doi: 10.1016/j.foreco.2020.118103 [7] 刘世荣, 徐德应. 气候变化对中国森林生产力的影响[J]. 林业科学研究, 1994, 7(4):425-430. doi: 10.3321/j.issn:1001-1498.1994.04.011 [8] Toledo M, Poorter L, Peña-Claros M, et al. Climate is a stronger driver of tree and forest growth rates than soil and disturbance[J]. Journal of Ecology, 2011, 99(1): 254-264. doi: 10.1111/j.1365-2745.2010.01741.x [9] Zhang J, Huang S, He F. Half-century evidence from western Canada shows forest dynamics are primarily driven by competition followed by climate[J]. Proceedings of the National Academy of Sciences of the United States of America, 2015, 112(13): 4009-4014. doi: 10.1073/pnas.1420844112 [10] Pricea D T, Cookea B J, Metsarantaa J M, et al. If forest dynamics in Canada's west are driven mainly by competition, why did they change? Half-century evidence says: Climate change[J]. Proceedings of the National Academy of Sciences of the United States of America, 2015, 112(32): 1-1. [11] 何理深, 张 超. 云南松林分蓄积量的影响因子分析[J]. 西南林业大学学报, 2019, 39(6):116-122. doi: 10.11929/j.swfu.201903084 [12] Raftery A E, Madigan D, Volinsky C T. Accounting for model uncertainty in survival analysis improves predictive performance (with Discussion).[M]// Bernardo J M, Berger J O, Dawid A P, et al. Bayesian Statistics 5. Oxford University Press: Oxford, U.K., 1995: 323-349. [13] Raftery A E, Madigan D, Hoeting J A. Bayesian model averaging for linear regression models[J]. Journal of the American Statistical Association, 1991, 92(437): 179-191. [14] Draper D. Assessment and propagation of model uncertainty[J]. Journal of the Royal Statistical Society: Series B (Methodological), 1995, 57(1): 45-70. doi: 10.1111/j.2517-6161.1995.tb02015.x [15] Viallefont V, Raftery A S. Variable selection and Bayesian model averaging in case-control studies[J]. Statistics in Medicine, 2001, 20(21): 3215–3230. [16] 张志杰, 彭文祥, 周艺彪, 等. 贝叶斯模型平均法的基本原理及其在logistic回归中的应用实例[J]. 中国卫生统计, 2007, 24(5):467-471. doi: 10.3969/j.issn.1002-3674.2007.05.006 [17] Picard N, Henry M, Mortier F, et al. Using Bayesian model averaging to predict tree aboveground biomass in tropical moist forests[J]. Forest Science, 2012, 58(1): 15-23. doi: 10.5849/forsci.10-083 [18] 罗剑锋. 贝叶斯平均模型及其在医学研究中的应用探索[D]. 上海: 复旦大学, 2003. [19] 颜薪瞩. 贝叶斯模型平均法及其在宏观经济预测中的应用[D]. 北京: 北京理工大学, 2016. [20] Bullock B P, Boone E L. Deriving tree diameter distributions using Bayesian model averaging[J]. Forest Ecology and Management, 2007, 242(2-3): 127-132. doi: 10.1016/j.foreco.2007.01.024 [21] Zhang X, Duan A, Dong L, et al. The application of Bayesian model averaging in compatibility of stand basal area for even-aged plantations in southern China[J]. Forest Science, 2014, b, 60(4): 645-651. [22] 张雄清, 张建国, 段爱国. 杉木人工林林分断面积生长模型的贝叶斯法估计[J]. 林业科学研究, 2015, 28(4):538-542. doi: 10.3969/j.issn.1001-1498.2015.04.013 [23] Lu L, Wang H, Chhin S, et al. A Bayesian Model Averaging approach for modelling tree mortality in relation to site, competition and climatic factors for Chinese fir plantations[J]. Forest Ecology and Management, 2019, 440: 169-177. doi: 10.1016/j.foreco.2019.03.003 [24] Wang T, Hamann A, Spittlehouse D L, et al. Climate WNA—high-resolution spatial climate data for western North America[J]. Journal of Applied Meteorology and Climatology, 2012, 51(1): 16-29. doi: 10.1175/JAMC-D-11-043.1 [25] Kass R E, Rafter A E. Bayes factors[J]. Journal of the American Statistical Association, 1995, 90(430): 773-795. [26] Clyde M, Ghosh J, Littman M. Bayesian adaptive sampling for variable selection and model averaging[J]. Journal of Computational Graphics and Statistics, 2010, 20(1): 80-101. [27] Zellner A, Siow A. “Posterior odds ratios for selected regression hypotheses, ” in Bayesian Statistics[C]//. BernardoJ M, DeGrootM H, Lindley D V, et al. Proceedings of the First International Meeting Held in Valencia, Valencia, Spain: University of Valencia Press, 1980, 585-603. [28] Raftery A E. Approximate Bayes factors and accounting for model uncertainty in generalised linear models[J]. Biometrika, 1996, 83(2): 251-266. doi: 10.1093/biomet/83.2.251 [29] Raftery A E, Painter I S, Volinsky C T. BMA: an R package for Bayesian model averaging[J]. R News, 2005, 5(1): 2-8. [30] Genell A, Nemes S, Steineck G, et al. Model selection in medical research: a simulation study comparing Bayesian model averaging and stepwise regression[J]. BMC Medical Research Methodology, 2010, 10(1): 108. doi: 10.1186/1471-2288-10-108 [31] Madigan D, Raftery A E. Model selection and accounting for model uncertainty in Graphical Models using Occam's Window[J]. Journal of the American Statistical Association, 89 (428):, 1994: 111-196. [32] 张雄清, 张建国, 段爱国. 基于贝叶斯法估计杉木人工林树高生长模型的研究[J]. 林业科学, 2014, 50(3):69-75. [33] Zapata-Cuartas M, Sierra C A, Alleman L. Probability distribution of allometric coefficients and Bayesian estimation of aboveground tree biomass[J]. Forest Ecologyand Management, 2012, 277(4): 173-179. [34] Wang M, Liu Q, Fu L, et al. Airborne LIDAR-derived aboveground biomass estimates using a hierarchical Bayesian approach[J]. Remote Sensing, 2019, 11(9): 1050. doi: 10.3390/rs11091050 [35] 王少杰, 邓华锋, 向 玮, 等. 基于混合模型的油松林分蓄积量预测模型的建立[J]. 西北农林科技大学学报: 自然科学版, 2018, 46(2):29-38. [36] 周 梅, 李春干. 采用林分平均高和密度估计人工林蓄积量[J]. 广西林业科学, 2017, 46(3):319-324. doi: 10.3969/j.issn.1006-1126.2017.03.019 [37] 毛碧辉, 吕成群, 黄宝灵, 等. 不同造林密度对泡桐幼林生长和林分蓄积量的影响[J]. 安徽农业科学, 2018, 46(20):102-105. doi: 10.3969/j.issn.0517-6611.2018.20.031 [38] 王玉芬. 林分密度在营林生产中的应用[J]. 林业勘查设计, 2011(1):59-63. [39] 刘新亮, 章 挺, 邱凤英, 等. 造林密度对材用樟树幼林生长和蓄积量的影响[J]. 中南林业科技大学学报, 2019, 39(3):28-32. [40] 贾亚运, 何宗明, 周丽丽, 等. 造林密度对杉木幼林生长及空间利用的影响[J]. 生态学杂志, 2016, 35(5):1177-1181. [41] Zhang X, Cao Q V, Duan A, et al. Modeling tree mortality in relation to climate, initial planting density and competition in Chinese fir plantations using a Bayesian logistic multilevel method[J]. Canadian Journal of Forest Research, 2017, 47(9): 1278-1285. doi: 10.1139/cjfr-2017-0215 [42] 高露双, 王晓明, 赵秀海. 长白山阔叶红松林共存树种径向生长对气候变化的响应[J]. 北京林业大学学报, 2013, 35(3):24-31. -

 点击查看大图
计量
- 文章访问数: 5240
- HTML全文浏览量: 3677
- PDF下载量: 115
- 被引次数: 0


