


-
植物形态的可塑性反映了植物对于生存环境的适应能力。形态可塑性是个体在不同环境条件下改变其形态(即异速生长)的能力[1]。生长在无林木竞争和外界胁迫环境中的自由木的树冠通常会发育为较为对称的树冠形态,自由木的树冠垂直投影通常会近似于圆形[2]。然而在现实森林中,不论是在人工林还是天然林中,林木都会承受或多或少的竞争压力,这些压力通常是来自对树冠生长空间和光照的竞争,在这种竞争压力下,林木的树冠通常不会像自由木一样发育出对称、规则的树冠,更多的会发育出不对称或者不规则的树冠形态[3]。不同发育阶段、不同环境条件下树冠可塑性的表达,以及由此产生的树冠结构是一个值得研究的问题[4]。
树冠可塑性包括树冠在水平方向上的延伸和枝下高的变化[5-7]。大多数研究集中在水平面上,并且使用树冠垂直投影方法。一种常用的方法是比较观测到的实际冠形和理论上以树干为中心的不受约束的圆形。实际冠形与理论冠形的差异可以用来评估树冠可塑性和量化树冠可塑性减少的林木间竞争[8-9]。树冠中心到树干中心的位移距离已被广泛用于分析树冠可塑性[9-11],为了评估树冠在水平面上的偏冠程度,采用各种树冠偏冠指数评估树冠偏冠[12]。大部分树冠结构的调整是为了改善光捕获[13],调整的方式主要是通过向较空的空间移动[14],减少圆形轮廓[8],以及改变垂直层面和水平层面的尺寸大小[4-5,15-16]。
本研究利用详细的长白落叶松树冠半径调查数据,分析不同林龄长白落叶松树冠半径大小周向分布的差异和树冠偏冠的距离与方向,研究树冠偏冠与林木大小和竞争之间的关系。
-
在长白落叶松人工林的研究区中,分别在幼龄林、中龄林、近熟林和成熟林中设置调查样地,共设置了4块大小为600 m2的标准地,对标准地内达到5 cm起测径阶的所有林木的胸径、树高、枝下高等测树因子进行调查,使用格网法调查了样地中所有林木的空间坐标,并使用激光测距仪测量林木不同方向上的树冠半径。
林木树冠半径的测量是在北(N)、东北(NE)、东(E)、东南(SE)、南(S)、西南(SW)、西(W)、西北(NW)8个方向进行的,树冠半径调查工作由两个调查员进行,其中一人紧靠树干站立,使用指南针确定东西南北等树冠半径调查方向,指挥另一名调查员在该方向进行树冠半径测量工作,该调查员在此调查方向的树冠最外缘处站定,使用手持激光测距仪测量出该方向树冠最外缘到树干的水平距离,即为该方向的树冠半径,如此在8个方向进行测量,完成1株林木的树冠半径测量工作。
-
使用单木树冠偏冠距离和偏冠指数表示林木的树冠偏冠情况。偏冠距离(
$ {D}_{sc} $ ),定义为树干基部到树冠垂直投影面积中心的水平距离,表示树冠偏移的绝对值大小。树冠垂直投影面积中心是其8个方向树冠末端所围成的树冠垂直投影几何图形的中心。根据样地调查数据,在ArcGIS中绘制样地中所有林木的树冠垂直投影图和树干坐标,计算出每木树冠垂直投影的中心坐标和树干坐标,连接林木树干坐标点和树冠垂直投影中心点的矢量即为该林木的树冠偏移矢量,矢量长度为树冠偏冠距离,矢量方向为树冠偏冠方向。偏冠指数反映了树木的偏冠程度,取值范围为0~1,该值越高,表明树冠中心偏离树干的程度越大。为了比较不同大小林木的偏冠程度,引用了6个经典的偏冠指数作为树冠偏冠程度的度量指标[12],其计算公式如下:$ C A I_{1}=1-\frac{R_{\min }}{\overline{R}} $
(1) $ C A I_{2}=\sqrt{\left(\frac{\sum_{i=1}^{N} R_{i} cos \theta_{i}}{\sum_{i=1}^{N} R_{i}}\right)^{2} + \left(\frac{\sum_{i=1}^{N} R_{i} sin \theta_{i}}{\sum_{i=1}^{N} R_{i}}\right)^{2}} $
(2) $ C A I_{3}=\frac{D_{s c}}{R_{\max }} $
(3) $ C A I_{4}=1-\frac{1}{\mathrm{N}} \sum\limits_{i=1}^{N} \frac{\bar{R}}{\left|R_{i}-\bar{R}\right| + \bar{R}} $
(4) $ C A I_{5}=\frac{\sum\limits_{i=1}^{N}\left|R_{i}-\overline{R}\right|}{2 \sum\limits_{i=1}^{N} R_{i}} $
(5) $ C A I_{6}=\frac{1}{N_{P}} \sum\limits_{i=1}^{N_{P}} \frac{\left|\overleftarrow{R_{i}}-\overrightarrow{R_{i}}\right|}{\overleftarrow{R_{i}} + \overrightarrow{R_{i}}} $
(6) 式中:
$ {{R}}_{\rm{min}} $ 为测量树冠半径中的最短树冠半径值,$ \overline{{R}} $ 为平均树冠半径值,$ {{R}}_{{i}} $ 为第i个树冠半径的测量值,$ {{θ}}_{{i}} $ 为第i个树冠半径的方位角,N为树冠半径的测量数量。$ {{R}}_{{\max}} $ 为树冠半径最大值,$ {{N}}_{{P}} $ 为树冠半径的测量对数,$ \stackrel{⃐}{{{R}}_{{i}}} $ 与$ \stackrel{⃑}{{{R}}_{{i}}} $ 为第i对相反的树冠半径值[12]。 -
在样地边界设置4 m宽的缓冲区,以样地中除去缓冲区内的林木为目标树,考虑到林木之间距离和目标树树冠与周围林木树冠的空间分布情况,将目标树周围距离最近的4株活立木作为竞争树,以经典的空间竞争指数Hegyi指数为基础,使用以下4个公式计算了4种与空间位置相关的单木竞争指数[17-18],用来表征林木受到的竞争强度。
$ C I_{\mathrm{d}}=\sum\limits_{j=1}^{N} D_{j} /\left(D_{i} \times L_{i j}\right) $
(7) $ C I_{\mathrm{h}}=\sum\limits_{j=1}^{N} H_{j} /\left(H_{i} \times L_{i j}\right) $
(8) $ C I_{\mathrm{dd}}=\sum\limits_{j=1}^{N}\left(D_{j} / D_{i}\right)^{2} / L_{i j} $
(9) $ C I_{\mathrm{hh}}=\sum\limits_{j=1}^{N}\left(H_{j} / H_{i}\right)^{2} / L_{i j} $
(10) 式中:
$ {D}_{j} $ 为第j个竞争木的胸径,$ {D}_{i} $ 为目标木i的胸径,$ {L}_{ij} $ 为第j个竞争木与目标木i的水平距离,$ {H}_{j} $ 为第j个竞争木的树高,$ {H}_{i} $ 为目标木i的树高。本研究中使用的4个单木竞争指数是利用R(3.6.5)中的“spatstat”包和“forestSAS”包完成计算的。
-
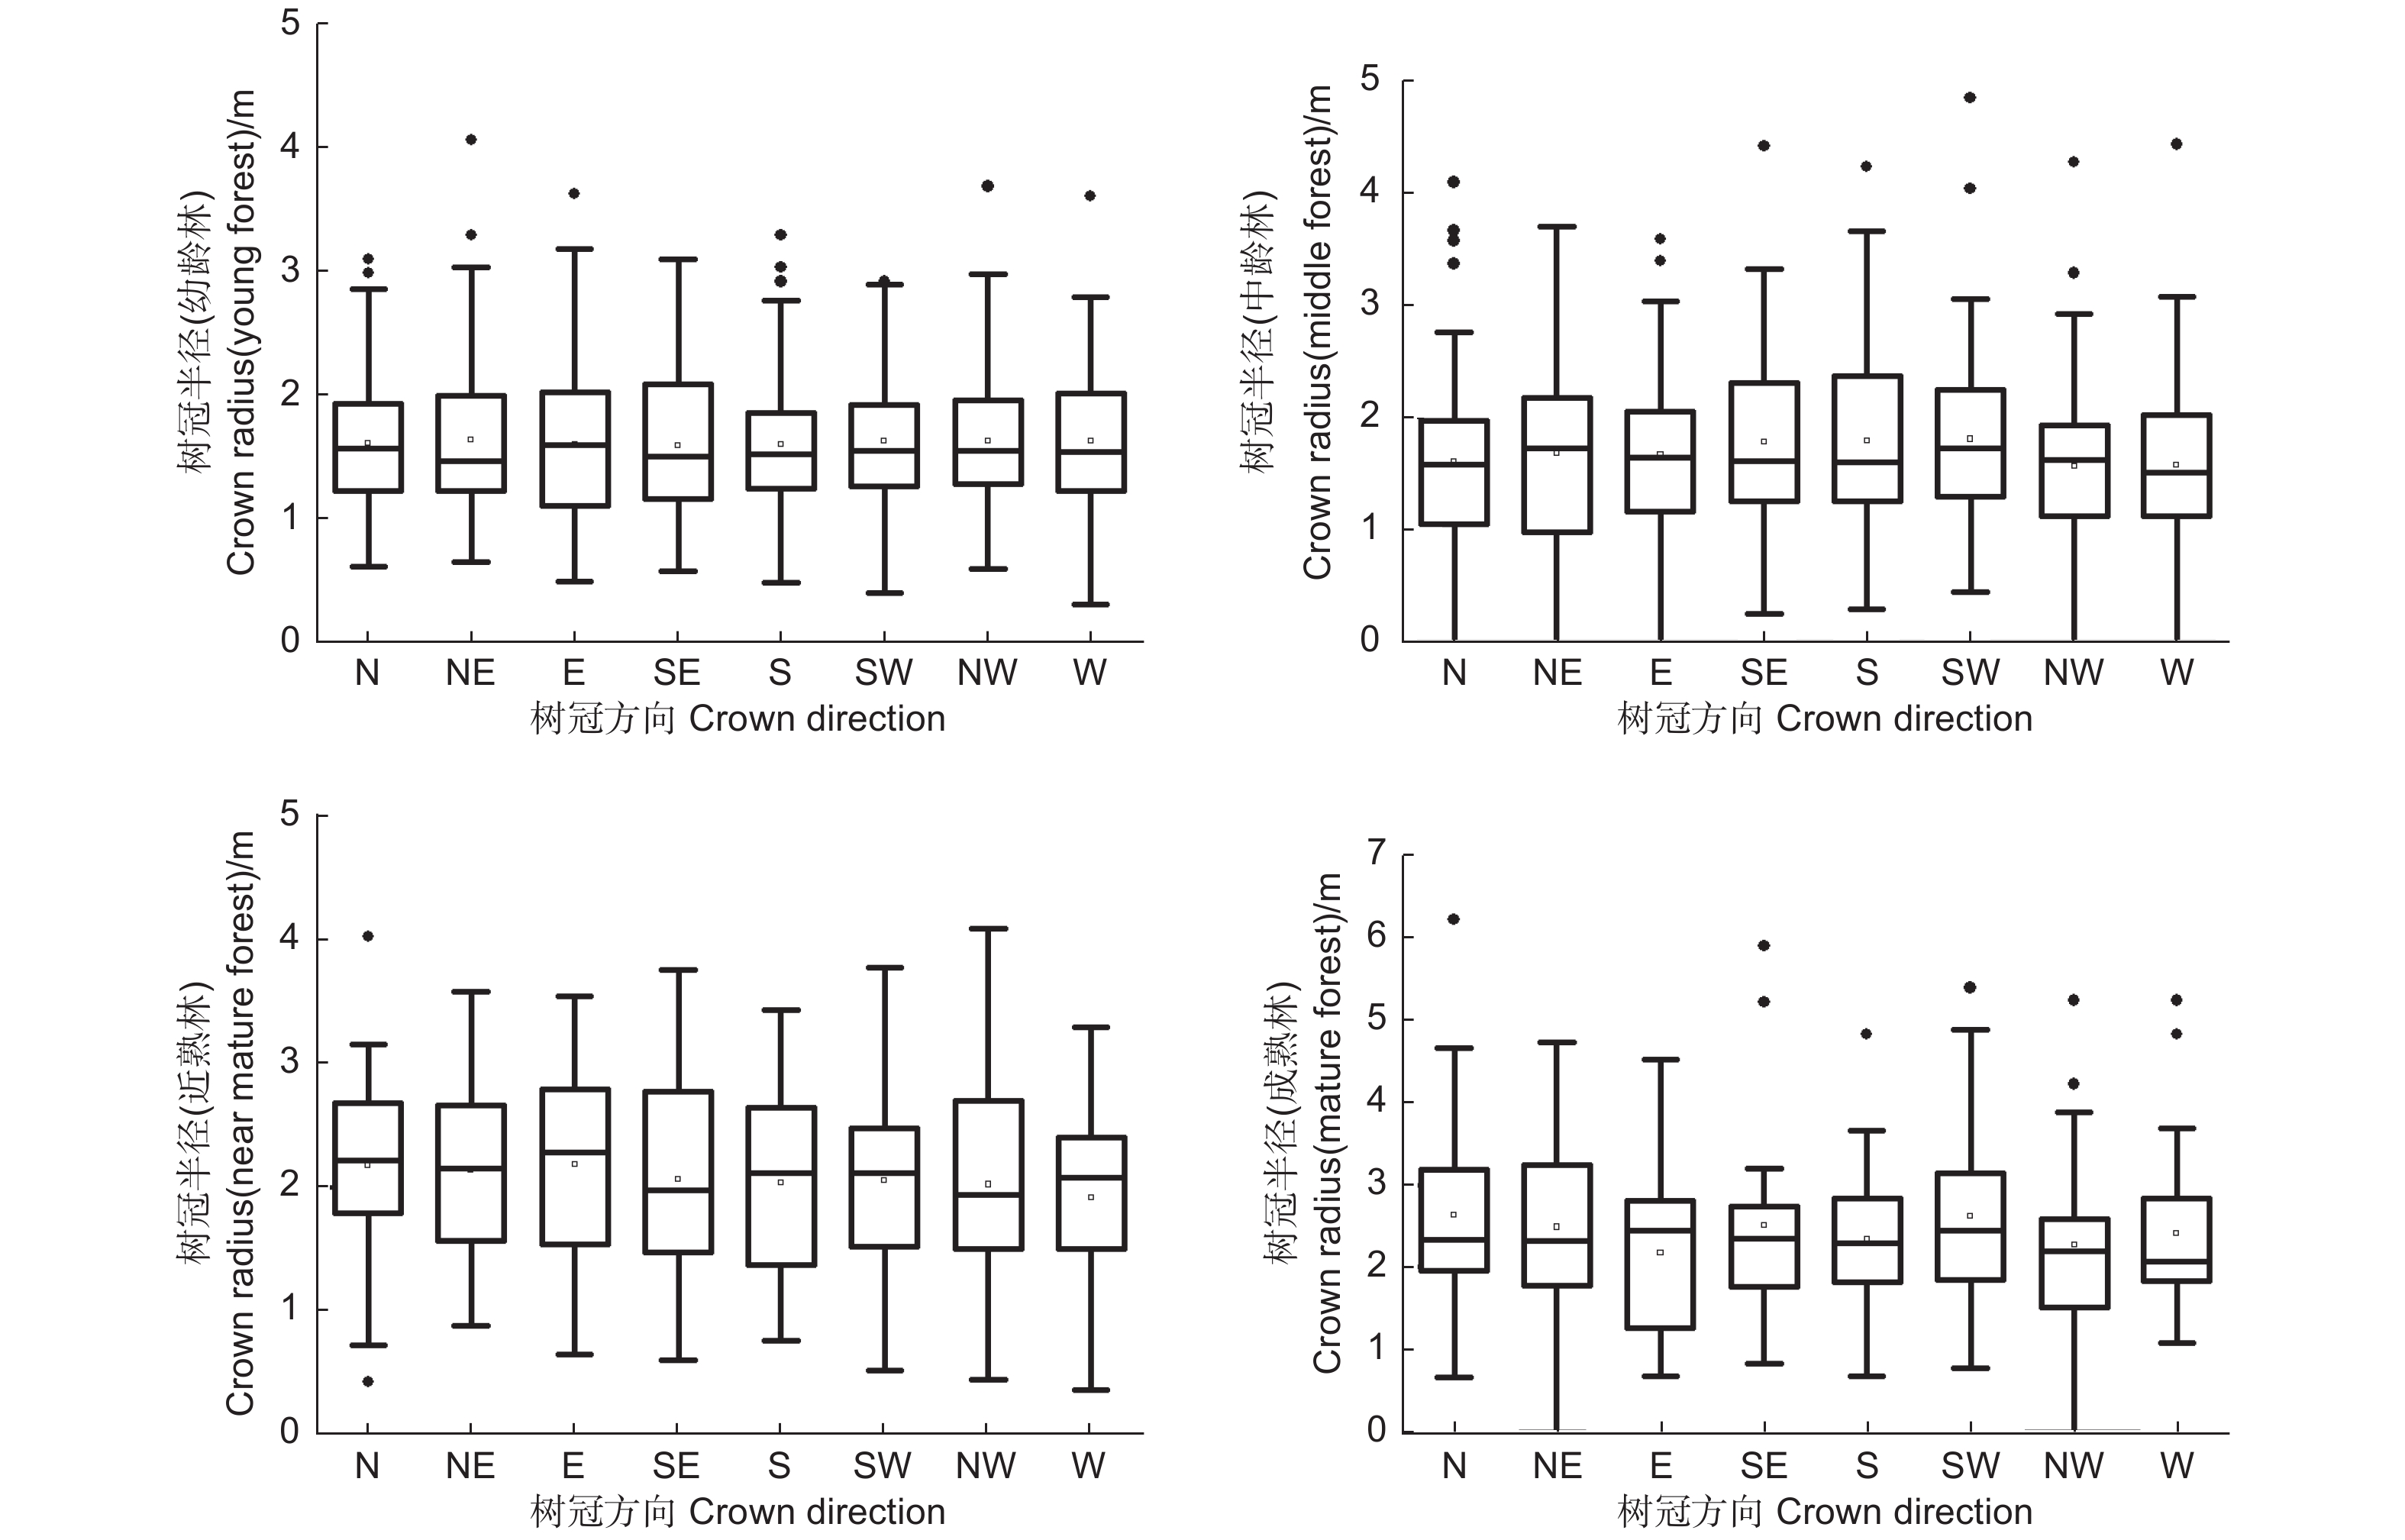
使用林木树冠半径在北(N)、东北(NE)、东(E)、东南(SE)、南(S)、西南(SW)、西(W)、西北(NW)8个方向上的调查数据,在样地水平上对8个方向的树冠半径进行了基本的统计对比,从表1中可以看出,在幼龄林样地中,8个方向上树冠半径的平均值均在1.60 m左右,不同方向之间的平均值最大差异为0.05 m,在样地水平上,幼龄林中长白落叶松不同方向之间的树冠半径平均值基本相同。在中龄林样地中,8个方向上树冠半径的平均值在1.60 m到1.82 m的范围内,不同方向之间的平均值最大差异为0.22 m其中西南、南、东南3个方向的树冠半径平均值较大,在1.80 m左右,北、西北、西3个方向的树冠半径平均值较小,在1.60 m左右。在近熟林样地中,8个方向上树冠半径的平均值在1.66 m到1.85 m的范围内,不同方向之间的平均值最大差异为0.21 m,其中东南方向的树冠半径平均值最大为1.85 m,西北方向的树冠半径平均值最小为1.66 m。在成熟林样地中,8个方向上树冠半径的平均值在2.17 m到2.63 m的范围内,不同方向之间的平均值最大差异为0.46 m,其中北、西南方向的树冠半径平均值最大为2.63 m,东方向的树冠半径平均值最小为2.17 m。
表 1 长白落叶松树冠半径在不同方向的统计值(平均值±标准差)
Table 1. Statistical values for the distance of crown displacement in different plot
龄组
Age class胸径/cm
DBH树高/m
Height树冠半径/m N NE E SE S SW W NW 幼龄 (13 a) 13.87 (±4.14) 10.44 (±1.47) 1.61 (±0.53) 1.64 (±0.64) 1.60 (±0.64) 1.59 (±0.59) 1.60 (±0.51) 1.62 (±0.51) 1.62 (±0.58) 1.63 (±0.56) 中龄 (27 a) 18.83 (±4.84) 19.42 (±1.35) 1.63 (±0.86) 1.71 (±0.78) 1.70 (±0.75) 1.80 (±0.80) 1.80 (±0.78) 1.82 (±0.81) 1.60 (±0.70) 1.61 (±0.71) 近熟 (34 a) 22.93 (±5.00) 20.49 (±0.67) 1.79 (±0.84) 1.79 (±0.81) 1.78 (±0.80) 1.85 (±0.72) 1.77 (±0.75) 1.80 (±0.82) 1.71 (±0.82) 1.66 (±0.76) 成熟 (54 a) 26.88 (±7.28) 22.25 (±5.03) 2.63 (±1.40) 2.49 (±1.18) 2.17 (±0.92) 2.51 (±1.17) 2.34 (±0.86) 2.63 (±1.19) 2.27 (±1.03) 2.41 (±1.14) 不同方向的树冠半径数据的整体分布如图1所示,单因素方差分析的结果表明,幼龄林、中龄林、近熟林和成熟林样地中林木不同方向的树冠半径平均值均不存在显著性差异,故在图中没有进行符号标注。在样地水平上,不同方向间树冠半径的平均值大小的差异不显著。
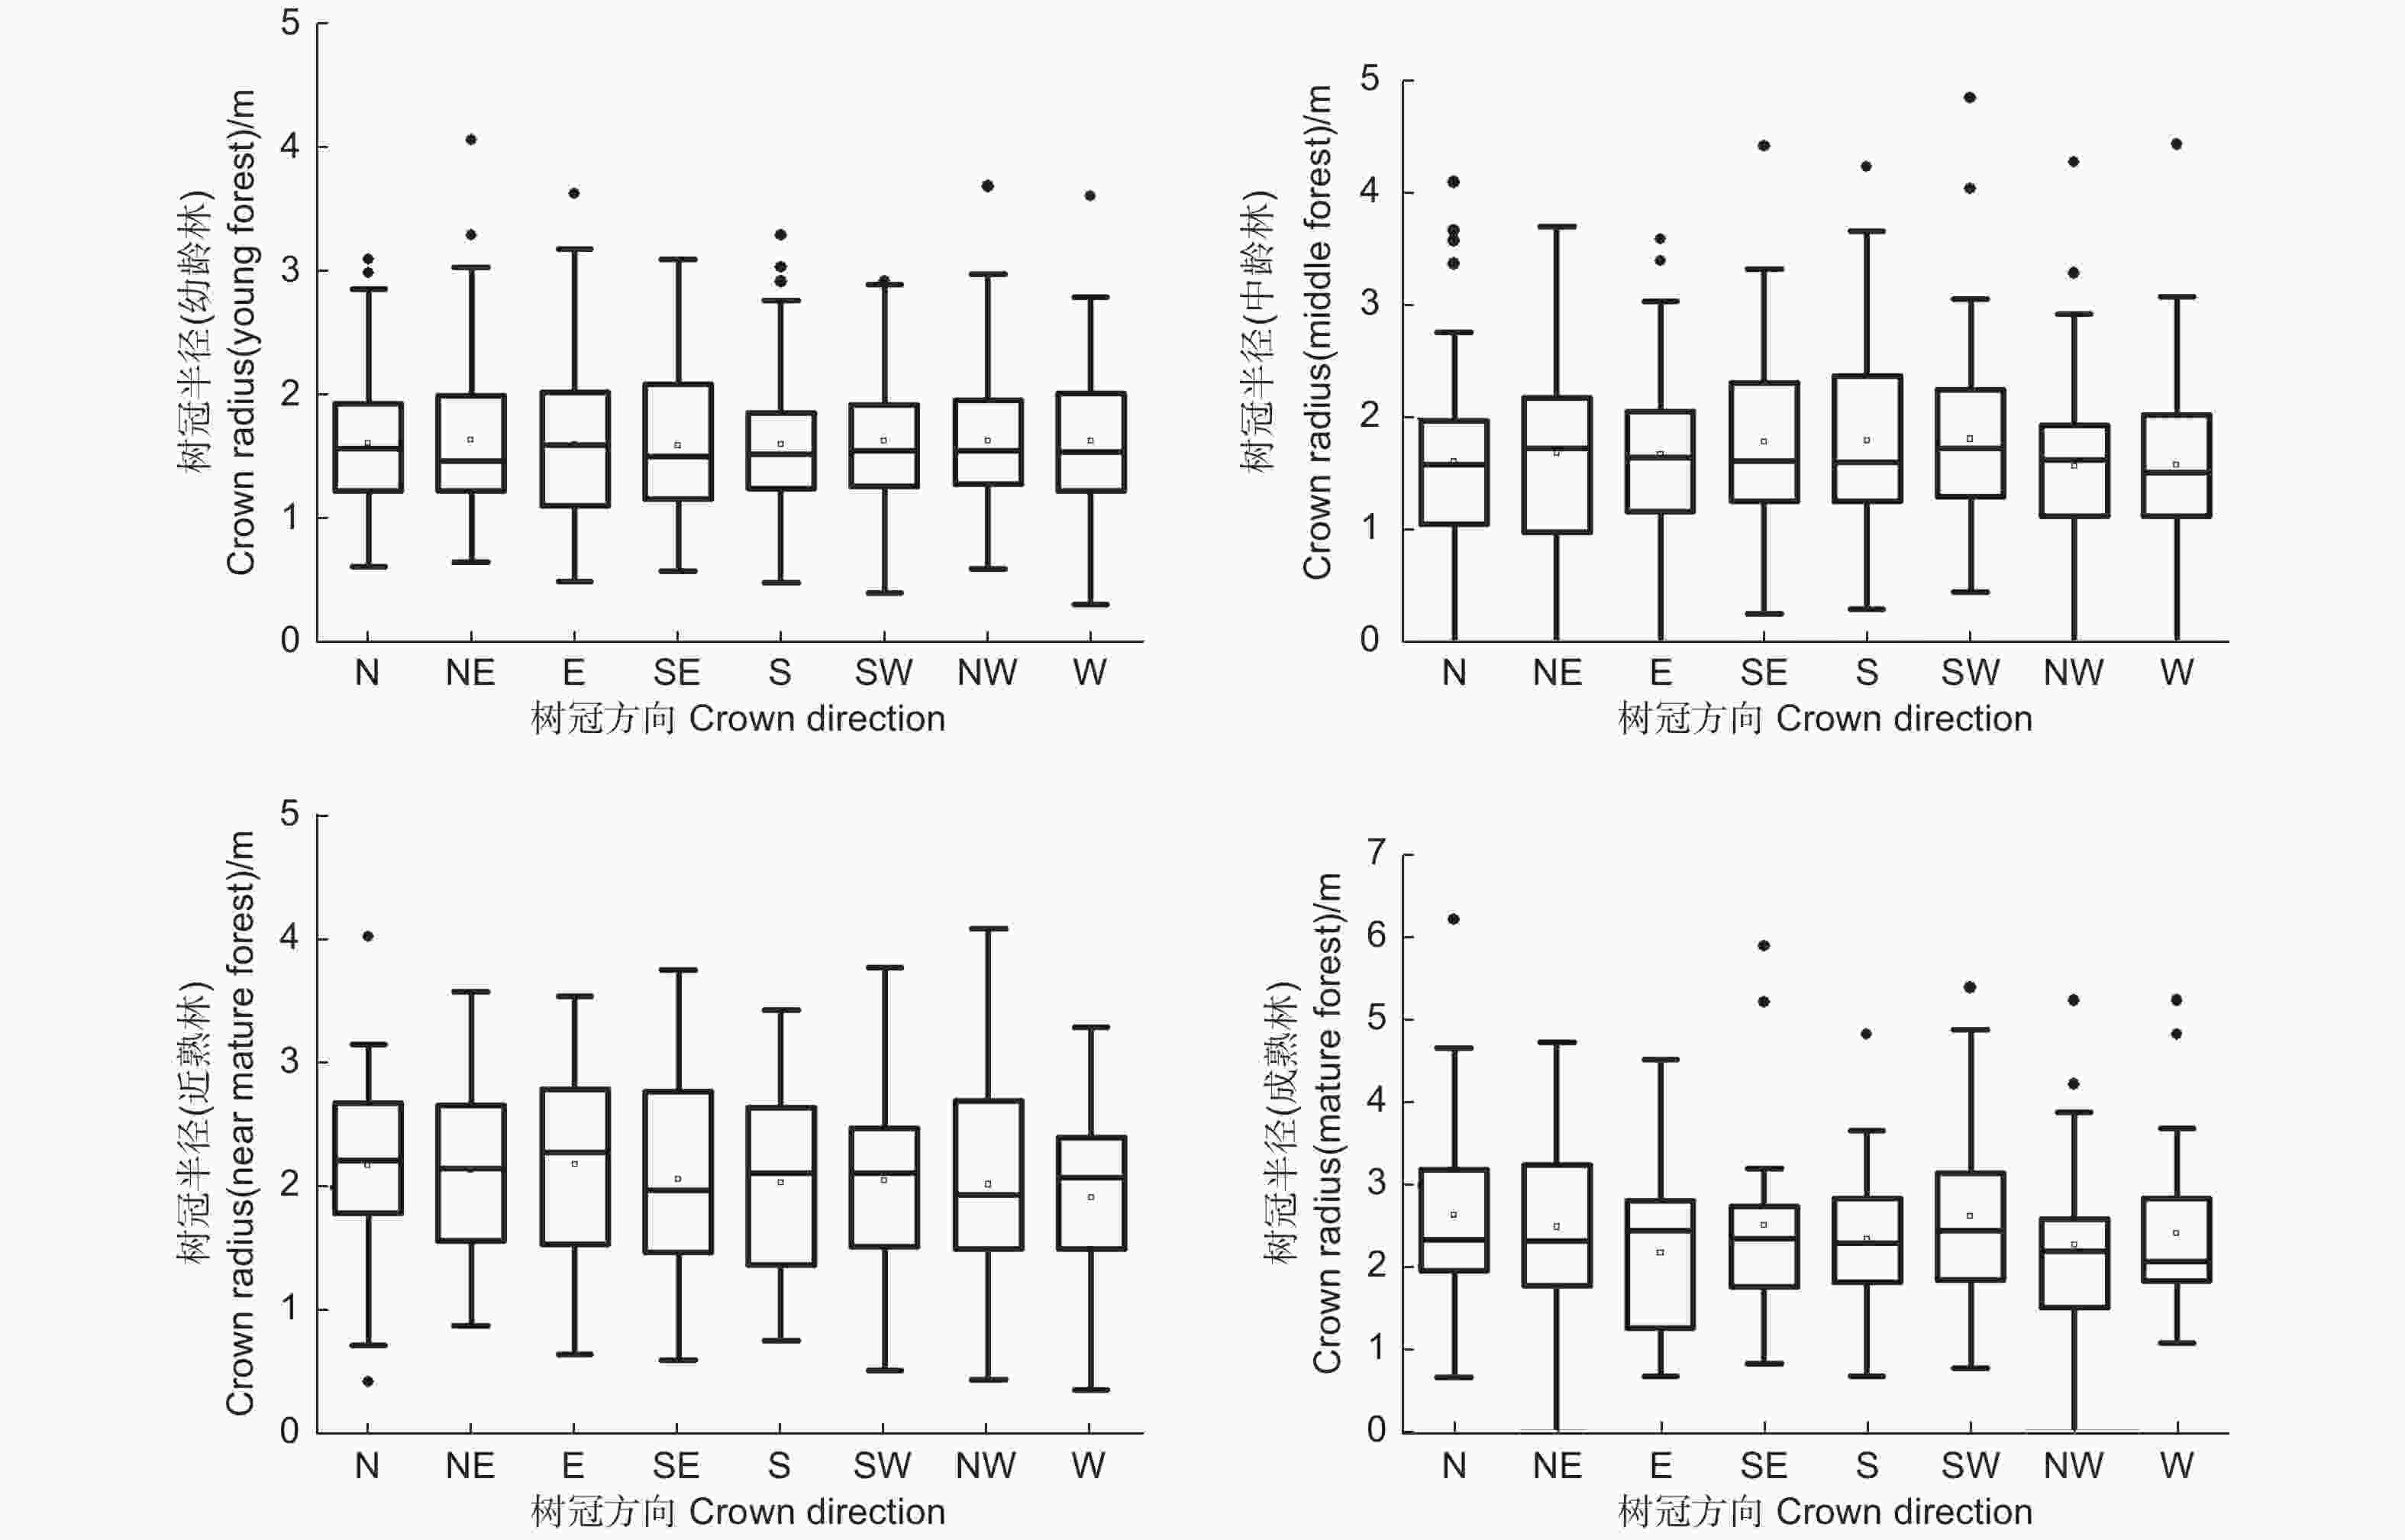
图 1 不同方向树冠半径的箱线
Figure 1. Box-plot of the radius of the canopy in different directions
-
通过对各个方向树冠半径的平均值进行比较发现,在样地水平上,各个方向树冠半径的平均值不存在显著差异,对于单木而言,不同方向的树冠半径之间是否存在显著差异,有必要进行进一步分析。图2描绘了调查样地中每株林木在8个方向上的树冠半径值,可以看出,同1株林木的8个方向的树冠半径值分布较为离散,最大值和最小值之间差异较大。为了定量表示同1株林木不同方向树冠半径之间的差异,计算了每株林木的树冠半径变异系数,树冠半径变异系数反映了单木不同方向树冠半径的离散程度[19]。
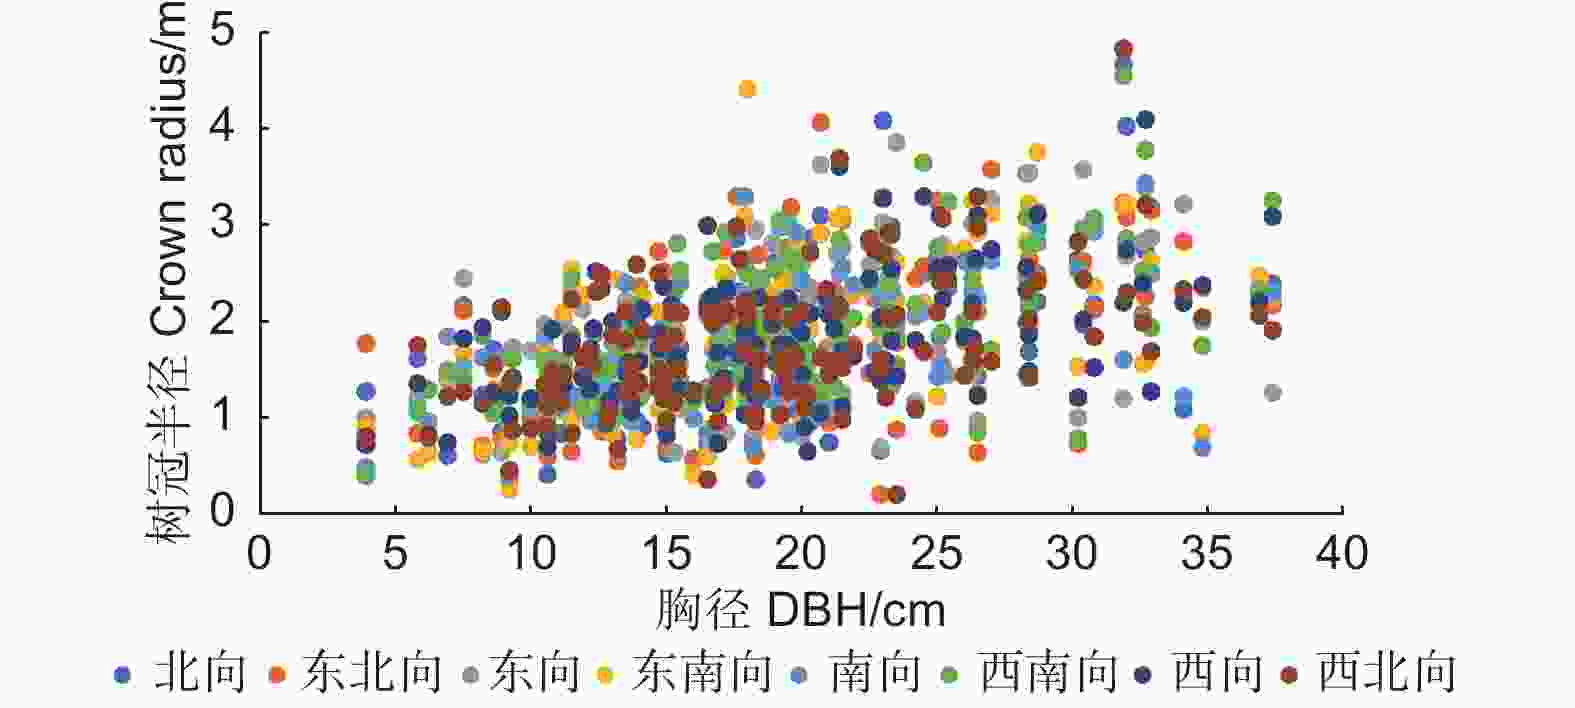
图 2 单木水平不同方向树冠半径的大小分布
Figure 2. Distribution of crown radius in different directions of the single-tree
单木的树冠半径变异系数结果如表2所示,可以看出,不同林龄样地中林木的树冠变异系数的平均值均处于较高的水平,大于20%。幼龄林和成熟林中林木的树冠半径变异系数的最小值为7.1%和5.8%,而中龄林和近熟林中的最小值则在13.0%以上,其中近熟林中林木的树冠半径变异系数最小值达到了16.0%,一般认为变异系数超过15%则认为数据间差异较大。幼龄林样地中林木的树冠半径变异系数最大值为48.6%,中龄林、近熟林和成熟林中单木树冠变异系数均在55.0%以上。
表 2 长白落叶松单木不同方向树冠半径的变异系数
Table 2. Coefficientvariation for the crownradius in different directioninsingle-treelevel %
龄组
Age class平均值
Mean最小值
Min最大值
Max标准差
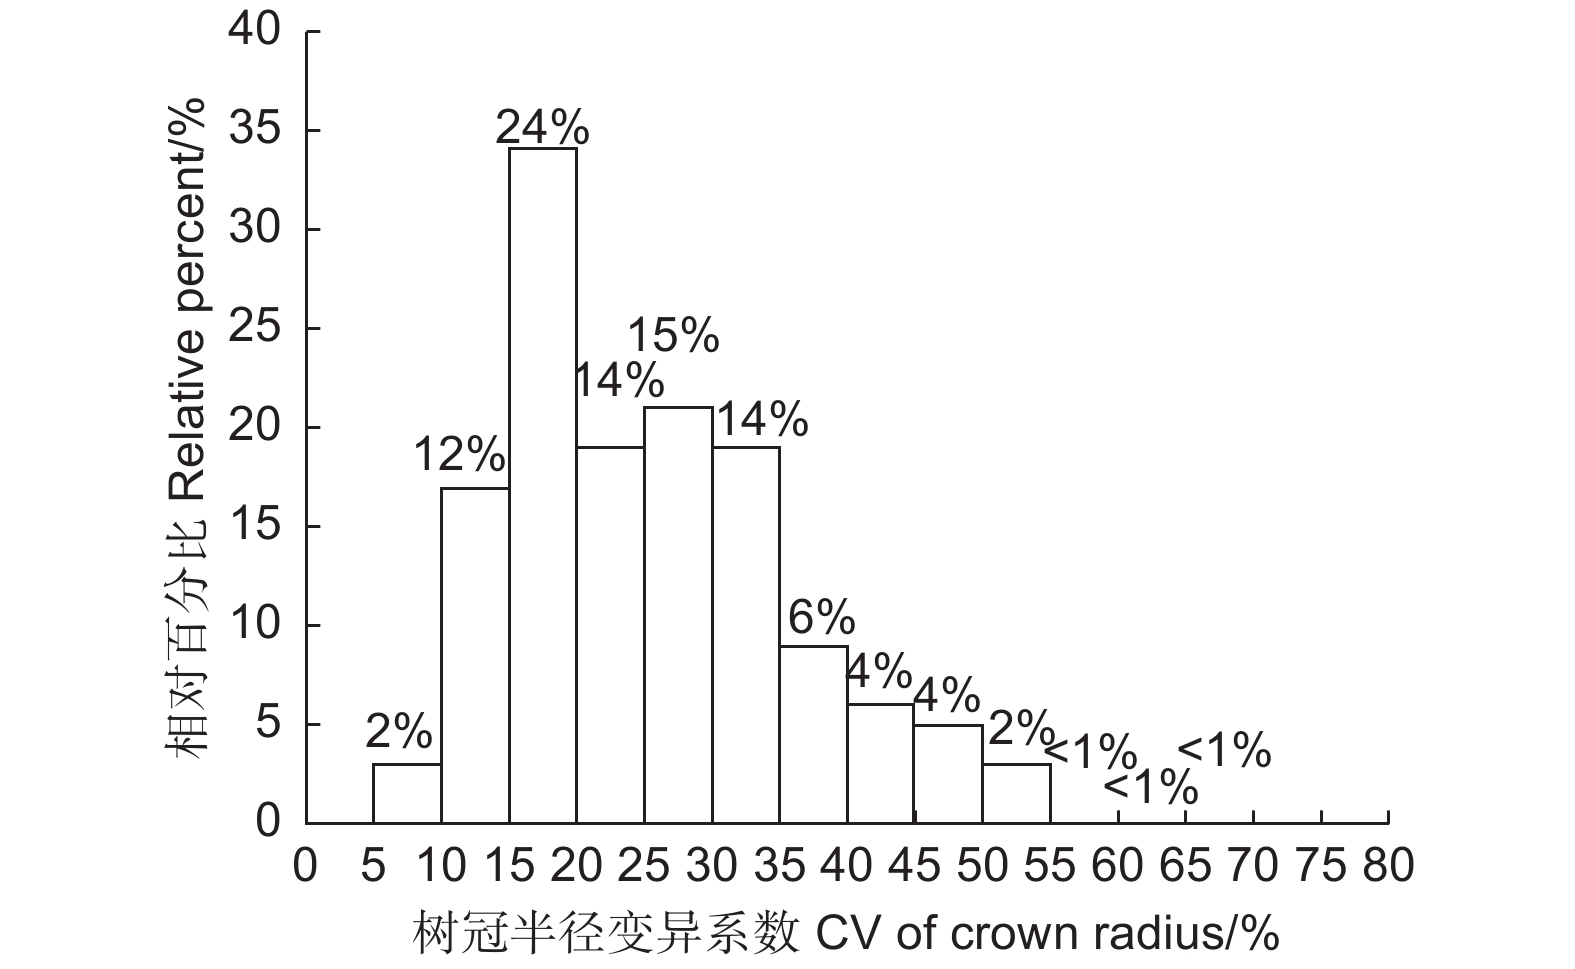
SD幼龄林 Young 23.1 7.1 48.6 9.9 中龄林 Middle age 28.4 13.1 55.0 11.6 近熟林 Near-mature 26.8 16.0 62.1 10.3 成熟林 Mature 28.8 5.8 65.0 15.7 图3 统计了调查林木的树冠变异系数的总体分布频率,大部分林木的树冠半径变异系数大于15%,小于15%的林木占比很小,只有14%。总体而言,长白落叶松不同方向上的树冠半径存在较大程度差异。
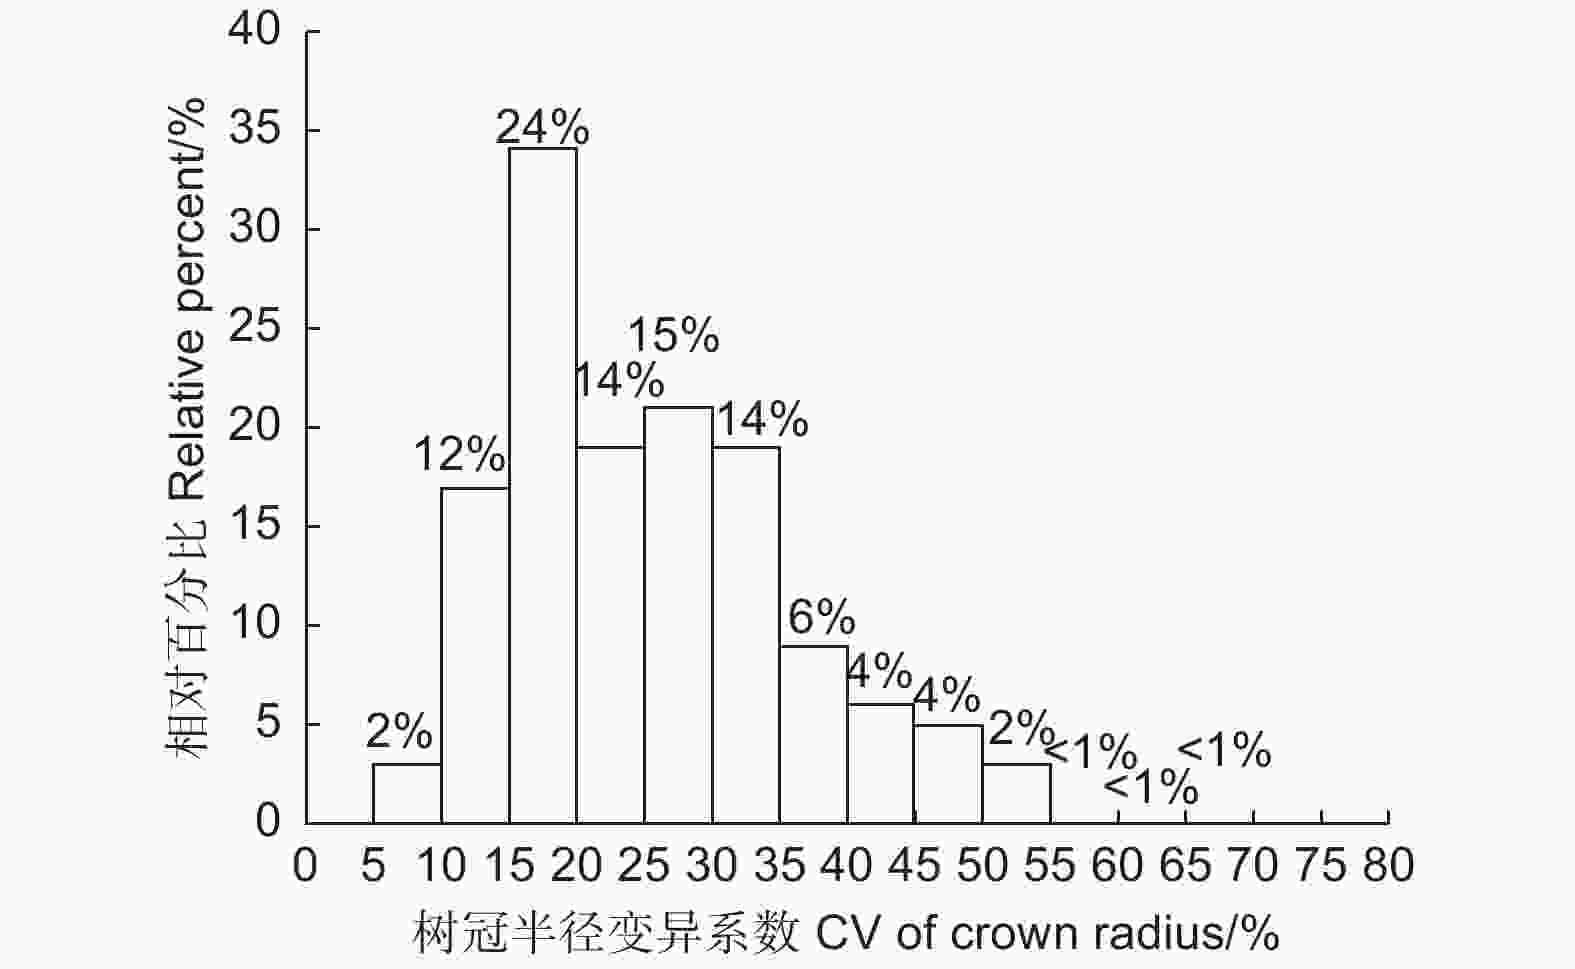
图 3 树冠半径变异系数的频率分布
Figure 3. The frequency distribution of the crown radius coefficient variation
-
通过8个方向的树冠半径调查数据,在ArcGIS中绘制了调查样木的树冠垂直投影图,并计算出树冠垂直投影图的几何中心,结合该几何中心的坐标和树干坐标,计算得出树冠垂直投影图几何中心相对于树干的方位和距离,该方位即为偏冠方向,距离即为该林木的偏冠距离。
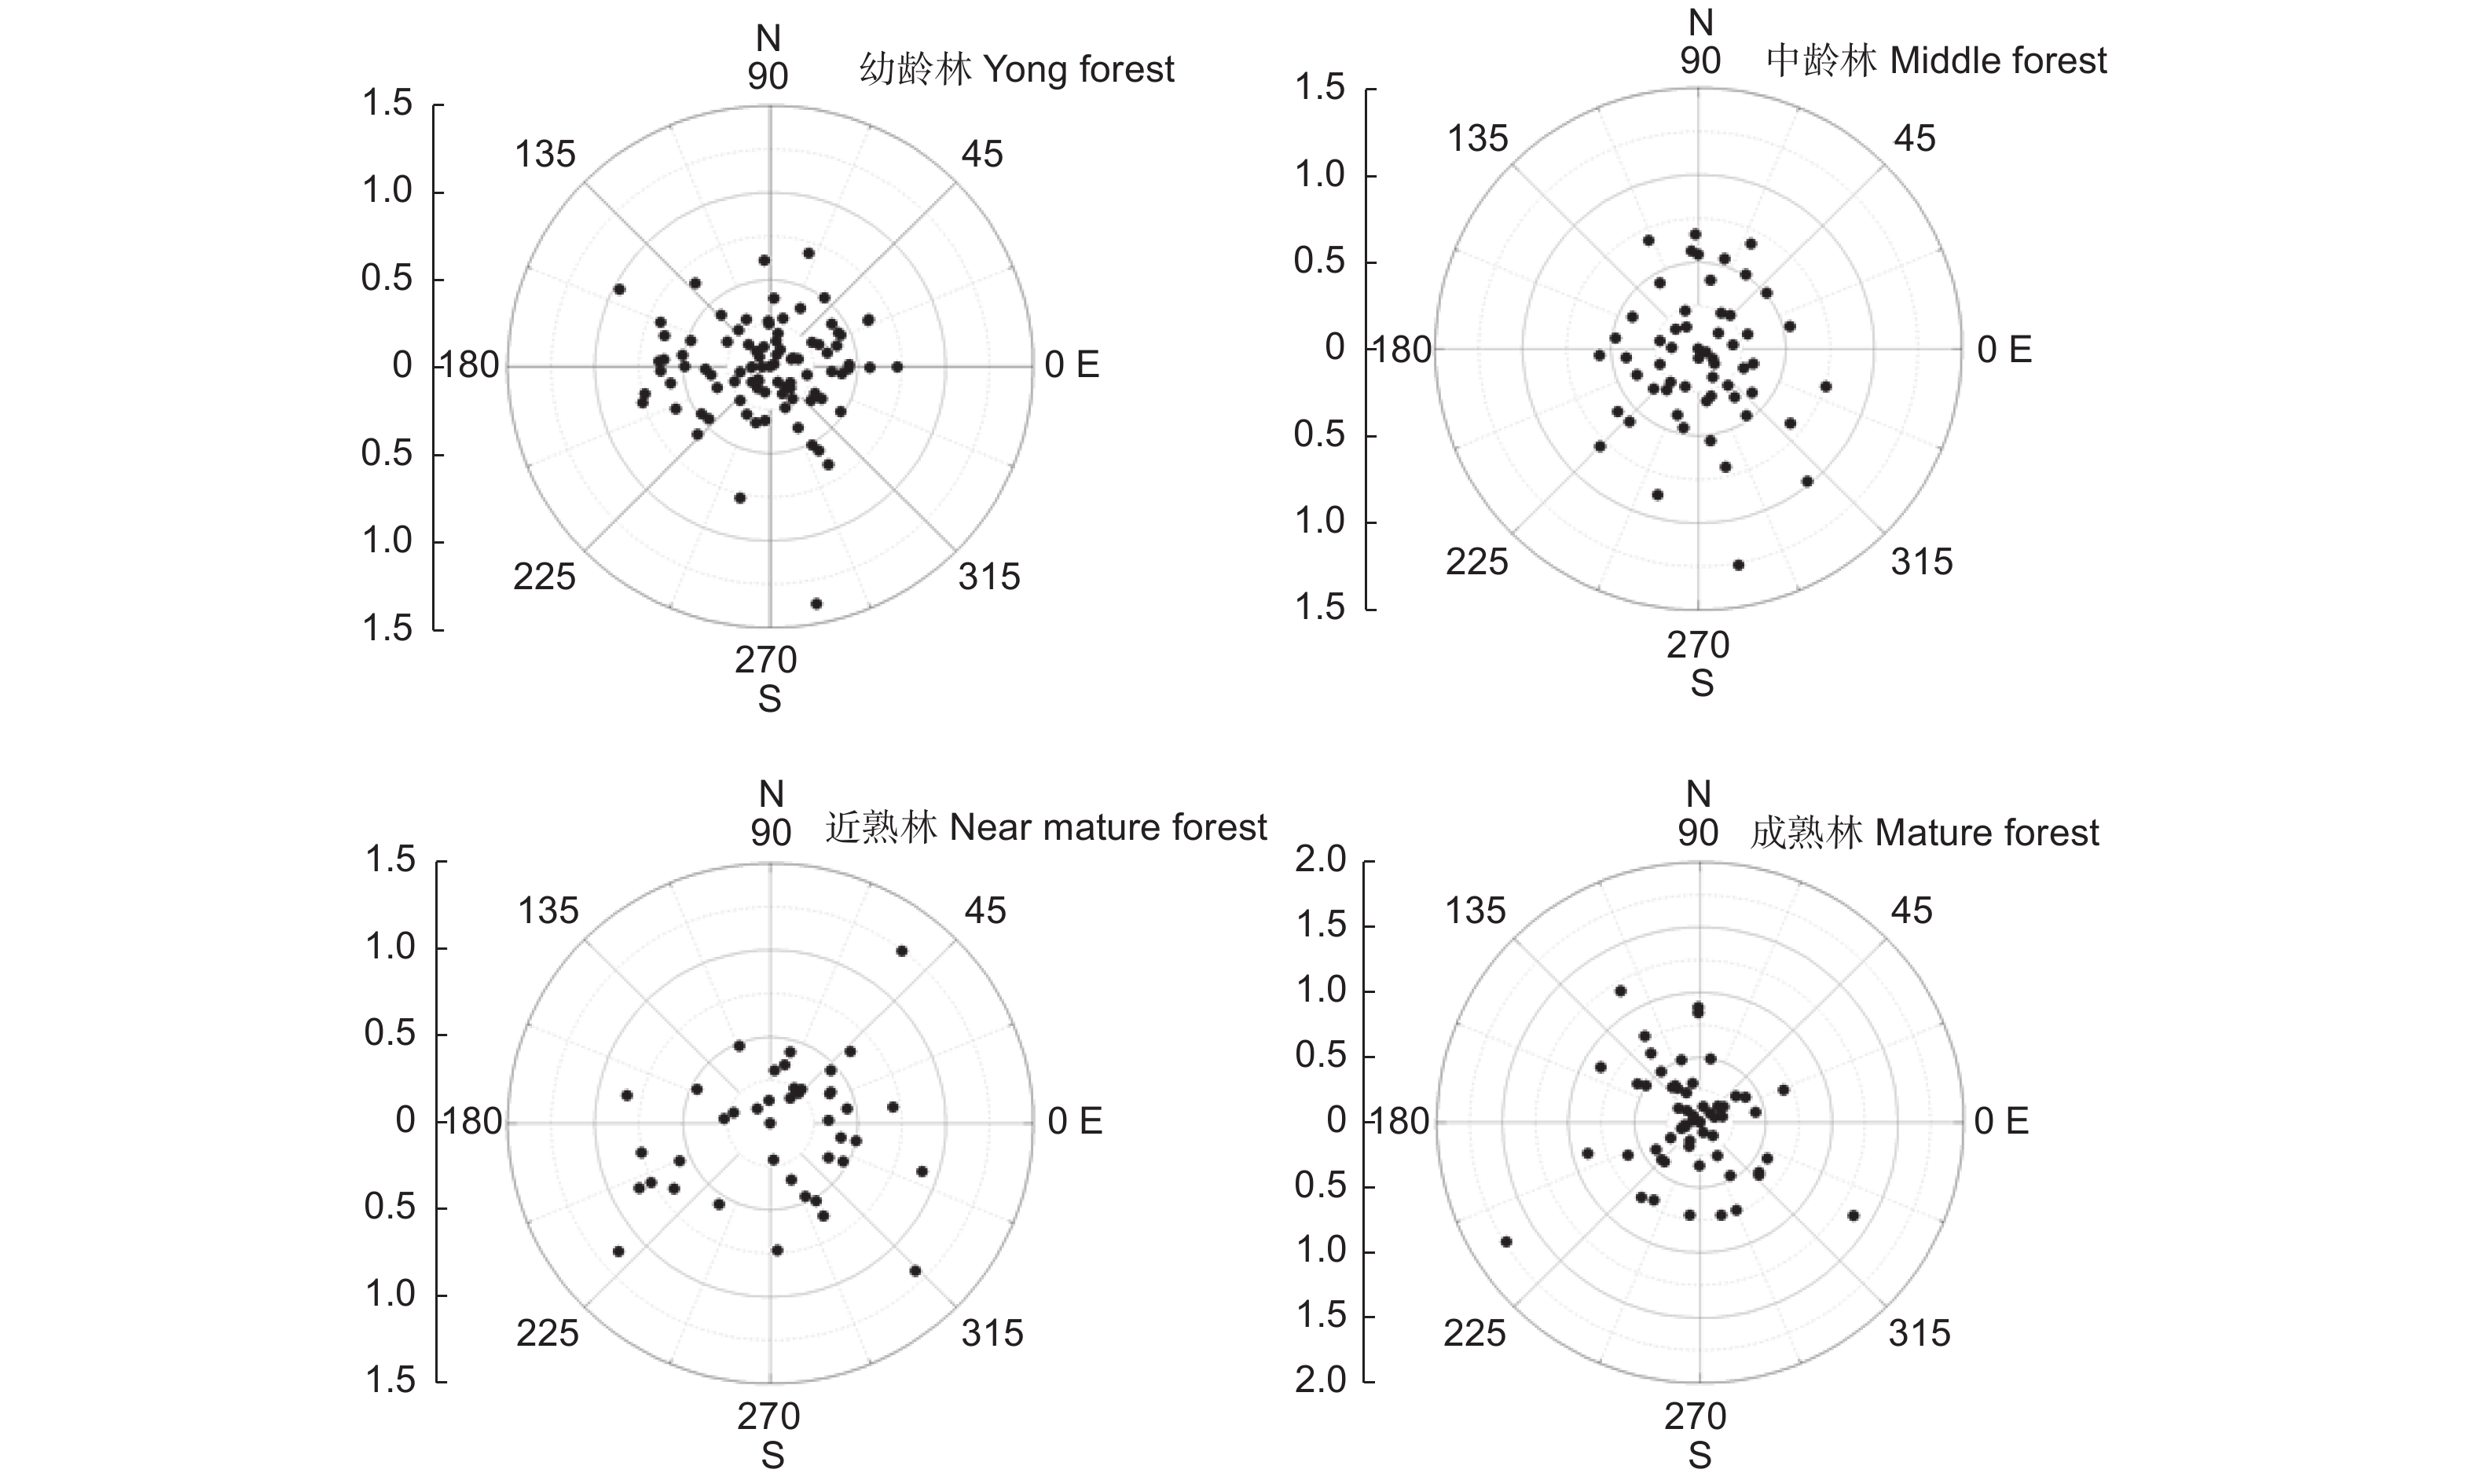
为直观表示调查样地中所有林木的偏冠距离和偏冠方向,使用极坐标图描绘了不同林龄的长白落叶松调查样地中每株林木的树冠偏冠距离和偏冠角度(图4)。数据点与圆心之间的距离为偏冠距离,数据点所在方向为偏冠方向。图4绘制了不同林龄长白落叶松样地中林木的偏冠距离和偏冠方向的整体分布趋势,可以看出,幼龄林中的偏冠距离值分布比较集中,大部分偏冠距离值在0.5 m范围内,中龄林和近熟林中的偏冠距离值分布较为分散,偏冠距离也相对更大,成熟林中偏冠距离值分布相对集中。

图 4 不同林龄样地长白落叶松的偏冠距离与偏冠角度的极坐标
Figure 4. Polar coordinates of crown displacement distance and angle of Larix olgensis of different plots
表3统计了不同林龄样地中长白落叶松偏冠距离的统计值,由表3可知,偏冠距离的平均值在0.35~0.51 m之间,其中近熟林中林木的平均偏冠距离最大,幼龄林中林木的平均偏冠距离最小,各样地中林木偏冠距离的最大值均在1.2 m以上,成熟林中林木偏冠距离的最大值达到1.73 m。
表 3 不同林龄样地中长白落叶松的偏冠距离统计值
Table 3. Statistical values for the distance of crowndisplacement in different plot
龄组
Age class平均值
Mean/m最小值
Min/m最大值
Max/m标准差
SD/m幼龄林 Young 0.35 0.00 1.39 0.24 中龄林 Middle age 0.38 0.04 1.26 0.25 近熟林 Near-mature 0.51 0.11 1.24 0.27 成熟林 Mature 0.45 0.08 1.73 0.33 幼龄林、中龄林、近熟林、成熟林样地中的树冠偏冠方向是均匀分布还是有特定的方向偏向,需要经过瑞利均匀性检验(Rayleigh test)来验证,在4个样地中,相应的瑞利均匀性检验的p值均大于0.05(表4),表明样地中林木的树冠偏冠没有特定的方向偏向,树冠向各个方向的偏移是均匀分布的。
表 4 不同林龄样地中长白落叶松的偏冠方向的瑞利均匀性检验
Table 4. Rayleigh test statistics of different plots
龄组
Age classRayleigh test 统计值
Statisticsp值
p value幼龄林 Young 0.040 0.857 中龄林 Middle age 0.144 0.228 近熟林 Near-mature 0.228 0.095 成熟林 Mature 0.156 0.213 -
为研究树冠偏冠与林木大小的关系,对偏冠距离、偏冠指数和林木大小因子进行了相关性分析。由表5可知,在幼龄林中,林木的偏冠距离与胸径、冠长、平均树冠半径呈显著正相关,与平均树冠半径的相关系数最大,说明在幼龄林中,树冠偏冠距离随树木增大而增大。在中龄林和近熟林中,偏冠指数与胸径、树高和平均树冠半径呈显著负相关,与高径比呈显著正相关。林分发育到中龄林和近熟林阶段时,树冠偏冠程度随树木增大而减小,可能是因为在该阶段中,个体较大的林木发展成优势木占据上层生长空间,对光资源的竞争能力更强,偏冠程度越小。在成熟林中,偏冠距离与偏冠指数与林木大小的相关性不显著。
表 5 偏冠程度与单木测树因子的相关系数
Table 5. Relationship between crown asymmetric index and tree measurement factors
龄组
Age class偏冠指标
Indices胸径
DBH树高
H高径比
HDR枝下高
HCB冠长
CL平均树冠半径
Crown radius幼龄林
YoungDsc 0.289** 0.114 −0.220* −0.189 0.258* 0.368*** CAI1 −0.102 −0.140 0.125 −0.147 0.045 −0.115 CAI2 −0.112 −0.108 0.170 −0.069 −0.008 −0.049 CAI3 −0.086 −0.106 0.134 −0.106 0.029 −0.027 CAI4 −0.041 −0.041 0.096 −0.058 0.028 −0.009 CAI5 −0.061 −0.053 0.122 −0.057 0.018 −0.023 CAI6 −0.092 −0.112 0.135 −0.076 −0.003 −0.019 中龄林
Middle-ageDsc 0.081 −0.086 −0.115 −0.161 0.130 0.234 CAI1 −0.306* −0.328* 0.309* −0.147 0.019 −0.283* CAI2 −0.398** −0.304* 0.355** 0.039 −0.163 −0.314* CAI3 −0.380** −0.339* 0.371** 0.070 −0.209 −0.431** CAI4 −0.397** −0.374** 0.396** 0.047 −0.199 −0.361** CAI5 −0.411** −0.371** 0.417** 0.029 −0.179 −0.364** CAI6 −0.377** −0.334* 0.354** −0.013 −0.121 −0.332* 近熟林
Near-matureDsc −0.062 −0.034 0.079 −0.041 0.026 −0.022 CAI1 −0.439** −0.317 0.470** −0.193 0.059 −0.393* CAI2 −0.512** −0.418* 0.528*** −0.060 −0.111 −0.507** CAI3 −0.384* −0.257 0.404* −0.048 −0.057 −0.417* CAI4 −0.554*** −0.473** 0.593*** −0.089 −0.104 −0.546*** CAI5 −0.566*** −0.510** 0.599*** −0.096 −0.113 −0.561*** CAI6 −0.526*** −0.480** 0.544*** −0.152 −0.046 −0.499** 成熟林
MatureDsc 0.073 0.045 −0.158 0.080 −0.078 0.121 CAI1 0.094 0.140 −0.054 0.172 −0.049 −0.174 CAI2 0.035 0.122 0.064 0.231 −0.243 −0.287 CAI3 0.106 0.157 −0.034 0.229 −0.142 −0.269 CAI4 −0.008 0.096 0.085 0.116 −0.027 −0.237 CAI5 0.010 0.127 0.107 0.161 −0.054 −0.269 CAI6 0.038 0.099 0.006 0.192 −0.206 −0.203 注:Dsc为偏冠距离;CAI1-CAI6为偏冠指数
Note: Dsc is the distance of crown displacement and CAI1-CAI6 is the crown asymmetric index. -
由于树冠偏冠造成了林木树冠主体在空间上的相对偏移,当以树冠为主体分析竞争压力时可能会与以树干为主体分析竞争压力时的结果不一致,为了分析两种情况下的林木竞争压力的差异,研究树冠偏冠对林分平均竞争水平的影响,本研究分别以树干坐标和树冠中心坐标计算了4种基于Hegyi指数的单木竞争指数。由于树冠的三维空间结构在传统调查中较难获取,本研究中使用的树冠中心是使用树冠的垂直投影图的几何中心来表示。树冠垂直投影中心坐标是通过8个方向的树冠半径调查数据,在ArcGIS中绘制的调查样木的树冠垂直投影图计算得到的几何中心坐标。在下文中,CId_s,CIdd_s,CIh_s,CIhh_s 表示以树干坐标(stem)计算的4种单木竞争指数,CId_c,CIdd_c, CIh_c,CIhh_c表示以树冠中心坐标(crown)计算的4种单木竞争指数。
-
在R语言中计算了偏冠指标与单木竞争指数的Pearson相关系数,结果如表6所示。在幼龄林中,竞争指数CIh_s和CIhh_s与所有偏冠指数均呈显著正相关,这两个指数是基于树干位置由参照木和竞争木的树高和距离计算得出的,由此推测,在幼龄林中,林木之间的相对高度差异是造成林木树冠偏冠的主要原因。在中龄林中,所有偏冠指数与所有单木竞争指数均呈显著正相关,且相关系数值较大,说明在中龄林阶段,长白落叶松的树冠偏冠程度受到竞争的强烈影响。在近熟林中,部分偏冠指数与根据参照木和竞争木的胸径和距离计算得出的竞争 CId_s,CId_c,CIdd_s,CIdd_c呈显著正相关,在近熟林中,林木的树冠偏冠程度与竞争木的相对胸径大小相关。在成熟林中,所有偏冠指数与单木竞争指数的相关系数均不显著。在成熟林阶段,林木树冠的偏冠程度与林木在此阶段所受到的竞争压力没有明显相关性。
表 6 偏冠指数与基于树干中心和树冠中心计算的单木竞争指数的相关系数
Table 6. Relationship between crown asymmetric index and competition index
龄组
Age class偏冠指标
Indices单木竞争指数 Single tree competition index CId_s CId_c CIdd_s CIdd_c CIh_s CIh_c CIhh_s CIhh_c 幼龄林
YoungDsc −0.086 −0.132 −0.026 −0.036 0.012 −0.182 0.001 −0.127 CAI1 0.308* 0.297* 0.317* 0.324* 0.320* 0.208 0.343** 0.262* CAI2 0.297* 0.248 0.302* 0.289* 0.367** 0.195 0.365** 0.239 CAI3 0.201 0.139 0.218 0.201 0.278* 0.070 0.276* 0.131 CAI4 0.216 0.177 0.200 0.196 0.338** 0.152 0.298* 0.176 CAI5 0.261 0.223 0.248 0.243 0.362** 0.184 0.328* 0.207 CAI6 0.251 0.203 0.246 0.235 0.319* 0.155 0.314* 0.200 中龄林
Middle-ageDsc −0.048 −0.024 −0.058 −0.058 −0.068 −0.068 −0.044 −0.044 CAI1 0.559*** 0.569*** 0.514** 0.514** 0.494** 0.494** 0.570*** 0.570*** CAI2 0.435** 0.457** 0.367* 0.367* 0.394* 0.394* 0.411* 0.411* CAI3 0.489** 0.511** 0.460** 0.460** 0.351* 0.351* 0.420* 0.420* CAI4 0.543*** 0.560*** 0.511** 0.511** 0.433** 0.433** 0.500** 0.500** CAI5 0.546*** 0.561*** 0.512** 0.512** 0.432** 0.432** 0.501** 0.501** CAI6 0.512** 0.530** 0.456** 0.456** 0.427* 0.427* 0.472** 0.472** 近熟林
Near-matureDsc 0.041 0.122 0.009 0.137 0.106 −0.008 0.118 0.042 CAI1 0.317 0.304 0.264 0.296 0.331 0.191 0.319 0.221 CAI2 0.453* 0.492* 0.436* 0.494* 0.358 0.303 0.400 0.370 CAI3 0.356 0.389 0.340 0.401 0.279 0.207 0.311 0.266 CAI4 0.447* 0.416* 0.439* 0.441* 0.363 0.209 0.409* 0.279 CAI5 0.455* 0.448* 0.459* 0.474* 0.346 0.237 0.396 0.309 CAI6 0.400 0.451* 0.374 0.459* 0.364 0.263 0.396 0.333 成熟林
MatureDsc −0.132 −0.154 −0.172 −0.192 −0.081 −0.100 −0.087 −0.111 CAI1 −0.161 −0.184 −0.234 −0.249 −0.143 −0.164 −0.178 −0.200 CAI2 −0.088 −0.115 −0.136 −0.159 −0.069 −0.089 −0.078 −0.102 CAI3 −0.076 −0.120 −0.140 −0.173 −0.030 −0.071 −0.040 −0.076 CAI4 −0.102 −0.128 −0.166 −0.185 −0.101 −0.122 −0.122 −0.145 CAI5 −0.122 −0.142 −0.176 −0.192 −0.122 −0.137 −0.137 −0.157 CAI6 −0.097 −0.118 −0.138 −0.156 −0.080 −0.095 −0.084 −0.104 注:Dsc为偏冠距离;CAI1-CAI6为偏冠指数。
Note: Dsc is the distance of crown displacement and CAI1-CAI6 is the crown asymmetric index. -
为研究树冠偏冠对林分平均竞争压力的影响,对比了基于树干坐标和基于树冠中心坐标计算的单木竞争指数的林分平均竞争指数和林分总竞争指数的大小差异。由表7可知,在所有样地中,基于树冠中心坐标计算的林分平均竞争指数和总竞争指数均小于基于树干坐标计算的竞争指数,说明林木的树冠偏冠在一定程度上减小了林分中单木的竞争压力和林分总的竞争压力。
表 7 基于树干坐标和树冠中心坐标计算的单木竞争指数大小对比
Table 7. Comparison of competition index based on stem center and crown center
龄组
Age class统计值
Statistics单木竞争指数 Single tree competition index CId_s CId_c CIdd_s CIdd_c CIh_s CIh_c CIhh_s CIhh_c 幼龄林 Young 平均值 Mean 2.18 2.00 3.37 3.11 2.00 1.83 2.15 1.97 总和 Total 128.76 118.09 198.71 183.34 117.84 107.72 123.91 116.04 中龄林 Middle-age 平均值 Mean 1.56 1.48 2.15 2.01 1.42 1.34 1.45 1.37 总和 Total 54.77 51.63 75.16 70.42 49.80 46.76 50.84 47.81 近熟林 Near-mature 平均值 Mean 1.17 1.08 1.31 1.22 1.13 1.06 1.13 1.06 总和 Total 28.00 26.0 31.55 29.36 27.17 25.35 27.24 25.33 成熟林 Mature 平均值 Mean 1.83 1.62 4.47 3.88 1.72 1.52 3.71 3.22 总和 Total 43.98 38.98 107.29 93.18 41.18 36.53 89.13 77.34 注:Mean表示林分平均竞争指数;Total表示样地总竞争指数。
Note: Dsc is the distance of crown displacement and CAI1-CAI6 is the crown asymmetric index.表8给出了基于树冠中心坐标计算的林分平均竞争指数相对于基于树干坐标计算值的降低幅度,可以看出,树冠偏冠使幼龄林林分平均竞争指数降低了7%~9%,中龄林林分平均竞争指数降低了5%~6%,近熟林林分平均竞争指数降低了6%~8%,成熟林林分平均竞争指数降低了11%~13%。
表 8 基于树冠中心坐标计算的林分平均竞争指数相对于基于树干坐标计算值的降低幅度
Table 8. The reduction of forest mean competitive index based on the crown central coordinates relative to the calculated values based on the stem coordinates
龄组
Age class$ \dfrac{{CId}_{\mathrm{s}}-CId\_\mathrm{c}}{CId\_\mathrm{s}} $ $ \dfrac{{CIdd}_{\mathrm{s}}-CIdd\_\mathrm{c}}{CIdd\_\mathrm{s}} $ $ \dfrac{{CIh}_{\mathrm{s}}-CIh\_\mathrm{c}}{CIh\_\mathrm{s}} $ $ \dfrac{{CIhh}_{\mathrm{s}}-CIhh\_\mathrm{c}}{CIhh\_\mathrm{s}} $ 幼龄林 Young 8.3% 7.7% 8.5% 8.4% 中龄林 Middle-age 5.1% 6.5% 5.6% 5.5% 近熟林 Near-mature 7.7% 6.9% 6.2% 6.2% 成熟林 Mature 11.5% 13.2% 11.6% 13.2% -
树冠偏冠的方向受到微地形、太阳辐射方向、当地主要风向和邻近竞争的影响[20-22]。Skatter 和 Kucera通过对生长在空旷地区北方针叶树的系统研究发现,北半球的针叶树一般在树冠南侧具有更多的生物量分布和更长的树冠半径[23],Gao 等[24]对中国东北地区红松林的研究也得出了同样的结论。本研究通过对长白落叶松树冠偏冠方向进行均匀性检验,结果表明在不同发育阶段的林分中,长白落叶松的偏冠方向均分布均匀,没有特定的方向偏移。为了最大限度地获取光资源以进行光合作用,树木分枝会偏向于有空隙的方向,这取决于林木与邻近木的空间分布情况。在不同的邻近竞争强度下,林木通常会表现出不规则的树冠形状,与邻近竞争相关的树冠可塑性是林木在拥挤环境中生存的重要能力[8]。
Getzin 和 Wiegand研究表明,在北半球,树冠偏移呈现随机模式,树木生长没有偏向于太阳辐射方向,因此,树冠的不对称可能是由于邻近竞争造成的[25]。有学者认为,来自最近邻木的竞争是造成树冠偏冠的最主要因素,林木树冠形状与最近邻木竞争之间的关系会因树种不同而有差异[3]。除了竞争之外,非生物因素如坡度、风向也会对树冠偏冠造成影响,在本研究中,研究区的地形较为平缓,坡度为8°左右,因此坡度对树冠形态的影响不大,林木偏冠的方向没有与常年风向呈现一定的规律,因此认为,风向对本研究中的林木树冠偏冠影响不大。
相邻林木之间对于生长空间和光线的竞争是塑造树冠结构的重要因素之一[26-28]。通过对树冠偏冠指数和单木竞争指数进行相关性分析发现,总体而言,树冠偏冠程度与其所受到的竞争强度呈正相关关系。
树木可以根据所处环境调整其冠形,以最大限度地获得资源[29]。林木树冠的改变通常与其积累生物量的能力呈正相关,并且会影响林木分化[30]。调整不对称的树冠可能有助于进一步研究林木分化。但是,树冠形状也可能受到地形、坡道、当地风向的影响。许多分析树冠不对称与邻近竞争之间关系的研究表明,树冠通常在远离邻近树木主要竞争压力的那侧更为发达。此外,林木树冠冠形的不规则已被证明可提高林分尺度上的空间利用率[4,9,14]。
树冠的不规则冠形减少了相邻木之间树冠之间的重叠,同时减少了林分中没有树冠占据的生长空间,这两个过程减少了树冠重叠,并且减少了林木之间的竞争强度和整个林分的竞争压力,本研究发现,在不同林分发育阶段的样地中,基于树冠中心计算的单木竞争指数和林分总竞争指数均小于基于树干中心计算的单木竞争指数和林分总竞争指数。树冠偏冠会对树冠垂直投影面积的计算精度产生影响。
-
在单木水平上,不同林龄样地中林木的树冠变异系数的平均值均大于20%。幼龄林和成熟林中林木的树冠半径变异系数的最小值在5.8%,而中龄林和近熟林中的最小值则在13%以上,其中近熟林中林木的树冠半径变异系数最小值达到了16%。大部分林木的树冠半径变异系数分布在15%以上,只有不到1/5的林木的树冠半径变异系数小于15%。
不同林龄样地中长白落叶松偏冠距离的平均值在0.35~0.51 m之间,其中近熟林中林木的平均偏冠距离最大,幼龄林中林木的平均偏冠距离最小,各样地中林木偏冠距离的最大值均在1.2 m以上,其中成熟林中林木偏冠距离的最大值达到1.73 m。幼龄林、中龄林、近熟林、成熟林样地中的树冠偏冠方向经过瑞利均匀性检验验证,表明树冠的偏冠方向没有特定的方向偏向,是均匀分布的。
在幼龄林中,林木的偏冠距离与胸径、冠长、平均树冠半径呈显著正相关,树冠偏冠距离随树木增大而增大。在中龄林和近熟林中,偏冠指数与胸径、树高和平均树冠半径呈显著负相关,与高径比呈显著正相关,树冠偏冠程度随树木增大而减小。在成熟林中,偏冠程度与林木大小的相关性不显著。在幼龄林、中龄林、近熟林中,树冠偏冠与竞争压力呈显著正相关,在成熟林中树冠偏冠与竞争压力的相关性不显著。
在不同林龄阶段的样地中,基于树冠中心坐标计算的林分平均竞争指数均小于基于树干坐标计算的林分平均竞争指数,说明树冠偏冠是林木对于竞争压力的响应,林木通过树冠偏冠获取更多的光资源并减少了自身的竞争压力。
长白落叶松树冠半径分布特征及其对竞争的响应
The Distribution Characteristics of Crown Radius and Its Response to Competition of Larix olgensis
-
摘要:
目的 研究林木树冠形态对外界环境适应的可塑性机理。 方法 以小兴安岭地区的长白落叶松为研究对象,利用详细的树冠半径调查数据,研究长白落叶松的树冠偏冠现象,分析树冠偏冠与林木大小和竞争之间的关系。 结果 在单木水平上,不同林龄样地中林木的树冠变异系数的平均值均大于20%,大部分林木的树冠半径变异系数较大,只有不到1/5的林木的树冠半径变异系数小于15%。不同林龄样地中长白落叶松偏冠距离的平均值在0.35~0.51 m之间,各样地中林木偏冠距离的最大值均在1.2 m以上,其中成熟林中林木偏冠距离的最大值达到1.73 m。树冠的偏冠方向没有特定的方向偏向,是均匀分布的。在幼龄林中,林木的偏冠距离与胸径、冠长、平均树冠半径呈显著正相关,树冠偏冠距离随树木增大而增大。在中龄林和近熟林中,偏冠指数与胸径、树高和平均树冠半径呈显著负相关,与高径比呈显著正相关,树冠偏冠程度随树木增大而减小。在成熟林中,偏冠程度与林木大小的相关性不显著。在幼龄林、中龄林、近熟林中,树冠偏冠与竞争压力呈显著正相关,在成熟林中树冠偏冠与竞争压力的相关性不显著。基于树冠中心坐标计算的林分平均竞争指数均小于基于树干坐标计算的林分平均竞争指数。 结论 长白落叶松树冠偏冠距离一般随着林龄的增大而变大,在不同发育阶段受到不同程度竞争的影响,树冠偏冠在一定程度上降低了林分平均竞争指数,减少了林分竞争压力。 Abstract:Objective To study the plasticity mechanism of tree crown morphology adapting to the external environment. Method Taking Larix olgensis in Xiaoxing'anling Mountain as the research object, using detailed crown radius survey data, the phenomenon of crown displacement of L. olgensis was studied, and the relationship between crown displacement and tree size and competition was analyzed. Result At the level of individual tree, the average value of the crown radius variation coefficient of trees in sample plots with different ages was larger than 20%, and the crown radius variation coefficient of less than 1/5 trees was less than 15%. The average value of crown displacement distance of L. olgensis was between 0.35~0.51 m in the plots with different ages. The maximum value of crown displacement distance of trees in all plots was more than 1.2 m, and the maximum value of crown displacement distance of trees in mature forest was 1.73 m. No specific direction deviation was observed in the direction of crown deviation, which was evenly distributed. In the young forest, the crown displacement distance was significantly and positively correlated with DBH, crown length and average crown radius, and the crown displacement distance increased with the increase of trees. In the middle-aged forest and near mature forest, the crown displacement index was negatively correlated with DBH, tree height and average crown radius, and positively correlated with height diameter ratio. In mature forest, the correlation between crown displacement and tree size was not significant. In young forest, middle-aged forest and near mature forest, there was a significant positive-correlation between crown displacement and competitive pressure, but there was no significant correlation between crown displacement and competition index in mature forest. The average competition index calculated based on crown center coordinate was less than that calculated based on stem coordinate. Conclusion The crown deviation distance of L. olgensis generally increases with the increase of forest age, and is affected by different degrees of competition at different development stages. The crown displacement will reduce the average competition index and the competition pressure of the stand to a certain extent. -
Key words:
- crown radius
- / crown displacement index
- / competition
- / crown projection area
- / Larix olgensis
-
图 1 不同方向树冠半径的箱线
Figure 1. Box-plot of the radius of the canopy in different directions
图 2 单木水平不同方向树冠半径的大小分布
Figure 2. Distribution of crown radius in different directions of the single-tree
图 3 树冠半径变异系数的频率分布
Figure 3. The frequency distribution of the crown radius coefficient variation
图 4 不同林龄样地长白落叶松的偏冠距离与偏冠角度的极坐标
Figure 4. Polar coordinates of crown displacement distance and angle of Larix olgensis of different plots
表 1 长白落叶松树冠半径在不同方向的统计值(平均值±标准差)
Table 1. Statistical values for the distance of crown displacement in different plot
龄组
Age class胸径/cm
DBH树高/m
Height树冠半径/m N NE E SE S SW W NW 幼龄 (13 a) 13.87 (±4.14) 10.44 (±1.47) 1.61 (±0.53) 1.64 (±0.64) 1.60 (±0.64) 1.59 (±0.59) 1.60 (±0.51) 1.62 (±0.51) 1.62 (±0.58) 1.63 (±0.56) 中龄 (27 a) 18.83 (±4.84) 19.42 (±1.35) 1.63 (±0.86) 1.71 (±0.78) 1.70 (±0.75) 1.80 (±0.80) 1.80 (±0.78) 1.82 (±0.81) 1.60 (±0.70) 1.61 (±0.71) 近熟 (34 a) 22.93 (±5.00) 20.49 (±0.67) 1.79 (±0.84) 1.79 (±0.81) 1.78 (±0.80) 1.85 (±0.72) 1.77 (±0.75) 1.80 (±0.82) 1.71 (±0.82) 1.66 (±0.76) 成熟 (54 a) 26.88 (±7.28) 22.25 (±5.03) 2.63 (±1.40) 2.49 (±1.18) 2.17 (±0.92) 2.51 (±1.17) 2.34 (±0.86) 2.63 (±1.19) 2.27 (±1.03) 2.41 (±1.14)  下载: 导出CSV
表 2 长白落叶松单木不同方向树冠半径的变异系数
Table 2. Coefficientvariation for the crownradius in different directioninsingle-treelevel %
龄组
Age class平均值
Mean最小值
Min最大值
Max标准差
SD幼龄林 Young 23.1 7.1 48.6 9.9 中龄林 Middle age 28.4 13.1 55.0 11.6 近熟林 Near-mature 26.8 16.0 62.1 10.3 成熟林 Mature 28.8 5.8 65.0 15.7
下载: 导出CSV
表 3 不同林龄样地中长白落叶松的偏冠距离统计值
Table 3. Statistical values for the distance of crowndisplacement in different plot
龄组
Age class平均值
Mean/m最小值
Min/m最大值
Max/m标准差
SD/m幼龄林 Young 0.35 0.00 1.39 0.24 中龄林 Middle age 0.38 0.04 1.26 0.25 近熟林 Near-mature 0.51 0.11 1.24 0.27 成熟林 Mature 0.45 0.08 1.73 0.33
下载: 导出CSV
表 4 不同林龄样地中长白落叶松的偏冠方向的瑞利均匀性检验
Table 4. Rayleigh test statistics of different plots
龄组
Age classRayleigh test 统计值
Statisticsp值
p value幼龄林 Young 0.040 0.857 中龄林 Middle age 0.144 0.228 近熟林 Near-mature 0.228 0.095 成熟林 Mature 0.156 0.213
下载: 导出CSV
表 5 偏冠程度与单木测树因子的相关系数
Table 5. Relationship between crown asymmetric index and tree measurement factors
龄组
Age class偏冠指标
Indices胸径
DBH树高
H高径比
HDR枝下高
HCB冠长
CL平均树冠半径
Crown radius幼龄林
YoungDsc 0.289** 0.114 −0.220* −0.189 0.258* 0.368*** CAI1 −0.102 −0.140 0.125 −0.147 0.045 −0.115 CAI2 −0.112 −0.108 0.170 −0.069 −0.008 −0.049 CAI3 −0.086 −0.106 0.134 −0.106 0.029 −0.027 CAI4 −0.041 −0.041 0.096 −0.058 0.028 −0.009 CAI5 −0.061 −0.053 0.122 −0.057 0.018 −0.023 CAI6 −0.092 −0.112 0.135 −0.076 −0.003 −0.019 中龄林
Middle-ageDsc 0.081 −0.086 −0.115 −0.161 0.130 0.234 CAI1 −0.306* −0.328* 0.309* −0.147 0.019 −0.283* CAI2 −0.398** −0.304* 0.355** 0.039 −0.163 −0.314* CAI3 −0.380** −0.339* 0.371** 0.070 −0.209 −0.431** CAI4 −0.397** −0.374** 0.396** 0.047 −0.199 −0.361** CAI5 −0.411** −0.371** 0.417** 0.029 −0.179 −0.364** CAI6 −0.377** −0.334* 0.354** −0.013 −0.121 −0.332* 近熟林
Near-matureDsc −0.062 −0.034 0.079 −0.041 0.026 −0.022 CAI1 −0.439** −0.317 0.470** −0.193 0.059 −0.393* CAI2 −0.512** −0.418* 0.528*** −0.060 −0.111 −0.507** CAI3 −0.384* −0.257 0.404* −0.048 −0.057 −0.417* CAI4 −0.554*** −0.473** 0.593*** −0.089 −0.104 −0.546*** CAI5 −0.566*** −0.510** 0.599*** −0.096 −0.113 −0.561*** CAI6 −0.526*** −0.480** 0.544*** −0.152 −0.046 −0.499** 成熟林
MatureDsc 0.073 0.045 −0.158 0.080 −0.078 0.121 CAI1 0.094 0.140 −0.054 0.172 −0.049 −0.174 CAI2 0.035 0.122 0.064 0.231 −0.243 −0.287 CAI3 0.106 0.157 −0.034 0.229 −0.142 −0.269 CAI4 −0.008 0.096 0.085 0.116 −0.027 −0.237 CAI5 0.010 0.127 0.107 0.161 −0.054 −0.269 CAI6 0.038 0.099 0.006 0.192 −0.206 −0.203 注:Dsc为偏冠距离;CAI1-CAI6为偏冠指数
Note: Dsc is the distance of crown displacement and CAI1-CAI6 is the crown asymmetric index.
下载: 导出CSV
表 6 偏冠指数与基于树干中心和树冠中心计算的单木竞争指数的相关系数
Table 6. Relationship between crown asymmetric index and competition index
龄组
Age class偏冠指标
Indices单木竞争指数 Single tree competition index CId_s CId_c CIdd_s CIdd_c CIh_s CIh_c CIhh_s CIhh_c 幼龄林
YoungDsc −0.086 −0.132 −0.026 −0.036 0.012 −0.182 0.001 −0.127 CAI1 0.308* 0.297* 0.317* 0.324* 0.320* 0.208 0.343** 0.262* CAI2 0.297* 0.248 0.302* 0.289* 0.367** 0.195 0.365** 0.239 CAI3 0.201 0.139 0.218 0.201 0.278* 0.070 0.276* 0.131 CAI4 0.216 0.177 0.200 0.196 0.338** 0.152 0.298* 0.176 CAI5 0.261 0.223 0.248 0.243 0.362** 0.184 0.328* 0.207 CAI6 0.251 0.203 0.246 0.235 0.319* 0.155 0.314* 0.200 中龄林
Middle-ageDsc −0.048 −0.024 −0.058 −0.058 −0.068 −0.068 −0.044 −0.044 CAI1 0.559*** 0.569*** 0.514** 0.514** 0.494** 0.494** 0.570*** 0.570*** CAI2 0.435** 0.457** 0.367* 0.367* 0.394* 0.394* 0.411* 0.411* CAI3 0.489** 0.511** 0.460** 0.460** 0.351* 0.351* 0.420* 0.420* CAI4 0.543*** 0.560*** 0.511** 0.511** 0.433** 0.433** 0.500** 0.500** CAI5 0.546*** 0.561*** 0.512** 0.512** 0.432** 0.432** 0.501** 0.501** CAI6 0.512** 0.530** 0.456** 0.456** 0.427* 0.427* 0.472** 0.472** 近熟林
Near-matureDsc 0.041 0.122 0.009 0.137 0.106 −0.008 0.118 0.042 CAI1 0.317 0.304 0.264 0.296 0.331 0.191 0.319 0.221 CAI2 0.453* 0.492* 0.436* 0.494* 0.358 0.303 0.400 0.370 CAI3 0.356 0.389 0.340 0.401 0.279 0.207 0.311 0.266 CAI4 0.447* 0.416* 0.439* 0.441* 0.363 0.209 0.409* 0.279 CAI5 0.455* 0.448* 0.459* 0.474* 0.346 0.237 0.396 0.309 CAI6 0.400 0.451* 0.374 0.459* 0.364 0.263 0.396 0.333 成熟林
MatureDsc −0.132 −0.154 −0.172 −0.192 −0.081 −0.100 −0.087 −0.111 CAI1 −0.161 −0.184 −0.234 −0.249 −0.143 −0.164 −0.178 −0.200 CAI2 −0.088 −0.115 −0.136 −0.159 −0.069 −0.089 −0.078 −0.102 CAI3 −0.076 −0.120 −0.140 −0.173 −0.030 −0.071 −0.040 −0.076 CAI4 −0.102 −0.128 −0.166 −0.185 −0.101 −0.122 −0.122 −0.145 CAI5 −0.122 −0.142 −0.176 −0.192 −0.122 −0.137 −0.137 −0.157 CAI6 −0.097 −0.118 −0.138 −0.156 −0.080 −0.095 −0.084 −0.104 注:Dsc为偏冠距离;CAI1-CAI6为偏冠指数。
Note: Dsc is the distance of crown displacement and CAI1-CAI6 is the crown asymmetric index.
下载: 导出CSV
表 7 基于树干坐标和树冠中心坐标计算的单木竞争指数大小对比
Table 7. Comparison of competition index based on stem center and crown center
龄组
Age class统计值
Statistics单木竞争指数 Single tree competition index CId_s CId_c CIdd_s CIdd_c CIh_s CIh_c CIhh_s CIhh_c 幼龄林 Young 平均值 Mean 2.18 2.00 3.37 3.11 2.00 1.83 2.15 1.97 总和 Total 128.76 118.09 198.71 183.34 117.84 107.72 123.91 116.04 中龄林 Middle-age 平均值 Mean 1.56 1.48 2.15 2.01 1.42 1.34 1.45 1.37 总和 Total 54.77 51.63 75.16 70.42 49.80 46.76 50.84 47.81 近熟林 Near-mature 平均值 Mean 1.17 1.08 1.31 1.22 1.13 1.06 1.13 1.06 总和 Total 28.00 26.0 31.55 29.36 27.17 25.35 27.24 25.33 成熟林 Mature 平均值 Mean 1.83 1.62 4.47 3.88 1.72 1.52 3.71 3.22 总和 Total 43.98 38.98 107.29 93.18 41.18 36.53 89.13 77.34 注:Mean表示林分平均竞争指数;Total表示样地总竞争指数。
Note: Dsc is the distance of crown displacement and CAI1-CAI6 is the crown asymmetric index.
下载: 导出CSV
表 8 基于树冠中心坐标计算的林分平均竞争指数相对于基于树干坐标计算值的降低幅度
Table 8. The reduction of forest mean competitive index based on the crown central coordinates relative to the calculated values based on the stem coordinates
龄组
Age class$ \dfrac{{CId}_{\mathrm{s}}-CId\_\mathrm{c}}{CId\_\mathrm{s}} $ $ \dfrac{{CIdd}_{\mathrm{s}}-CIdd\_\mathrm{c}}{CIdd\_\mathrm{s}} $ $ \dfrac{{CIh}_{\mathrm{s}}-CIh\_\mathrm{c}}{CIh\_\mathrm{s}} $ $ \dfrac{{CIhh}_{\mathrm{s}}-CIhh\_\mathrm{c}}{CIhh\_\mathrm{s}} $ 幼龄林 Young 8.3% 7.7% 8.5% 8.4% 中龄林 Middle-age 5.1% 6.5% 5.6% 5.5% 近熟林 Near-mature 7.7% 6.9% 6.2% 6.2% 成熟林 Mature 11.5% 13.2% 11.6% 13.2%
下载: 导出CSV
-
[1] Sultan S E. Phenotypic plasticity for plant development, function and life history[J]. Trends in Plant Science, 2000, 5(12): 537-542. doi: 10.1016/S1360-1385(00)01797-0 [2] 何亚平, 费世民, 徐 嘉, 等. 川西南山地云南松林窗边界木偏冠现象与影响因素[J]. 北京林业大学学报, 2007, 29(6):66-71. [3] Fleck S, Mölder I, Jacob M, et al. Comparison of conventional eight-point crown projections with LIDAR-based virtual crown projections in a temperate old-growth forest[J]. Annals of Forest Science., 2011, 68(7): 1173-1185. doi: 10.1007/s13595-011-0067-1 [4] Pretzsch H, Schütze G. Crown allometry and growing space efficiency of Norway spruce (Picea abies Karst. ) and European beech (Fagus sylvatica L. ) in pure and mixed stands[J]. Plant Biology, 2005, 7(6): 628-639. doi: 10.1055/s-2005-865965 [5] Purves D W, Lichstein J W, Pacala S W. Crown plasticity and competition for canopy space: a new spatially implicit model parameterized for 250 North American tree species[J]. Plos One, 2007, 2(9): 1-11. [6] Seidel D, Leuschner C, Müller A, et al. Crown plasticity in mixed forests—Quantifying asymmetry as a measure of competition using terrestrial laser scanning[J]. Forest Ecology and Management, 2011, 261(11): 2123-2132. doi: 10.1016/j.foreco.2011.03.008 [7] Vincent G, Harja D. Exploring ecological significance of tree crown plasticity through three-dimensional modelling[J]. Annals of Botany, 2007, 101(8): 1221-1231. doi: 10.1093/aob/mcm189 [8] Longuetaud F, Piboule A, Wernsdörfer H, et al. Crown plasticity reduces inter-tree competition in a mixed broadleaved forest[J]. European Journal of Forest Research, 2013, 132(4): 621-634. doi: 10.1007/s10342-013-0699-9 [9] Schröter M, Härdtle W, Oheimb G v. Crown plasticity and neighborhood interactions of European beech (Fagus sylvatica L. ) in an old-growth forest[J]. European Journal of Forest Research, 2012, 131(3): 787-798. doi: 10.1007/s10342-011-0552-y [10] Brisson J. Neighborhood competition and crown asymmetry in Acer saccharum[J]. Canadian Journal of Forest Research, 2001, 31(12): 2151-2159. doi: 10.1139/x01-161 [11] Longuetaud F, Seifert T, Leban J-M, et al. Analysis of long-term dynamics of crowns of sessile oaks at the stand level by means of spatial statistics[J]. Forest Ecology and Management, 2008, 255(5): 2007-2019. [12] 孔繁琳. 桉树(Eucalyptus pilularis)人工林树冠偏冠指数的研究[D]. 哈尔滨: 东北林业大学. 2020. [13] Assmann E, Davis P W. The Principles of Forest Yield Study[M]. Oxford, Pergamon Press Ltd. 1970. [14] Umeki K. Importance of crown position and morphological plasticity in competitive interaction in a population of Xanthium canadense[J]. Annals of Botany, 1995, b,75(3): 259-265. [15] Jucker T, Bouriaud O, Coomes D A. Crown plasticity enables trees to optimize canopy packing in mixed-species forests[J]. Functional Ecology, 2015, 29: 1078-1086. doi: 10.1111/1365-2435.12428 [16] Poorter H, Niklas K J, Reich P B, et al. Biomass allocation to leaves, stems and roots: meta‐analyses of interspecific variation and environmental control[J]. New Phytologist, 2012, 193(1): 30-50. doi: 10.1111/j.1469-8137.2011.03952.x [17] Holmes M J, Reed D D. Competition indices for mixed species northern hardwoods[J]. Forest Science, 1991, 37(5): 1338-1349. [18] 汤孟平. 森林空间结构分析[M]. 北京: 科学出版社: 2013. [19] 徐 晖, 彭长华, 王昌富. 医学研究论文中变异系数假设检验的应用错误辨析[J]. 临床和实验医学杂志, 2013, 12(7):557-558. doi: 10.3969/j.issn.1671-4695.2013.07.034 [20] Gao H, Chen D, Sun X, et al. Modelling the responses of crown profiles to competition in terms of different tree classes and directions in two coniferous tree species in northeastern China[J]. European Journal of Forest Research, 2021, 140(1): 159-174. doi: 10.1007/s10342-020-01321-4 [21] Han A R, Lee S K, Suh G U, et al. Wind and topography influence the crown growth of Picea jezoensis in a subalpine forest on Mt. Deogyu, Korea[J]. Agricultural and Forest Meteorology, 2012, 166: 207-214. [22] Uria-Diez J, Pommerening A. Crown plasticity in Scots pine (Pinus sylvestris L. ) as a strategy of adaptation to competition and environmental factors[J]. Ecological Modelling, 2017, 356: 117-126. doi: 10.1016/j.ecolmodel.2017.03.018 [23] Skatter S, Kucera B. The cause of the prevalent directions of the spiral grain patterns in conifers[J]. Trees-Structure and Function, 1998, 12(5): 265-273. doi: 10.1007/s004680050150 [24] Gao H, Dong L, Li F. Modeling variation in crown profile with tree status and cardinal directions for planted Larix olgensis Henry trees in Northeast China[J]. Forests, 2017, 8(5): 139. doi: 10.3390/f8050139 [25] Getzin S, Wiegand K. Asymmetric tree growth at the stand level: Random crown patterns and the response to slope[J]. Forest Ecology and Management, 2007, 242(2): 165-174. [26] Canham C D, LePage P T, Coates K D. A neighborhood analysis of canopy tree competition: effects of shading versus crowding[J]. Canadian Journal of Forest Research, 2004, 34(4): 778-787. doi: 10.1139/x03-232 [27] Harja D, Vincent G, Mulia R, et al. Tree shape plasticity in relation to crown exposure[J]. Trees-Structure and Function, 2012, 26(4): 1275-1285. doi: 10.1007/s00468-012-0703-x [28] Muth C C, Bazzaz F A. Tree canopy displacement and neighborhood interactions[J]. Canadian Journal of Forest Research, 2003, 33(7): 1323-1330. doi: 10.1139/x03-045 [29] Trouvé R, Bontemps J D, Seynave I, et al. Stand density, tree social status and water stress influence allocation in height and diameter growth of Quercus petraea (Liebl. )[J]. Tree Physiology, 2015, 35(10): 1035-1046. doi: 10.1093/treephys/tpv067 [30] Waring R H, Thies W G, Muscato D. Stem growth per unit of leaf area: A measure of tree vigor[J]. Forest Science, 1980, 26(1): 112-117. -

 点击查看大图
计量
- 文章访问数: 3628
- HTML全文浏览量: 2448
- PDF下载量: 57
- 被引次数: 0


