2017 Vol. 30, No. 4
column
Display Method:
2017, 30(4): 533-541.
doi: 10.13275/j.cnki.lykxyj.2017.04.001
 [Abstract]
 [FullText HTML]
 [PDF 2959KB]
Abstract:
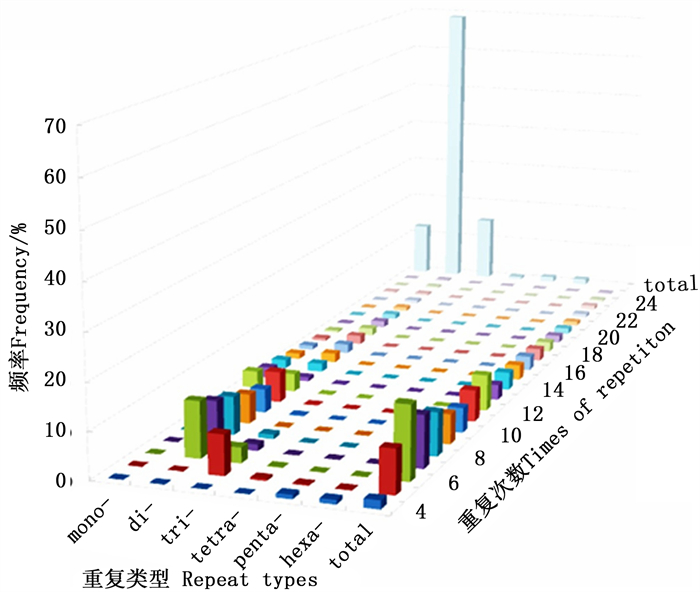
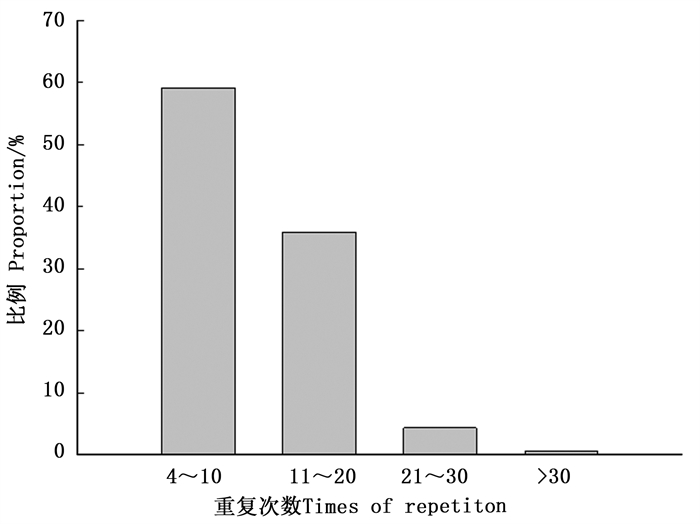
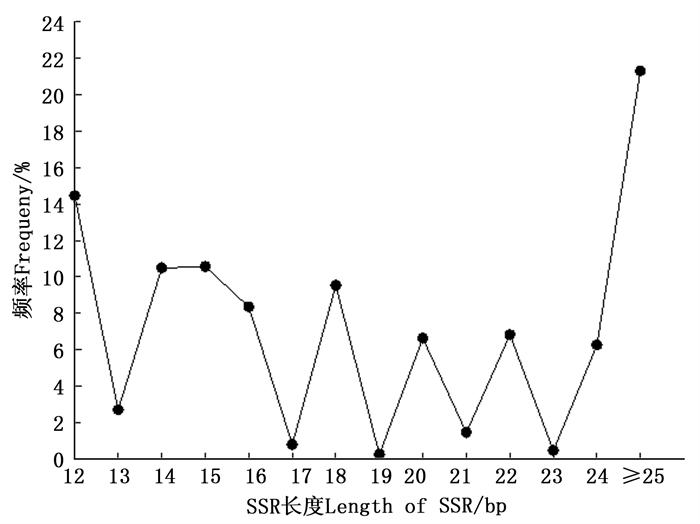
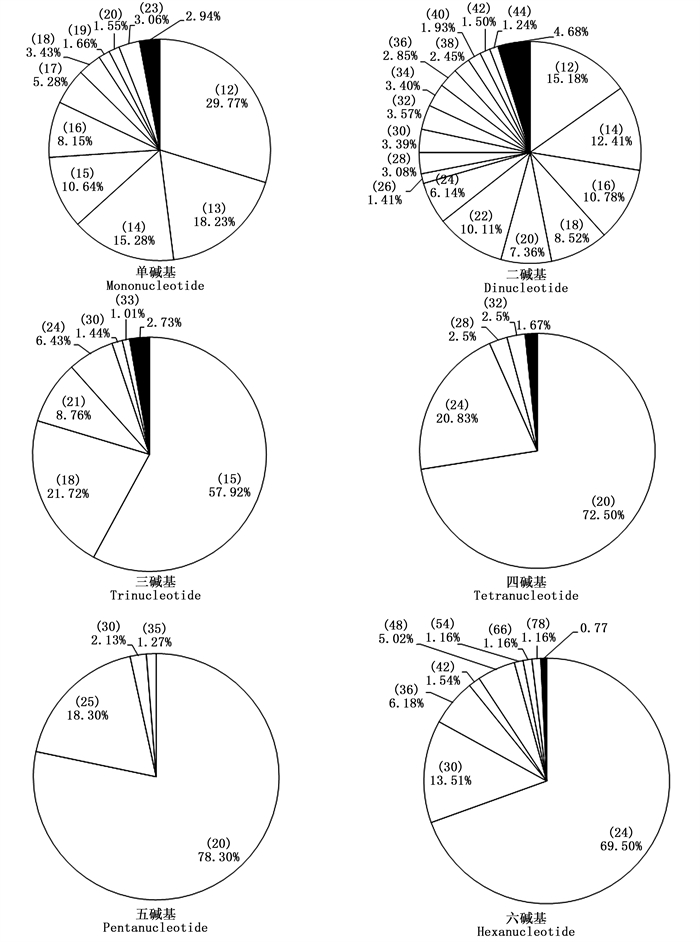
Objective To comprehensively understand the distribution and sequence characteristics of SSR loci in the Rhododendron longipedicellatum transcriptome, and to provide a theoretical basis for further development of high efficient SSR markers. Method Transcriptome sequencing was conducted on young leaves of R. longipedicellatum by using Illumina Hiseq 4000. Then the SSR loci were sought and analyzed using MISA software from the obtained unigenes. Result A total of 23, 192 SSRs were identified in 17, 354 unigenes, with an average density of one SSR per 3 kb. Dinucleotide and trinucleotide repeat were the main SSR types, accounting for 69.25% and 15.07% of all SSRs, respectively. Among all the 187 repeat motifs, (AG/CT)n was the most frequent repeat motif (62.01%), followed by (A/T)n (12.34%), (AC/GT)n (4.52%) and (AAG/CTT)n (4.23%). A total of 15, 908 SSRs occurred in the intersection of SSR and CDS, only 2792 of which occurred in protein-coding regions of these sequences. The density of SSRs was 0.076 SSR/kb in coding regions which was significantly lower than that in non-coding regions (0.344 SSR/kb). Moreover, trinucleotide repeat was the most abundant in coding regions (1356, 48.57%). In terms of different length repeat units, the variation of the length of dinucleotide repeat SSR was the most abundant, followed by the mononucleotide. There was a significant negative correlation (P < 0.01) between the frequency of SSR and the length, with the correlation coefficient of -0.566. Conclusion The SSR loci in the R. longipedicellatum transcriptome showed high frequency and density of distribution, rich repeat motifs, high repeat times, more long fragment and significant potential of polymorphism. The SSR loci could be applied in genetic analysis and conservation genetics of R. longipedicellatum in the future.

2017, 30(4): 542-550.
doi: 10.13275/j.cnki.lykxyj.2017.04.002
Abstract:
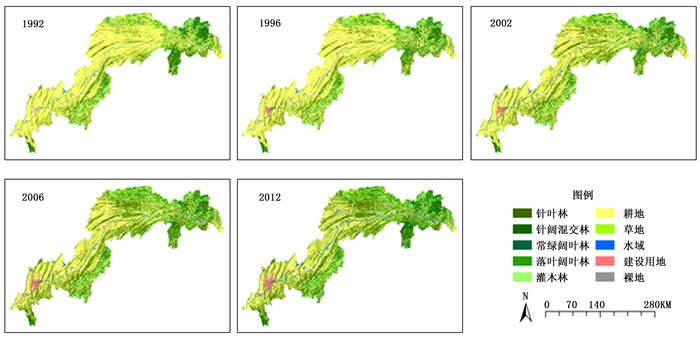
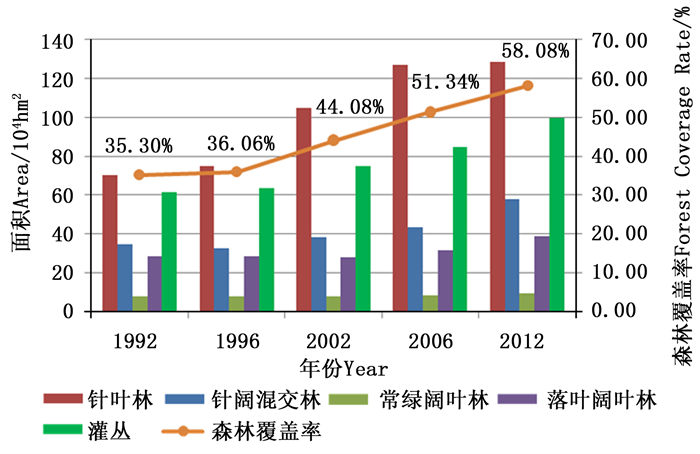
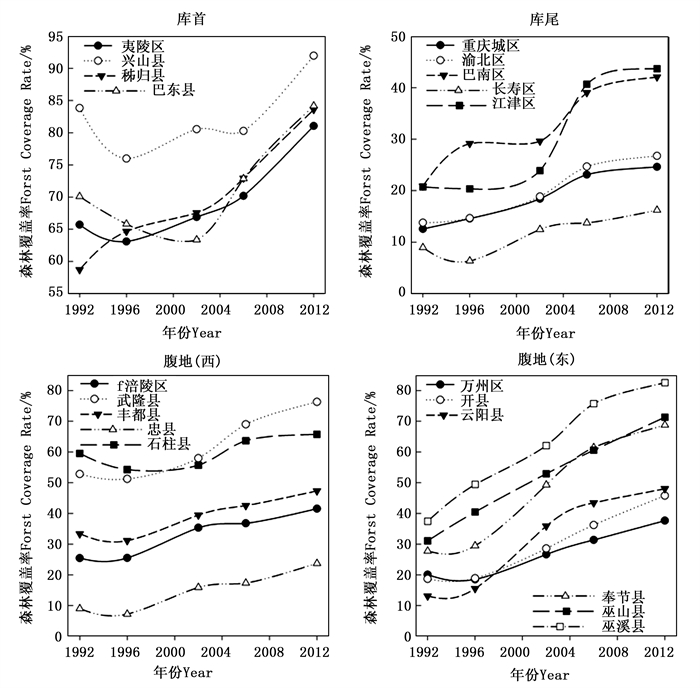
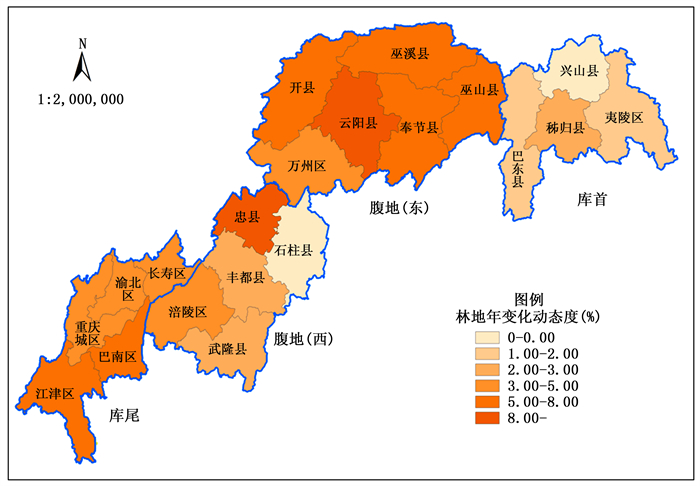
Objective An analysis on the forest landscape pattern evolution in the Three Gorges Reservoir (TGR) area during 1992—2012 will contribute to forest landscape restoration, sustainable utilization of forest resources and landscape pattern optimization. Method Five time-series remote sensing images were selected to discover the changes of forest landscape in the TGR area. Two indexes (graduation statistics and landscape metrics) were included for this analysis. Result Cropland and forest were the dominant landscapes during 1992—2012, although cropland area reduced drastically, while forest area and forest coverage rate increased gradually. The structure of forest landscape was relatively stable. The forest was unevenly distributed with most concentrated in the east and center parts. In the past 20 years, the forest area increased rapidly in the central part, while kept steady in the east and west parts. The distribution of patch area shows obvious polarization, which means small fragmented patches were in large quantity while the large patches with areas above 100 hectares were in small quantity. But the polarization was obviously relieved in the past 20 years, the scattered forest patches were significantly reduced, the continuous patches were increased both in quantity and area. During the past 20 years, the mean patch size of forest landscape increased by 54%, while the largest patch index increased by 134%, and the mean proximity index increased by 302%. The landscape dominance of coniferous forest increased significantly. Conclusion With forest restoration, the fragmented patches were gradually connecting, the ecological condition was improved. However, the landscape pattern is spatially uneven distributed. The forest coverage rate is high in the east of the TGR area, but with poor landscape diversity dominated by Pinus massoniana. The forest coverage needs to be improved in the west of the TGR area and the zone along Yangtze River.
2017, 30(4): 551-558.
doi: 10.13275/j.cnki.lykxyj.2017.04.003
Abstract:
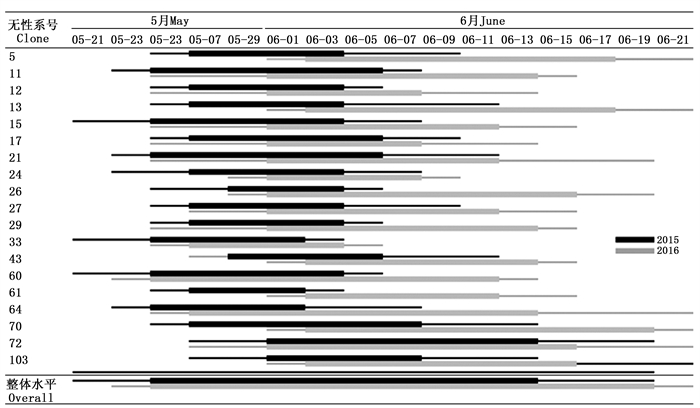
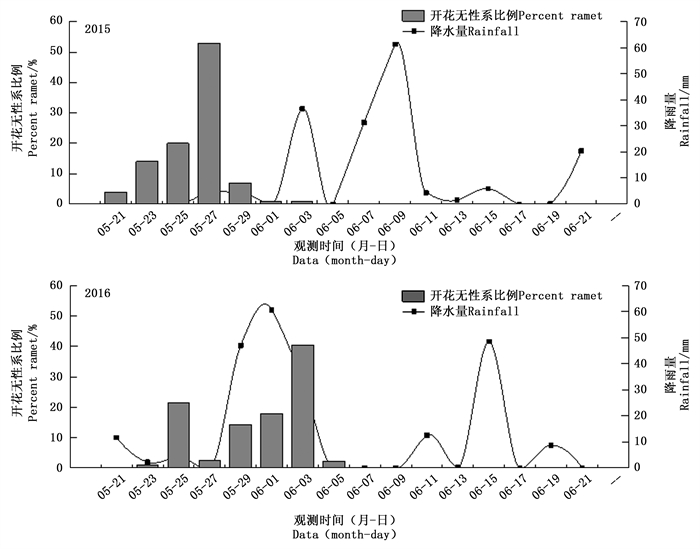
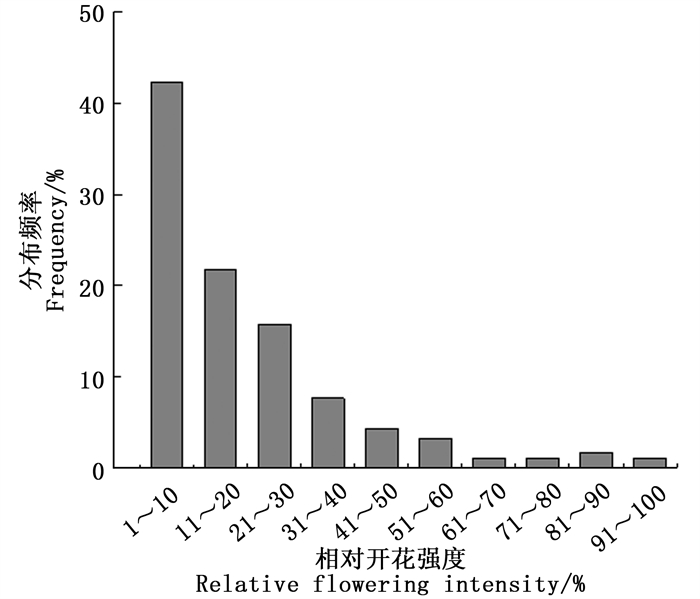
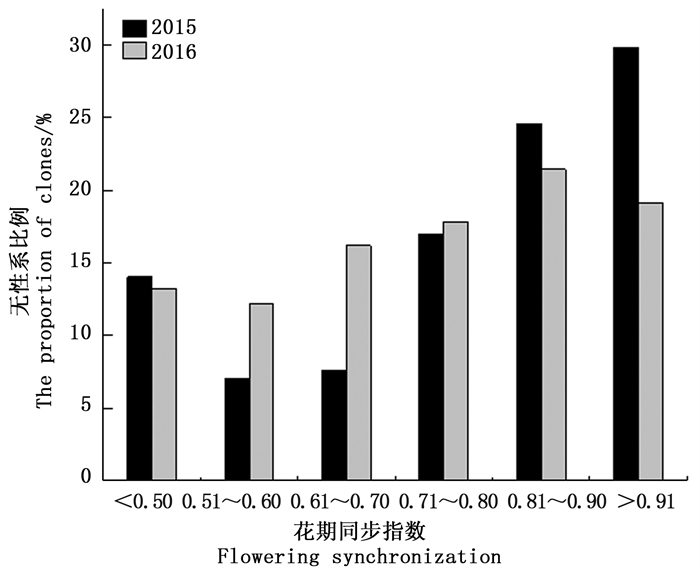
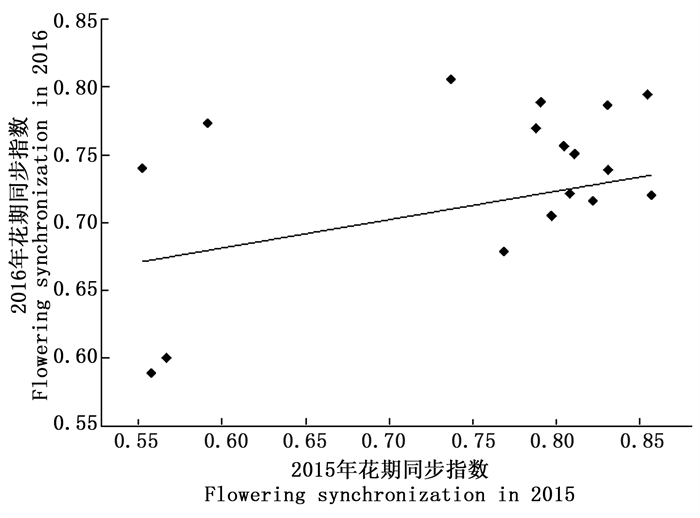
Objective Studying the characteristic of flowering phenology and the variation and stability of flowering synchronization of clones. Method Based on data of florescence period and flower number of 19 clones in a seed orchard of Schima superba which entered the stages of normal flowering and seed setting in 2015 and 2016, the flowering phenology and synchronization of each clone were estimated. Result The flowering of clones lasted for 10 to 28 days, and the first flowering date in 2016 was 2 days later than 2015. The correlation analysis showed that the clones with more flowers had a longer flowering duration and more fruit set than the clones with fewer flowers, and the longer the flowering duration, the more the fruit set. There were obvious difference of flowering synchronization among parent clone combinations. The index of flowering synchronization ranged from 0.552 to 0.857 and from 0.406 to 0.808, with an average of 0.758 and 0.713 in 2015 and 2016, respectively. More than 50% clones had a flowering synchronization (C) which greater than 0.8 in 2015, and more than 40% clones had a C value which greater than 0.8 in 2016. The coefficient of variation (CV) of C value ranged from 12.016% to 46.476% and 15.375%-51.202%, respectively, during the year. The analysis of variance (ANOVA) showed that there was a significant variance of C value among clones during the year at 0.01 level. The average of C value among years was 0.737, and ANOVA analysis showed that there was no significant variance of C value among years at 0.05 level. The coefficient of correlation between 2015 and 2016 was 0.229, indicating that there was a correlation of C value among years, but it was not significant. Conclusion The C value among years is stable in the seed orchard. We could screen and optimize the clones in seed orchard based on the flowering phenology and synchronization, and combined with hand-pollination to decrease the difference of flowering synchronization among clones, that will improve the yield and quality of seed in S. superba seed orchard.
2017, 30(4): 559-565.
doi: 10.13275/j.cnki.lykxyj.2017.04.004
Abstract:
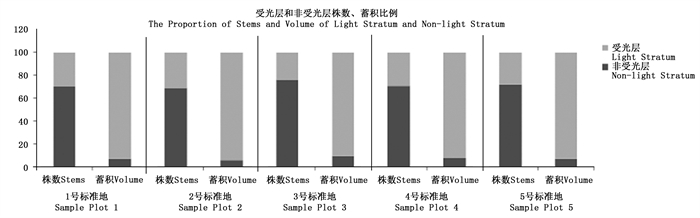
Objective To investigate the key stand-description factors in strata (including the whole stand and each stratum) of typical natural broadleaved forest in mid-subtropics. Method The mean DBH, mean H, standard deviation (SD), and coefficient of variation (CV) in each stratum were used to calculate, and the proportion of stems and volumes in each stratum were also analyzed. The mean height (Hs) and the median height (Hz) of stratum were used to replace the individual height (H) to estimate the volume, and the variance analysis and relative error were implemented to test the feasibility. Result The results suggested that the CV of whole stand was bigger than stratumⅠ, Ⅱ, and Ⅲ, the CV of each stratum increased with the height of stratum decrease, the CV of stratumⅠ and Ⅱ were coincident approximately and smaller than the CV of stratum Ⅲ. The stem proportion of stratumⅠ and Ⅱ was between 20% and 30%, but the volume proportion more than 90%. The result of the relative error suggested that the errors of the whole stand, stratumⅠ and stratumⅡ were less than 5%, and the error of stratum Ⅲ was less than 10% in each sample plot, corresponding to the accuracy of productive practice in general. The results of variance analysis showed that the value of stand volume (p) calculated in the three methods all bigger than 0.05. Conclusion At the typical natural broadleaved forest in mid-subtropics, the volume of light receiving stratum (including stratumⅠand stratumⅡ) is absolutely superior so it is the key point in the field investigation. The relative error among these methods in mean height (Hs) and the median height (Hz) of stratum and the individual height (H) conform to the accuracy requirement in the practices. The result of variance analysis also showed that there is no statistically significant difference in stand volumes calculated by the three methods, which means that the mean height and the median height of stratum could be used to replace the individual height to estimate the volume in typical natural broadleaved forest in mid-subtropics and meet the accuracy requirement and improve work efficiency simultaneously.
2017, 30(4): 566-575.
doi: 10.13275/j.cnki.lykxyj.2017.04.005
Abstract:
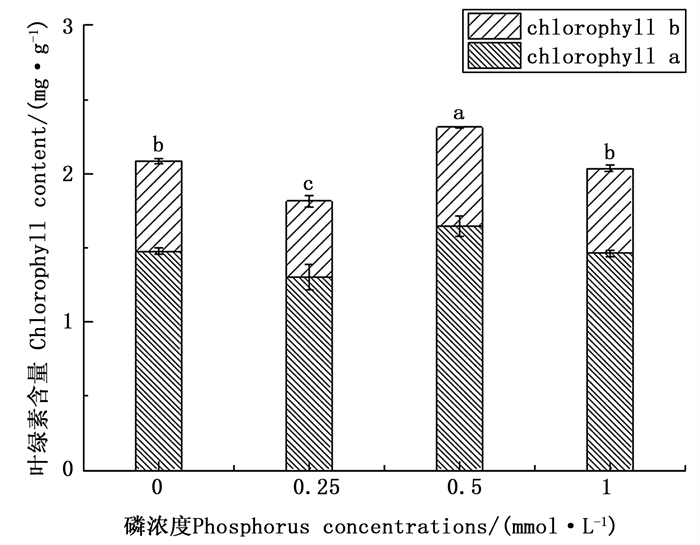
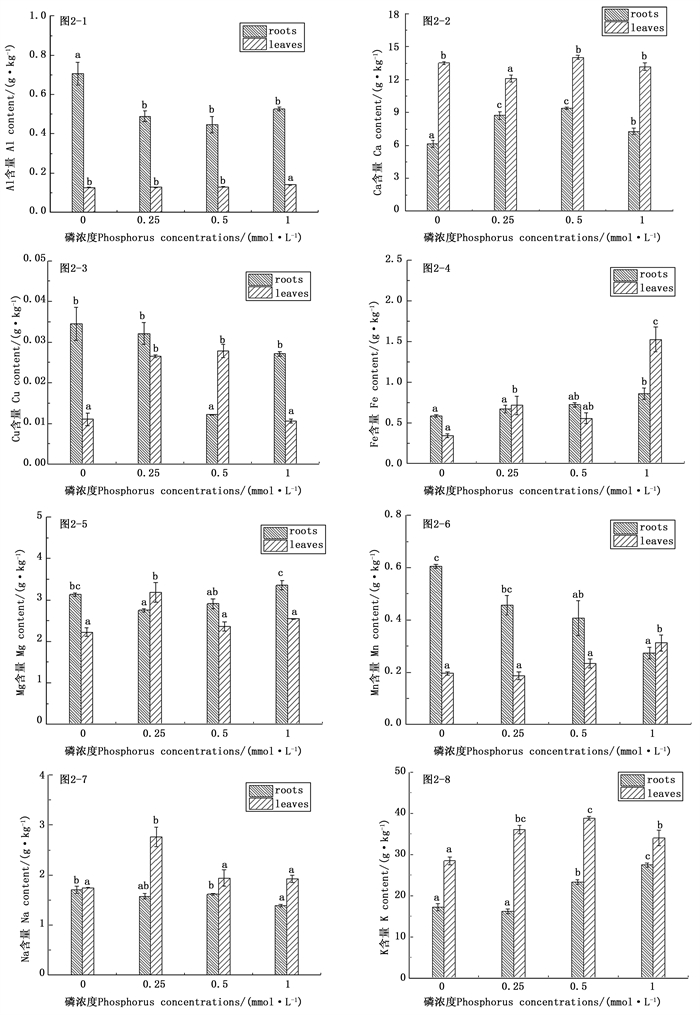
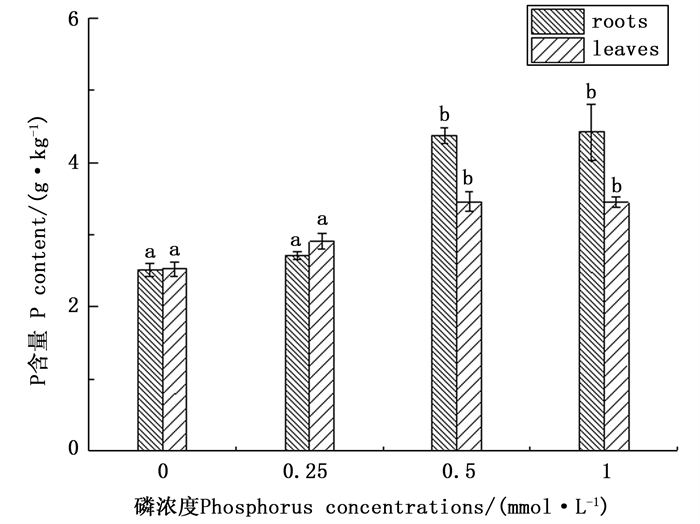
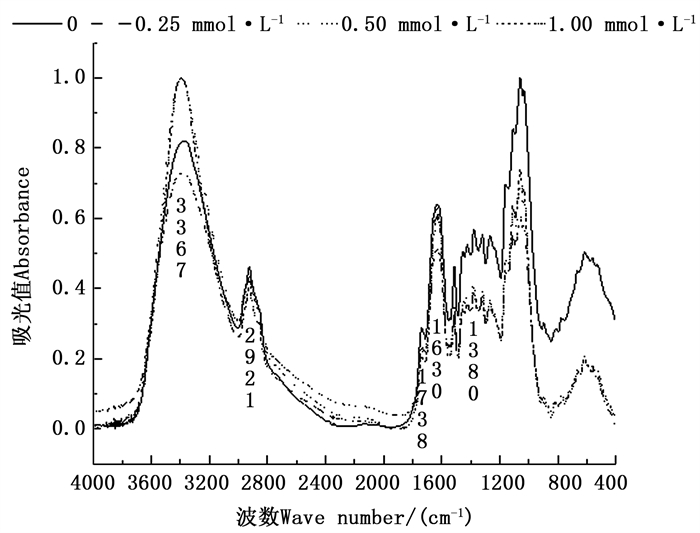
Objective To investigate the response mechanism of low-P stress on the antioxidant enzyme activities, nutrient uptake and bio-macromolecules of Chinese fir. Method The effects of low phosphorus stress on the physiological indexes of Chinese fir (Cunninghamia lanceolata) seedlings, the mechanism of low phosphorus stress on the nutrient uptake of Chinese fir seedlings and the spectral characteristics of different parts of Chinese fir seedlings were studied by setting different phosphorus concentration in Hoagland nutrient solution. Result With the decrease of phosphorus level, the SOD activity, CAT activity, chlorophyll a, chlorophyll b and total chlorophyll content of Chinese fir seedlings rose at initial and then decreased. Low phosphorus stress made POD activity increase, and the MDA content decreased at first and then increased in the roots of Chinese fir. In the leaves, the POD activity and MDA content decreased at first and then increased. Low phosphorus stress had a significant effect on the absorption and utilization of nutrient elements in roots and leaves of Chinese fir seedlings. The content of Mn in Chinese fir roots showed an upward trend with the increasing level of P deficiency. The content of Al and Cu decreased at first and then increased, while the content of Fe and K decreased, and the content of Ca increased at first and then decreased. In addition, the accumulation of Fe and Mn in the leaves of Chinese fir showed a decreasing trend, and the accumulation of Cu and K increased and then decreased. On 3 367, 2 924, 1 736, 1 630, 1 380, 1 150~1 000 cm-1 wavelength, low phosphorus stress had an effect on the root and leaf tissue where the light absorption value of characteristic peak were different. Conclusion Under low phosphorus stress, the root and leaf of Chinese fir inhibit the formation of MDA by changing the activity of protective enzymes (SOD, CAT and POD), and decrease the damage of membrane lipid peroxidation to the cell membrane system. They also avoid the damage of low phosphorus stress by increasing the absorption of other nutrient elements, and adapt to the low phosphorus environment by changing the contents of sugars, amino acids and proteins in different parts of Chinese fir.

2017, 30(4): 576-581.
doi: 10.13275/j.cnki.lykxyj.2017.04.006
Abstract:
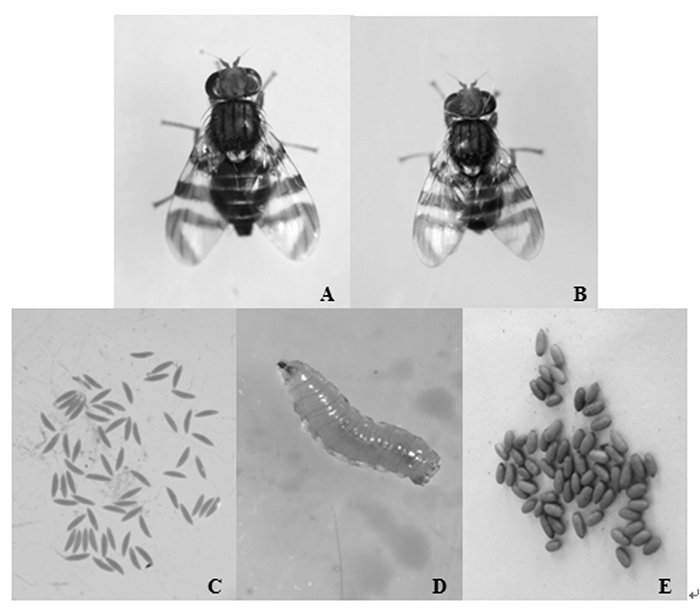
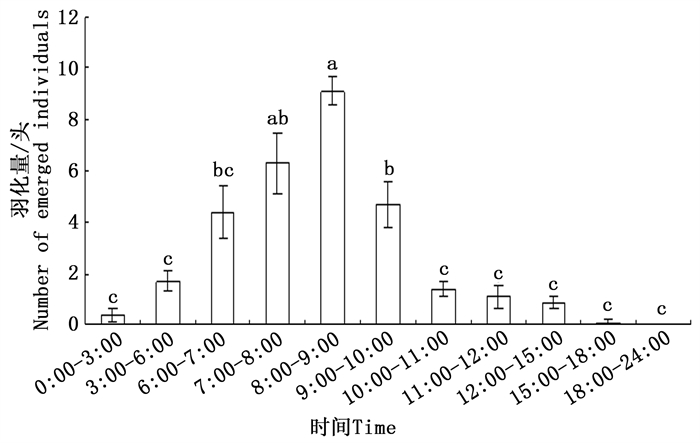
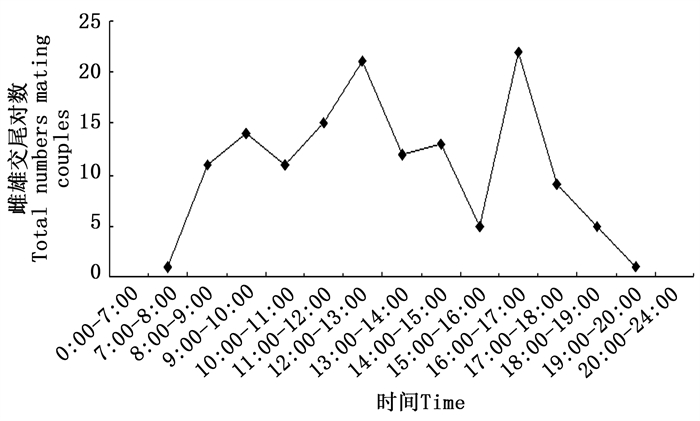
Objective To study the biological characteristics of fruit fly, Rhagoletis batava obseuriosa Kol. (RBO) (Diptera: Tephritidae). Method The life cycle and biological characteristics of RBO, including eclosion, mating, oviposition, pupation and population dynamics were studied through laboratory and field observation in Dengkou county, Inner Mongolia. Result Adult RBO occurred from the middle June to the early August, and weather could have impact on adult amount. About 81.3% of RBO emerged from 6:00 to 10:00, and the peak time was 8:00 to 9:00. The larvae came out of fruit and pupated mainly in the early morning from 0:00 to 6:00, especially from 3:00 to 6:00. The mating time mainly occurred in the daytime and there were two peaks from 12:00 to 13:00 and 16:00 to 17:00. Usually, the mating lasts 239 ± 11.86 min. The fruit fly preferred to lay one egg into one fruit which the length was 6.65 ± 0.28 mm and the width was 5.47 ± 0.40 mm. The mating and egg-laying behavior of R. batava obseuriosa were studied in details too. Conclusion There is only one generation of RBO per year in Dengkou county, Inner Mongolia. The larvae develop within the fruit of Hippophae rhamnoides and pupate in the soil. Though adult period was short, it should be an exact stage for controlling the pest.


2017, 30(4): 582-587.
doi: 10.13275/j.cnki.lykxyj.2017.04.007
Abstract:
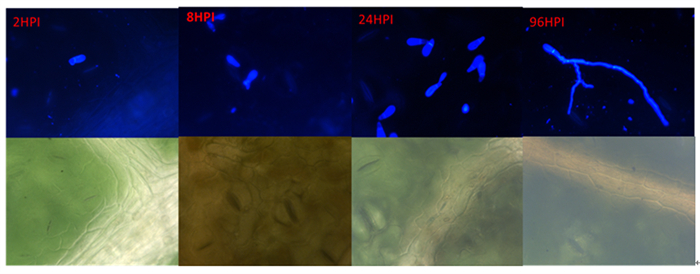
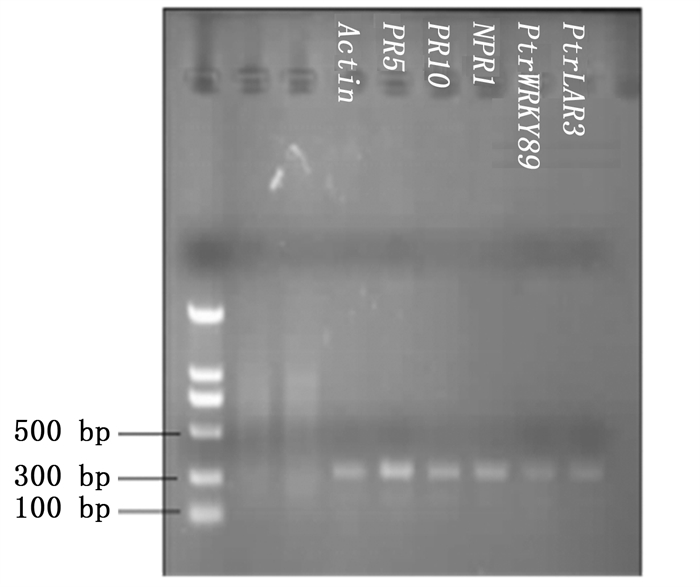
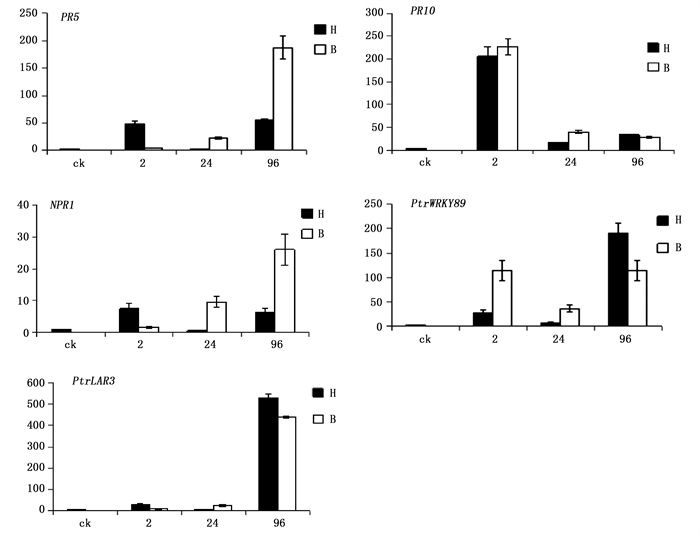
Objective To study the mechanism of Marssonina brunnea sp. monogermtubi formae speciales (RHBH) infecting Populus Section Leuce and M. brunnea sp. multigermtubi formae speciales (RHHB) infecting Populus Section Aigeiros. Method Based on pathogen-host interaction system, the pathogen's spore germination, growth and infection process on poplar leaves were investigated by using fluorescence microscopy strain method and the expression of five pathogen-relative genes in hosts was also analyzed by RT-qPCR technique. Result The results showed that the spores of RHHB were able to grow and successfully infect the hosts of Populus Section Aigeiros, the spores of RHBH were also able to grow but failed to infect the hosts of Populus Section Aigeiros. The pathogen-resistant genes of Populus Section Aigeiros could be induced and express during the infection process of the two formae speciales. The gene express of WRIKY89 followed a similar expression trend, while the other four genes (PR5, PR10, NPR1 and LAR3) followed different expression patterns in time and quantity for the two formae speciales. Conclusion The study provides some references for study the mechanisms of the two formae speciales and their differentiation.

2017, 30(4): 588-594.
doi: 10.13275/j.cnki.lykxyj.2017.04.008
Abstract:
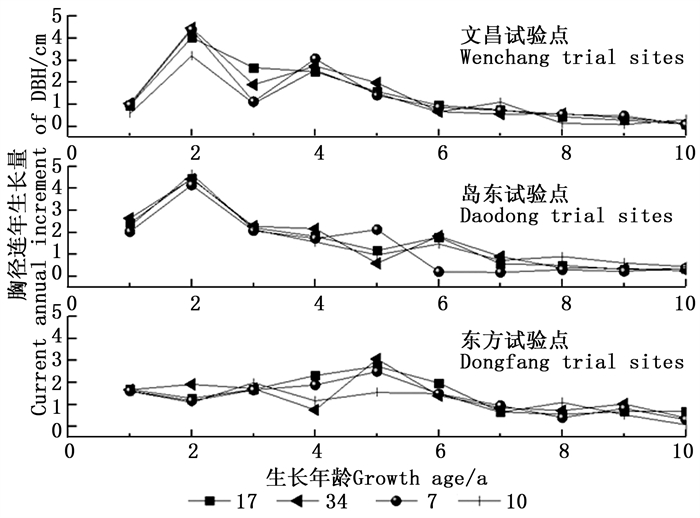
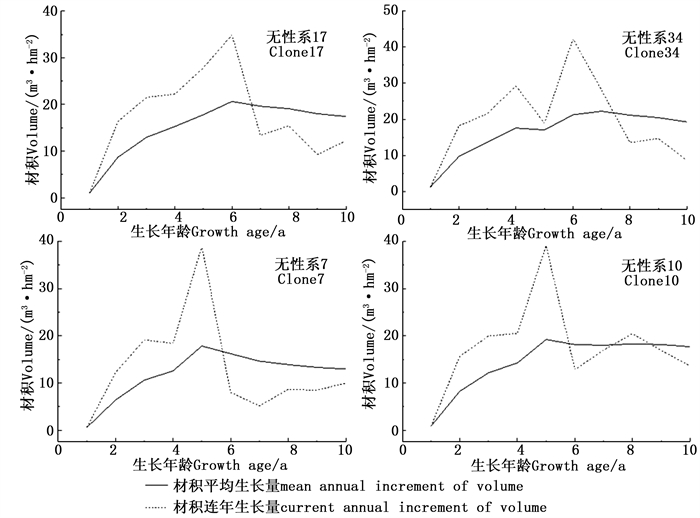
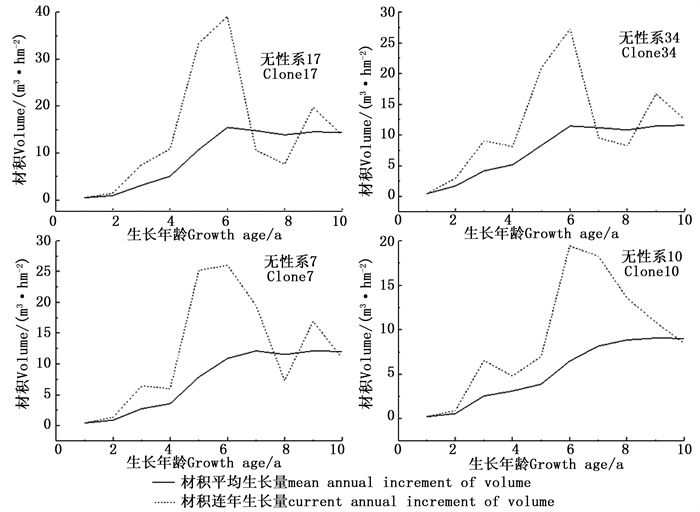
Objective To study the growth patterns and determine their quantitative maturity and appropriate rotation age of casuarina clones in Hainan island. Methods The field test data of ten years' growth data of height, diameter at breast height (DBH), and volume of 4 casuarina clones at 3 trial sites of Hainan Island were collected to analyze the growth processes of different casuarina clones. Results Both the height and DBH growth of casuarina clones presented a "fast-slow" growth pattern. The fast-growing phase appeared 1-6 years after planting, and then the slow-growing phase appeared. The volume growth presented a "slow-fast-slow" pattern. The slow-growing phase appeared from the first year to the third year after planting, and fast-growing phase appeared in the 4th to 7th year after planting, then slow-growing phase appeared again. Based on the volume curve intersection point of mean annual increment and current annual increment, the quantitative maturity of casuarina clones was in the 6th to 8th year after planting. Based on the volume mean value of 4 casuarina clones in 3 trial sites, Richards curve of volume growth of casuarina clone in Hainan Island was fitted. The characteristic values obtained from Richards curve are as follows: the initial phase of fast-growing of volume growth t1 = 4.9 years after planting, the termination phase t2 = 8.4 years, the period of maximum relative growth rate tm = 6.9 years, and the maximum volume growth rate Vm = 25.8 m3·hm-2. Conclusion Based on the aforementioned results, the rotation of casuarina clone in Hainan Island are recommended as 6-9 years after planting.


2017, 30(4): 595-603.
doi: 10.13275/j.cnki.lykxyj.2017.04.009
Abstract:
Objective In order to screen out superior provenances and individual trees for further cross-breeding, the inter-provenance genetic variations in terms of wind-resistance, growth and morphological traits were discussed in this context due to a trial of Casuarina junghuhniana including 27 provenances at Lingao, Hainan, China. Method The height, DBH, volume and survival were measured at the 2nd, 5th and 7th years after planting, and the qualitative traits including AP, SFS, DPB, TPB, LDB, APB, LPB and RES were investigated at the 7th year after planting. The genetic variations of these traits were studied by variance analysis, genotypic and phenotypic correlations, and genetic parameters. The provenances of C. junghuhniana were also assessed by comprehensive coordinate method. Result Significant differences (P < 0.05) were detected among 27 provenances in survival and RES at the 2nd, 5th and 7th years after planting. For a further analysis, the top 18 provenances in higher survivals at age of 7 indicated signi? cant differences (P < 0.01) in tree height, DBH, volumes among provenances at the 2nd, 5th and 7th years after planting. It was also found that there were significant differences in TPB, APB, LDB, SFS (P < 0.01) and AP (P < 0.05) among provenances 7 years after planting. The heritability was moderate for growth traits and low for qualitative traits, suggesting the genetic controls were moderate on growth and weak on qualitative traits. Trends of coefficient of genetic variation for height were nearly stable, while the coefficients of genetic variations in DBH and volume tended to decreasing at initial and then increasing with age. The coefficients of genetic variation of height, DBH and volume were 11.89%-12.30%, 11.67%-13.67% and 30.20%-38.11%, respectively, and those for qualitative traits 7 years after planting ranged from 3.84×10⁻⁵% to 5.56%. The high age-age and trait-trait phenotypic and genetic correlations for height and DBH indicated that early selection and multiple traits selection were feasible. Height was superior to other traits in the early selection for C. junghuhniana due to its genetic stability. Conclusion By analyzing nine traits at the 7th year after planting by comprehensive coordinate method, three optimal provenances were selected, which are worthy to be developed for producing and cross-breeding.
2017, 30(4): 604-609.
doi: 10.13275/j.cnki.lykxyj.2017.04.010
Abstract:
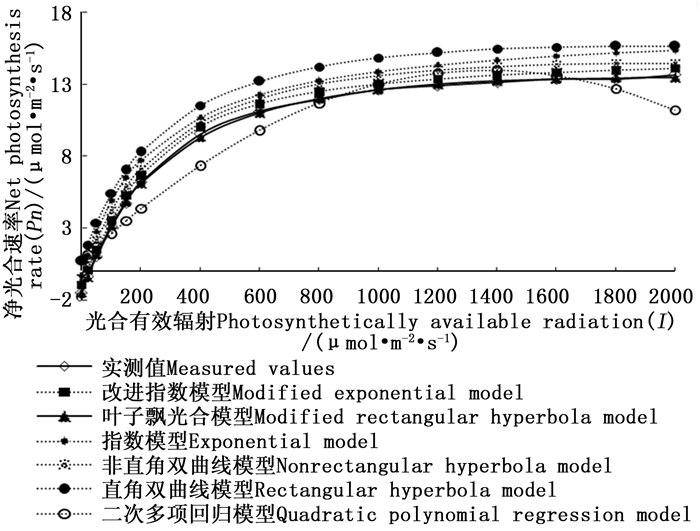
Objective In order to reveal the physiological and ecological characteristics of Michelia guangdongensis, and provide a theoretical basis for its cultivation in landscape greening, the photosynthesis light response curves and fitting of application model were studied. Method Six typical models of light-response curve of leaf net photosynthesis, such as quadratic polynomial regression model, non-rectangular hyperbola model, rectangular hyperbola model, modified rectangular hyperbola model, exponential model and modified exponential model, were used to fit the photosynthesis light response curves of M. guangdongensis and the best fitting model was determined. Result (1) There was a nonlinear relationship between the leaf photosynthesis rate and photosynthetically available radiation. The modified rectangular hyperbola model had the best photosynthetic-optical response curve, and had the light suppression phenomenon in accordance with the law of plant growth. The fitting effect is better than that of the other five models. (2) The parameters of Pnmax, Isat, Ic, and Rd, calculated by modified rectangular hyperbola model were the closest to the measured values. The determined coefficient R2 was 0.999, which was the largest among the six models. In addition, the MAE and MSE were the smallest and the highest fitting accuracy among these models. (3) The light saturation point (Isat) was 1 598.54 μmol·m-2 ·s-1 and the light compensation point (Ic) was 26.74 μmol·m-2 ·s-1, the maximum net photosynthesis rate (Pnmax) was 13.46 μmol·m-2·s-1, the dark respiration rate (Rd) was-1.58 μmol·m-2·s-1 and the Initial quantum efficiency (φ) was 0.06. Conclusion The modified rectangular hyperbola model is the best fitting model for the photosynthesis light response curve of M. guangdongensis. M. guangdongensis is a sun-pollinating plant, which is warm, humid and shade-tolerant, so this species has an expansive developing foreground.
2017, 30(4): 610-616.
doi: 10.13275/j.cnki.lykxyj.2017.04.011
Abstract:
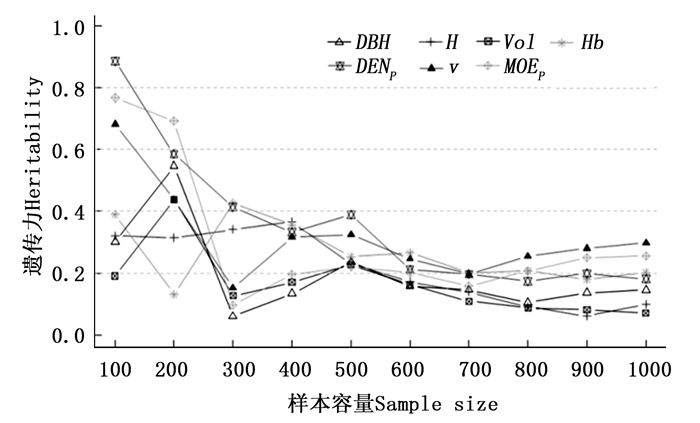
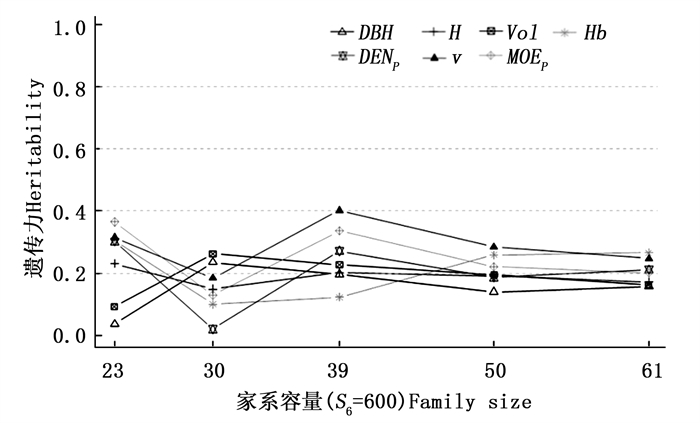
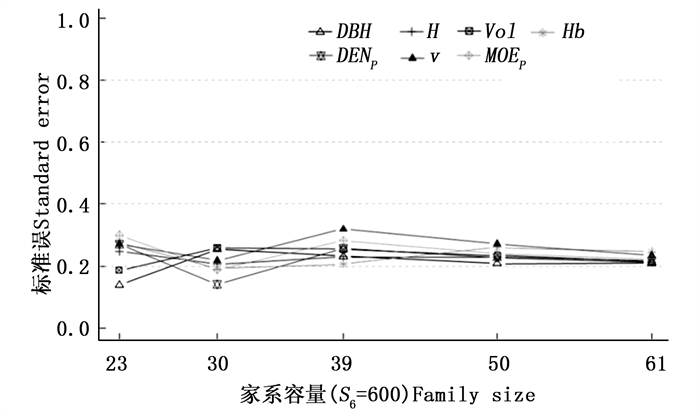
Objective To determine the amount of slash trial samples for high precision and efficiency of heritability estimation, which provide the optimal genetic parameters and selection strategies for tree breeding. Method The growth traits (diameter at breast height and tree height) and the wood properties (basic wood density and modulus of elasticity) of 1 023 sample trees from 61 half-sib families of 22-year-old slash pine (Pinus elliottii) were investigated as the experimental data. Then the heritability of each trait was estimated using Residual Maximum Likelihood (REML) in the flexible mixed modeling program ASReml-R. And the critical or least sample size for heritability estimation of each trait was determined by comparing and analyzing the convergence of the estimated values of heritability and their standard errors under different sample sizes. Result (1) In this trial, the estimated values of heritability and their standard errors were extremely unstable when less than 39 families or 600 individuals were used. And the accuracy of these values increased gradually by increasing sample size or family size. (2) The sample size should increase correspondingly in the estimation of the genetic parameters of the traits with low heritability. Conclusion In this study, more than 39 families or 600 individuals should be used for the reliable heritability estimation. The sample size for heritability estimation of wood properties could be less because of their high heritability. This paper provides a case study for estimating heritability of timber tree species. The results and the methods for determination of the critical sample size also have reference value for the corresponding study.

2017, 30(4): 617-623.
doi: 10.13275/j.cnki.lykxyj.2017.04.012
Abstract:
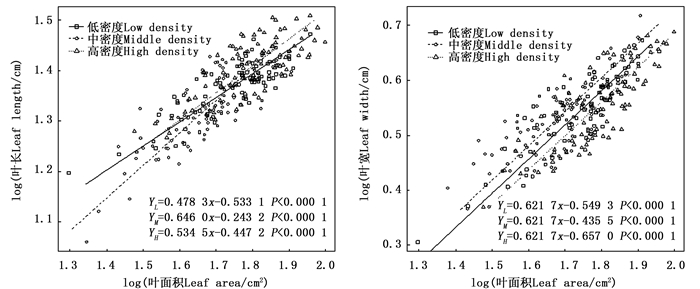
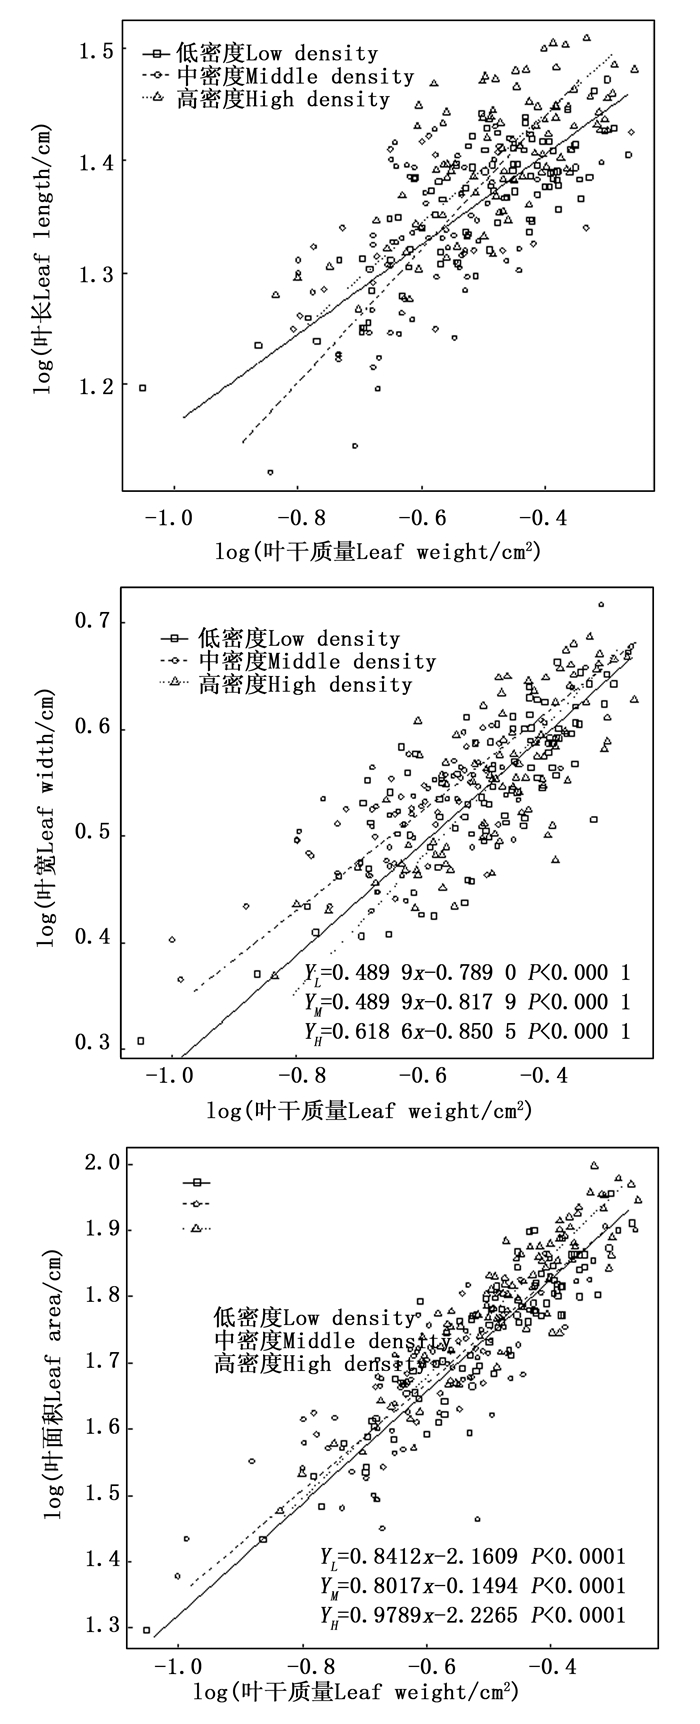
Objective To approach the response of leaf traits and the allometric relationship of Pleioblastus amarus to stand densities, so as to provide a theoretical guidance for its cultivation and management. Method Leaf length (LL), width (LW), area (LA) and weight (LM) of 1-3 years old bamboo from three stand densities (low density, 14 430-16 545 stems·hm-2, L; medium density, 31 590-34 560 stems·hm-2, M; high density, 54 120-55 560 stems·hm-2, H) of P. amarus forest was measured, the characteristics of leaf traits and its allometric relationship was analyzed by standardized major axis method (SMA). Result With increasing bamboo age, the leaf length, leaf shape index (ratio of leaf length to leaf width) and specific leaf area decreased after an initial increase, while the leaf width and leaf area had an overall decrease. With increasing stand density, the leaf length, leaf width, leaf shape index, leaf area and specific leaf area all increased at first but decreased then. There were significant difference on leaf area and specific leaf area among three stand densities. bLL-LA, bLW-LA, bLL-LM and bLW-LMfor three stand densities, bLA-LM for low stand density and medium stand density was significantly smaller than 1.0, which indicated the relationship between leaf length, leaf width and leaf area, leaf mass of the experimental stands, and the relationship between leaf area and leaf mass for low stand density and medium stand density were allometric growth. While bLA-LMof high stand density was close to 1.0, indicating relative growth between them for high stand density was isometric. With increasing stand density, bLL-LA and bLW-LM decreased after an initial increase, while bLW-LM and bLA-LM changed in the opposite trend. Furthermore, there were significant difference on bLL-LA, bLL-LM and bLA-LM among the three stand densities. bLW-LAincreased overall with increasing stand density, bLW-LA for high stand density was obviously higher than that of other two stand densities. Conclusion The density impacted the leaf traits and their allometric relationship of P. amarus heavily, and leaf length was more susceptible than the other leaf traits to density. P. amarus in the medium density (31 590-34 560 stems·hm-2) with the bigger leaf length, leaf width, leaf area and specific leaf area of the three stand densities, is the suitable density for cultivation and management.
2017, 30(4): 624-632.
doi: 10.13275/j.cnki.lykxyj.2017.04.013
Abstract:
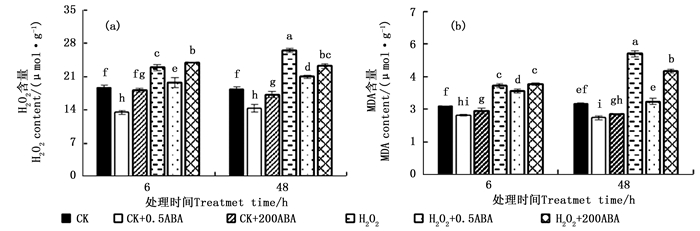
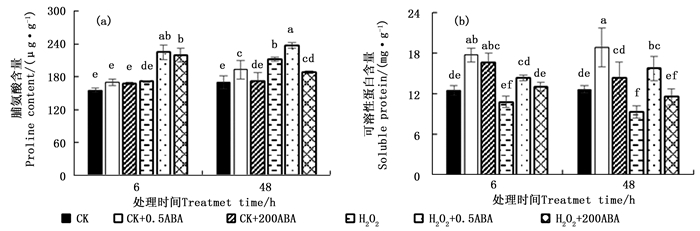
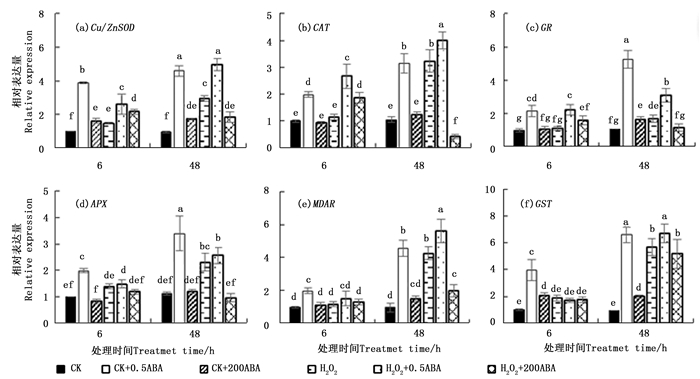
Objective To investigate the mechanism of exogenous abscisic acid(ABA)on regulating oxidative stress of Platycladus orientalis, the effects of reactive oxygen metabolism were studied in the leaves of P. orientalis exposed to hydrogen peroxide (H2O2) stress with the application of different concentrations of ABA. Method P. orientalis seedlings were exposed to 100 μmol·L-1 H2O2 were treated with 0.5 and 200 μmol·L-1 ABA, and physiological indexes and expression levels of genes related to reactive oxygen metabolism were studied. Result (1) 100 mmol·L-1 H2O2 significantly increased the contents of H2O2, malondialdehyde (MDA), glutathione (GSH) and proline and activities of antioxidant enzymes SOD and CAT in P. orientalis leaves, while soluble protein content decreased at 48 h. (2) Compared with 200 μmol·L-1 ABA, 0.5 μmol·L-1 ABA significantly enhanced the activities of SOD, POD and CAT, and increased the contents of GSH, proline and soluble protein in H2O2-treated seedlings, accompanied by the reduction of H2O2 and MDA contents. (3) 100 mmol·L-1 H2O2 up-regulated the expression levels of Cu/Zn-SOD、CAT、APX、MDAR和GST genes in P. orientalis at 48 h, and moreover, the presence of 0.5 μmol·L-1 ABA further prompted the expression levels of Cu/Zn-SOD、CAT、GR、APX、MDAR and GST genes, compared with 200 μmol·L-1 ABA under normal and H2O2 conditions. Conclusion Low concentration of 0.5 μmol·L-1 ABA effectively enhanced antioxidant defense, reduced oxidative stress and membrane lipid peroxidation in leaves of P. orientalis under H2O2 stress, which lowered the damage of reactive oxygen species to P. orientalis leaves and improved its resistance.

2017, 30(4): 633-639.
doi: 10.13275/j.cnki.lykxyj.2017.04.014
Abstract:
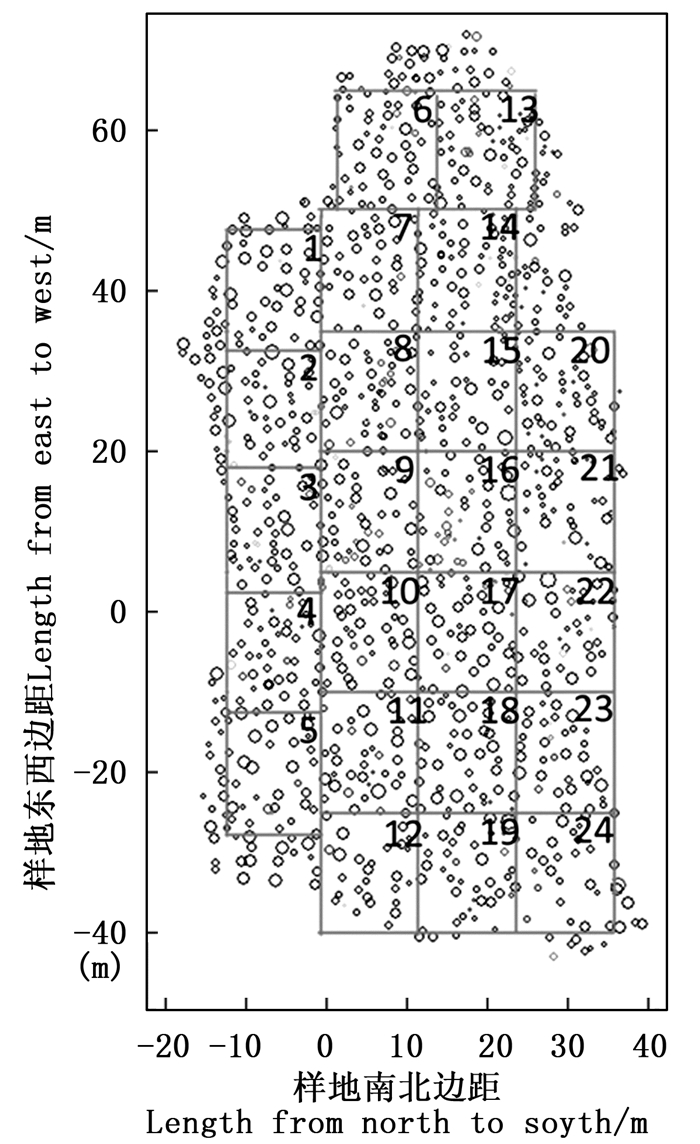
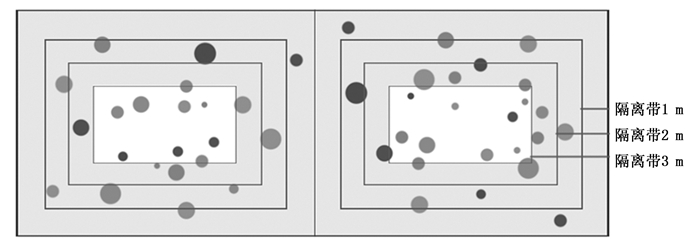
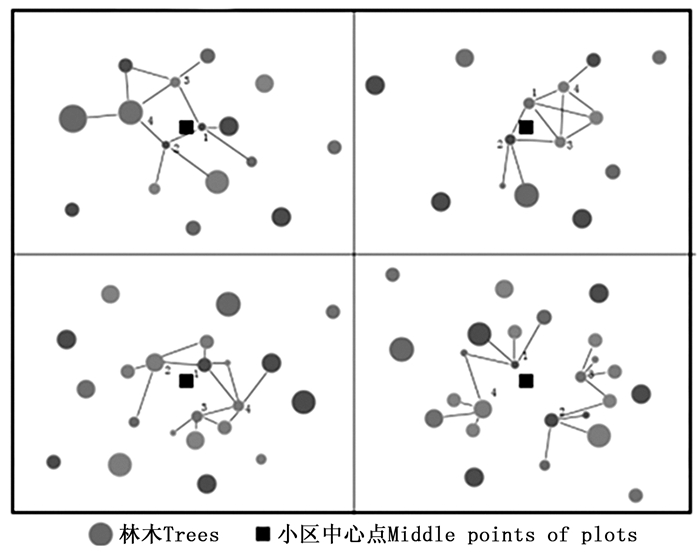
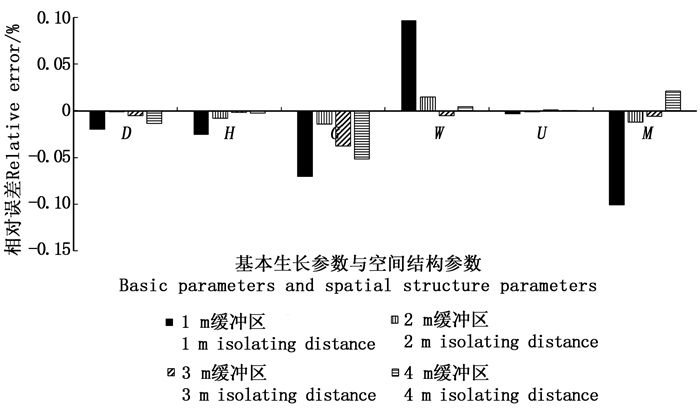
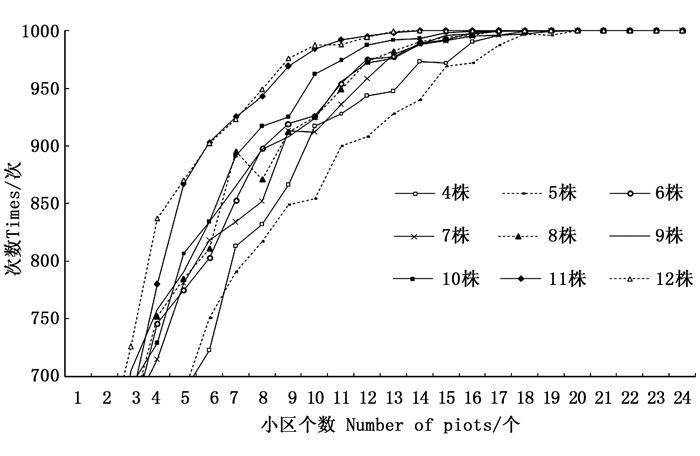
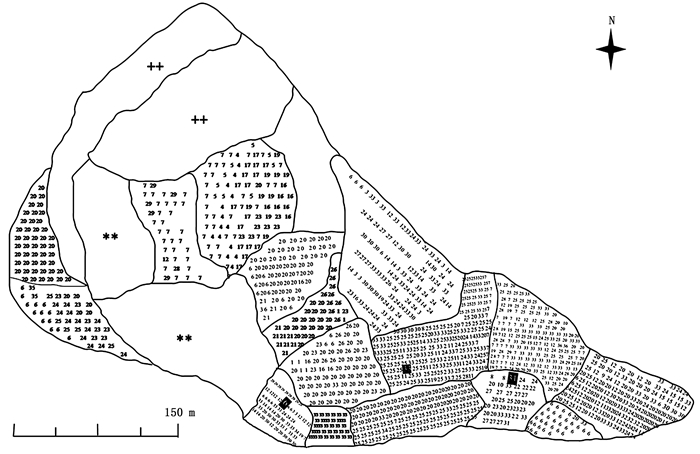
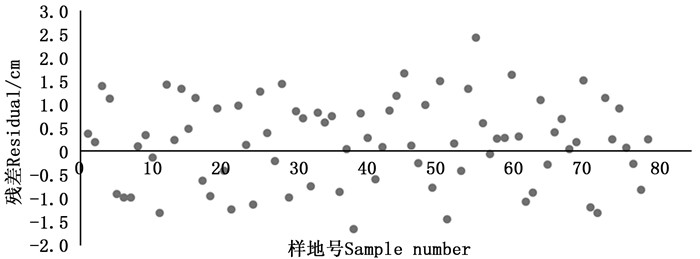
Objective To explore and optimize the method of investigation and analysis of forest sample data Method A Platycladus Orientalis plantation in West Hill of Beijing was used as a sample plot. The design of the experiment was carried out by using the complete random optimization design method. In order to remove the edge variability among the cells, the survey data need to be improved to reduce the accuracy for forest management experiment. This study includes the following two aspects. 1. Gradually narrowing the area of the survey area of cells, to explore the most appropriate distance among cells, then gradually decreased the amount of cells, select n cells in the 24 cells randomly and repeat for a thousand times, finally the number of repeat for different distance among cells were found. 2. Taking the center of cells as a sampling to survey different amounts of tree which are ordered by distance between the samplings, also repeating for a thousand times, and to determine the least amount needed for repeat of cells for different amount of trees. The study verified the relationship between the repeat times and the stand status of several cells in Platycladus orientalis plantation in West Hill, and find the method to process the data of this plantation by changing the distance of cells or the amount of trees to analysis the relationship between cells and the whole sample plot. Result The results showed that when the distance between cells is 2 m, the probability could reach higher than 90%, when comparing the stand state by using 6 repeat, the probability will be even higher. However, 4 trees in 12 cells can meet the demands, or 11 trees in 6 cells. Conclusion This study not only confirmed the distance for cells, and also determined the minimum amount of repeats.
2017, 30(4): 640-647.
doi: 10.13275/j.cnki.lykxyj.2017.04.015
Abstract:
Objective To determine the optimal pollen donors by paternity analysis of open-pollinated offspring and lay a foundation for the pollination disposition of olive orchards. Method 12 SSR markers were used for the paternity analysis of the open-pollinated offspring of 3 cultivars from Xichang City, Sichuan Province. Result The amount of alleles per SSR locus was 5 to 12 with an average of 9.08, and DCA11 and GAPU103A had the maximum alleles (12). The average heterozygosity (Ho) observed was 0.732, the expected heterozygosity (He) was 0.709 and the polymorphism information content was 0.675.163 offspring were identified by 12 SSR markers at 95% confidence level, accounting for 79.9% of the total of the offspring. The amount of identified offspring of 'Arbequina', 'EZhi-8' and 'Jiufeng-4' was 44, 47 and 72 respectively. Only 20 cultivars were identified as pollen donors among the 36 candidate cultivars with the average productive success of 5%, while the cultivars which were more than 5% were 'Koroneiki', 'Frantoio', 'Chenggu-32', 'Berat' and 'Barnea'. None of the offspring of the three cultivars were self-pollinated. Conclusion The cultivars 'Arbequina', 'EZhi-8' and 'Jiufeng-4' are self-incompatible. The cultivars 'Koroneiki' and 'Frantoio' are compatible with 'EZhi-8' and 'Jiufeng-4', while 'Chenggu-32' and 'Berat' are compatible with 'Arbequina'. Thus, in a new olive orchard, 'EZhi-8' and 'Jiufeng-4' can be the optimal pollen donors for 'Koroneiki' and 'Frantoio', while 'Chenggu-32' and 'Berat' are the optimal pollen donors for 'Arbequina'.
2017, 30(4): 648-652.
doi: 10.13275/j.cnki.lykxyj.2017.04.016
Abstract:
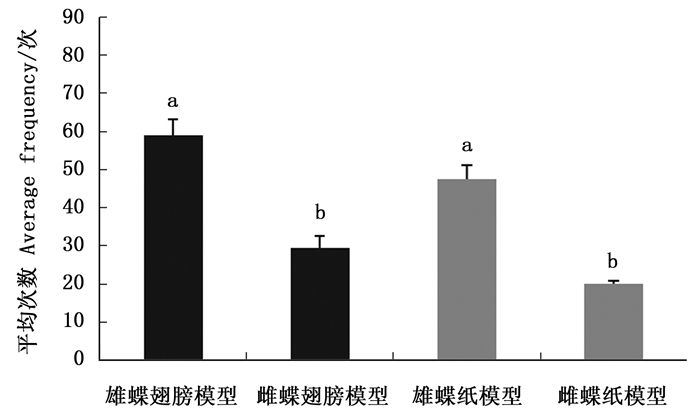
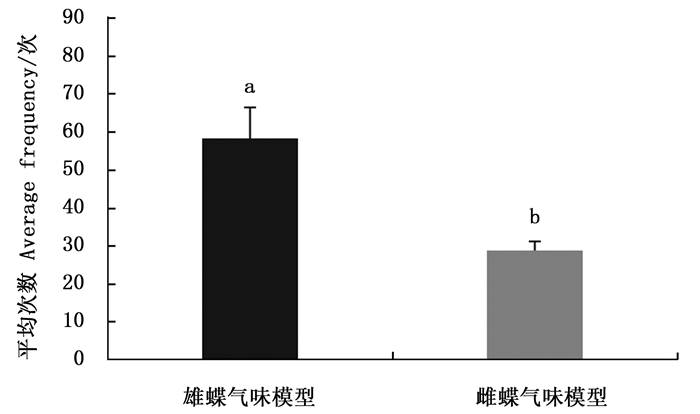
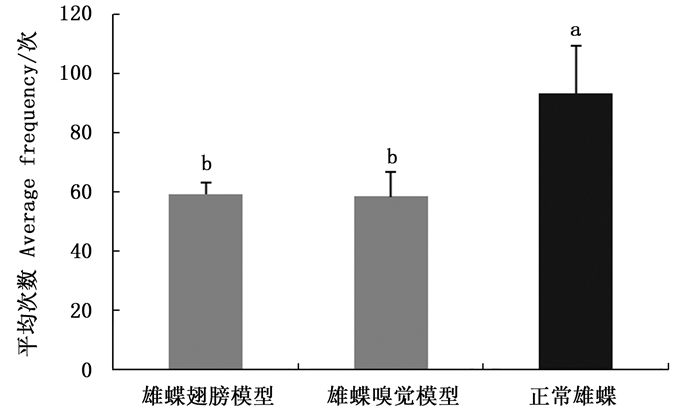
Objective To investigate the role of visual and olfactory cues in sex recognition in the sexually dimorphic butterfly Cethosia cyane cyane, and to further understand the sexual interactions. Method The females were placed in an insectary with three kinds of models, i.e. dissected natural wings (♀ and ♂), printed paper wings attached (♀ and ♂), and live adults (♀ and ♂), respectively. The frequency of female visiting the models was recorded. Result When only visual or olfactory cues existed, the frequency of female visiting the male models was higher than that of the female models. There were significant differences in the average frequency of females visiting females and males when both winged models and paper models presented, indicating that the females could distinguish the gender of conspecifics using visual cues alone. And there were significant differences in the average frequency of females visiting female and male odor models, indicating that the females could use olfactory cues to distinguish the sexes. When both visual and olfactory cues existed, there were significant differences among the average frequency of females visiting normal males, male winged models and male odor models, suggesting that the females were more likely to prefer the composite, multimodal display. Conclusion Female C. cyane cyane use both visual and olfactory cues to distinguish the gender of conspecifics during courtship. The females are more likely to prefer the composite, multimodal display.
2017, 30(4): 653-658.
doi: 10.13275/j.cnki.lykxyj.2017.04.017
Abstract:
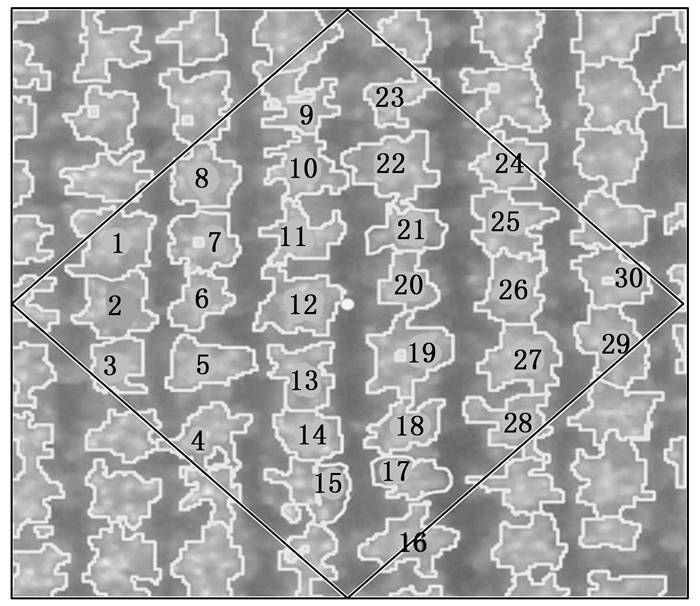
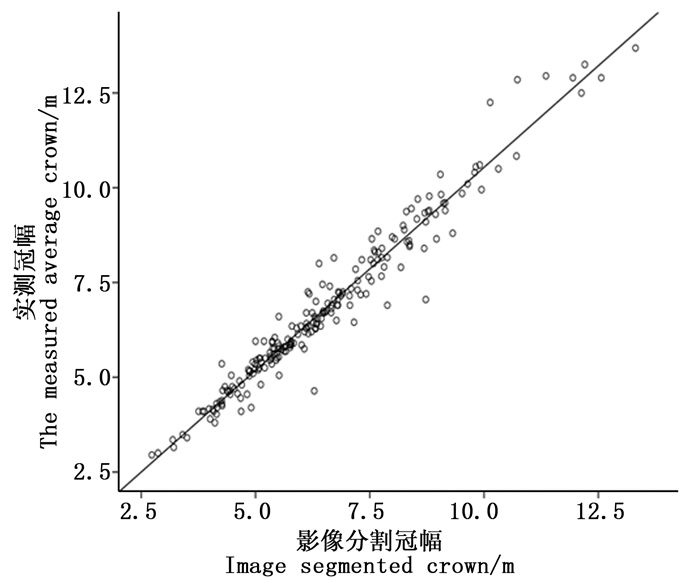
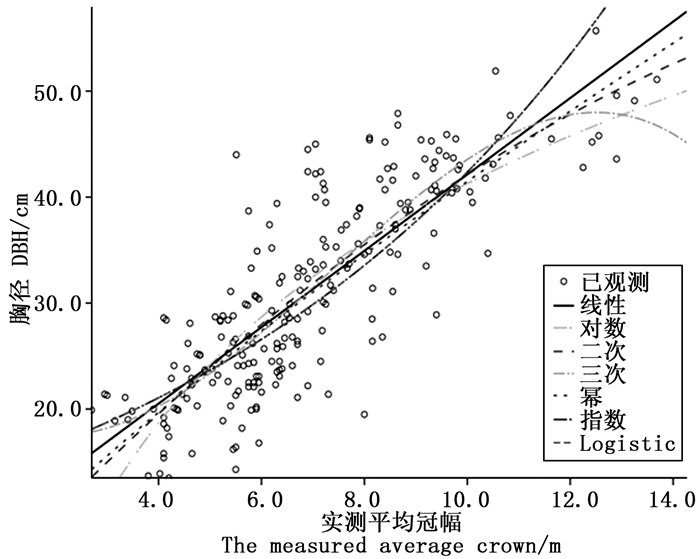
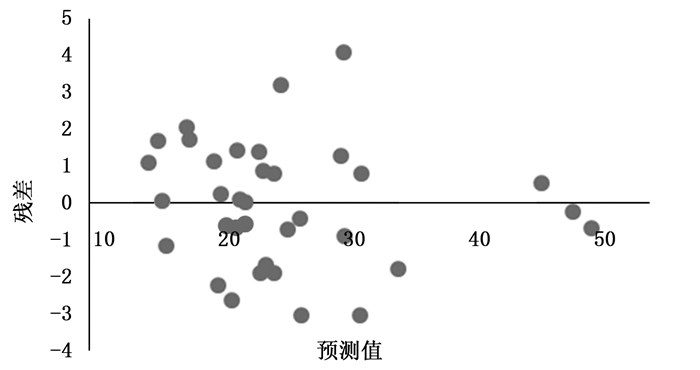
Objective To research poplar crown extraction and stand volume correlation based on UAV high resolution image and field investigation data, and to provide ideas and methods for UAV forest survey technology. Method Based on the data from the high resolution image acquired from UAV and the field investigation, the crown of poplar were segmented and extracted by object-oriented method, then modified it by field measured crown, and the crown-DBH model was established through field measurement data. Finally, the sample plot volume were calculated through single entry volume table and the correlation analysis and accuracy test were conducted. Result The crown image segmentation showed a good result, but the extraction of the crown was smaller than the actual value. The most suitable image segmentation scale, smoothness, and compactness of poplar crown were 10, 0.1, 0.5. Some poplar crown and DBH related models were established. It showed that linear equation had best fitting effect and its correlation coefficient was 0.75. T test of the volume which was calculated by related model and the field investigation volume showed sig=0.058>0.05, indicating that no significant difference in the two groups data. Conclusion By object-oriented method, the poplar crown is extracted effectively through the UAV high-resolution image. The method is accord with the accuracy demands of forest resources survey, which extracts poplar average crown by image and obtains poplar DBH by crown and DBH relationship model, then calculates stand volume.
2017, 30(4): 659-666.
doi: 10.13275/j.cnki.lykxyj.2017.04.018
Abstract:
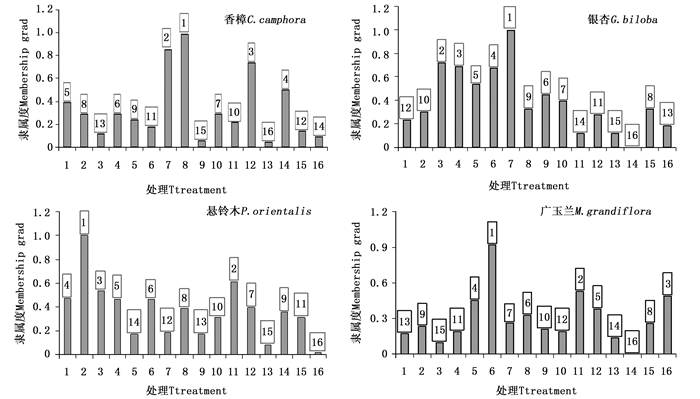
Objective Aim to reveal the growth patterns of 4 street tree species and how they adapt to the change of relationship between soil structure, nutrient and water condition. And to explore the management model of soil structure and nutrients suitable for the street trees in Shanghai, so as to improve their growth in Shanghai. Method Planting substrate experiments were carried out by orthogonal design with three factors of soil content diameter, the proportion of structure soil and soil moisture, each in four levels. The growth of aboveground parts and the root expanding of these trees under different conditions were analyzed. Result The results showed that the planting substrate had significantly influences on the height of Platanus orientalis. The height in treatment 3 was 4.42 m and significant higher (11.90%) than that of the control group. In addition, different treatments significantly influenced the tree's root expanding and biomass accumulation. The results indicated that the most suitable condition for roots growth of the four tree species were totally different, Cinnamomum camphora had the best root growth with treatment 8, the root length, surface area and volume were 162 564.21 cm, 42 370.89 cm2 and 833.98 cm3, which were all significant higher than that of the other treatments, respectively. While the total length of Ginkgo biloba root reached the maximum (26 498.01 cm) under treatment 4, and the other root indexes reached the biggest value with treatment 7. The root length, root surface, root average diameter and root volume of P. orientalis are significantly higher under treatment 2. All the root indexes of Magnolia grandiflora reached the maximum under treatment 6. Furthermore, the maximum root biomass value of C. camphora, G. biloba, P. orientalis and M. grandiflora were 1 029.52 g, 871.93 g, 1 294.84 g and 1 025.62 g and appeared in treatment 8, treatment 7, treatment 2 and treatment 6, respectively. Moreover, they were significant higher than that of the control group by 80.44%, 67.08%, 61.21%, and 81.36%, respectively. Through fuzzy membership method, the appropriate substrates selected for C. camphora, G. biloba, P. orientalis and M. grandiflora were treatment 8 (granule diameter 3 cm, formula soil 80% and soil moisture 50%), treatment 7 (granule diameter 3 cm, formula soil 60% and soil moisture 40%), treatment 2 (granule diameter 5 cm, formula soil 40% and soil moisture 60%) and treatment 6 (granule diameter 3 cm, formula soil 40% and soil moisture 80%), respectively. Conclusion It proves that the growth of C. camphora is more sensitive to water and nutrition condition of substrate and the suitable growth conditions are moderate soil moisture and rich soil nutrient content. G. biloba should grow in soil with medium nutrient and ventilation, and likes lower substrate water moisture; P. orientalis is suitable in well ventilated, medium water content and nutrient conditions; And M. grandiflora demands higher substrate moisture. Therefore, the conservation of the 4 tree species should be based on the demand characteristics of growth as far as possible to control soil conditions of street site in Shanghai.

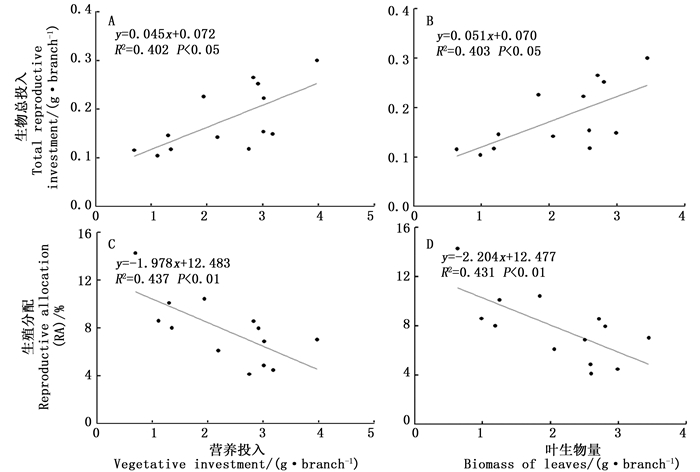
Reproductive Allocation in Each DBH Class for Tetracentron sinense Oliv. at Individual Modules Level
2017, 30(4): 667-673.
doi: 10.13275/j.cnki.lykxyj.2017.04.019
Abstract:
Objective The purpose of this study is to explore the reproductive allocation (RA) of Tetracentron sinense Oliv. and the relationship between reproductive and vegetative investment, and thus investigate the life history strategies and reasons causing this species endangered. Method Using fixed-area sampling plot in Meigu Dafengding Nature Reserve, the reproductive modules biomass of individuals with different DBH(diameter at breast height)class were collected and measured. Multiple comparison analysis was conducted to compare the differences in reproductive investment and allocation among different DBH class. The relationships between RA, reproductive modules biomass and the nutrient modules biomass were analyzed by correlation and linear regression analysis. Result (1) With increasing DBH, the reproductive and vegetative investment showed the same changing trend, and no trade off appeared between them; (2) At the level of modules, the RA value increased at the beginning and then decreased with increasing DBH; (3) The reproductive investment was positively correlated with the vegetative investment or leaf biomass significantly. However, RA was negatively correlated with the vegetative investment or leaf biomass significantly; (4) For the reproductive module, RA was significantly and negatively correlated with the dry weight of the shaft infructescence axis biomass. In contrast, there was a significantly positive correlation between seed biomass and pericarp biomass. A trade-off existed between seed quantity and size. Conclusion Vegetative investment had a promotional effect on the reproductive investment. The reproductive period of T. sinense. could be divided into four periods: initial, increment, peak, and decline phases. The seeds at different reproductive phases may have different life history strategies, reflecting the reproductive adaptation strategies during the process of evolution and development in this species.


2017, 30(4): 674-678.
doi: 10.13275/j.cnki.lykxyj.2017.04.020
Abstract:
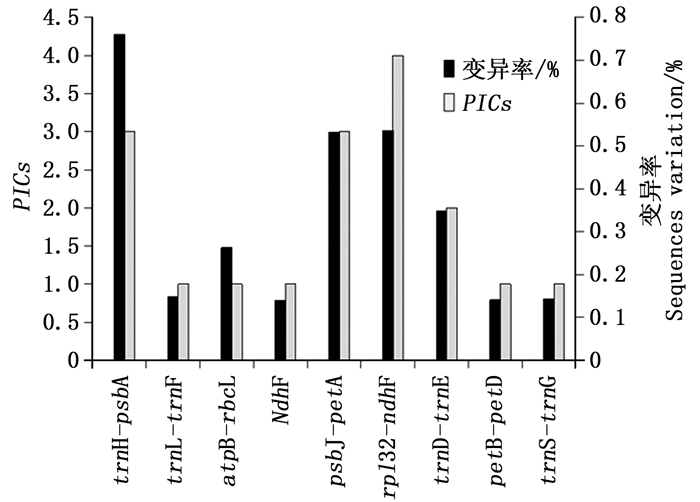
Objective By screen highly variable cpDNA sequences to study the phylogeography of Acer griseum. Method Twenty non-coding cpDNA sequences were sequenced. The genetic variation of sixteen natural populations in A. griseum was preliminarily analyzed with the selected highly variable sequences. Result Sequences alignment and phylogenetic analysis showed that the intraspecific variation of cpDNA in A. griseum was very low. Different variation were detected in some loci of nine cpDNA sequences and a relative high level of variation displayed in four sequences psbJ-petA, ndhF-rpl32, trnD-trnT and trnH-psbA. Conclusion The four selected highly variable cpDNA sequences could be used to study the phylogeny and genetic variation and clarify the history of population dynamics of A. griseum. These sequences will lay a foundation for future phylogeographic study in A. griseum.

2017, 30(4): 679-684.
doi: 10.13275/j.cnki.lykxyj.2017.04.021
Abstract:
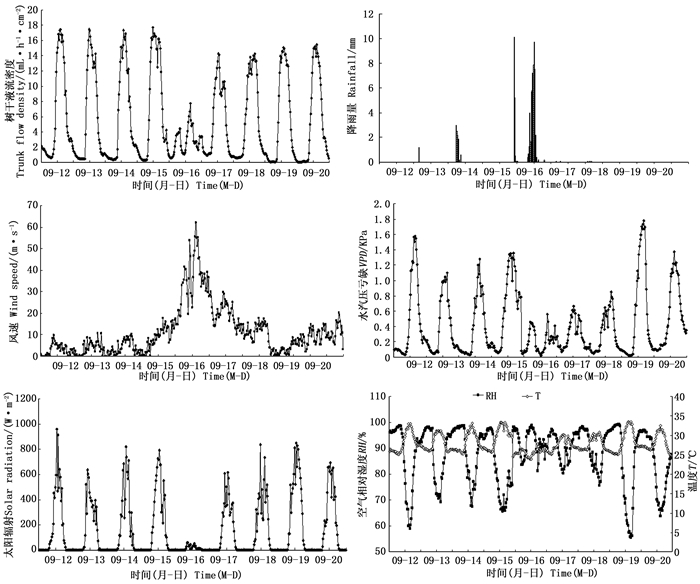
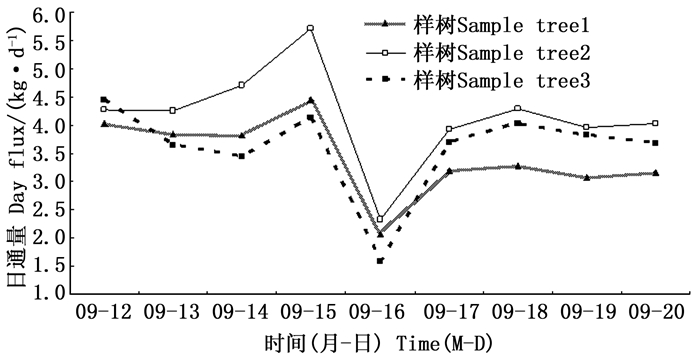
Objective To examine the affect of typhoon to water consumption of eucalyptus plantation, Methods The sap flow of Eucalyptus urophylla × E. grandis plantation was continuously measured using thermal diffusion stem flow meter (Germany, SF-G) during the typhoon process, and to analyze the responses of sap flow of E. urophylla × E. grandis to the typhoon weather conditions. The stand meteorological conditions were determined synchronously to enable the correlations between sap flow and meteorological factors to be examined during the typhoon weather process. Result The results showed that diurnal variations of sap flow displayed irregular multi-peak curves during the typhoon process, which was different from the typical single-peaked curves before and after the typhoon. The average daily flow density (2.89 mL·h-1·cm-2) was 53% less than that before the typhoon landing. The sap flow during typhoon night changed a lot, and the maximum peak (7.76 mL·h-1·cm-2) appeared in the afternoon which was 55% less than that before the typhoon landing. The flux in the day time during the typhoon process was significantly less than that before and after the typhoon (P < 0.01). The flow peak before typhoon landing (17.4 mL·h-1·cm-2) and the average flow density (6.15 mL·h-1·cm-2) were respectively 1.24 times and 1.14 times after the typhoon, and the flux in day time after the typhoon was lower than that before the typhoon. The main meteorological factors during the typhoon weather process were wind speed, air temperature, air humidity, vapor pressure deficit and rainfall, and the correlation coefficient of the wind speed increased by 52% compared to that before the typhoon. The correlation coefficient of rainfall was 2.6 times in front of the typhoon, and the other factors decreased about 50% than that before the typhoon. The main meteorological factors changed little before and after the typhoon process. Conclusion The average daily flow density, average flow density in the day time and daily flux during typhoon process were significantly less than that before and after the typhoon landing. But the fluid flow at night was significantly greater than that before and after the typhoon process. There was no obvious difference about the average daily flow density before and after the typhoon landing. But the fluid flow at night before the typhoon landing was significantly greater than that after the typhoon landing. The typhoon speed became the key factor of fluid flow through, and no significant correlation with solar radiation during the typhoon was found. Other factors kept unchanged before and after the typhoon, but the correlation coefficient in addition to the wind speed and rainfall were down significantly.
2017, 30(4): 685-692.
doi: 10.13275/j.cnki.lykxyj.2017.04.022
Abstract:
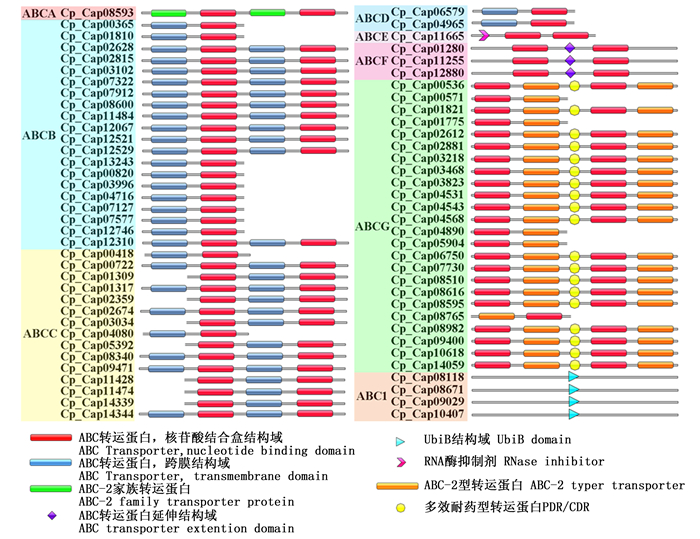
Objective Using bioinformatics method to investigate the detoxification of ABC transporters in Calonectria during the process infecting Eucalyptus, and to provide references for revealing the pathogenic mechanism of Calonectria. Method Using BLAST, HMMER, Pfam database, TCDB database to indentify and classify the ABC transporter of Calonectria within the whole genome, and to predict subcellular localization and the domain structure scheme with ProtCamp and IBS, respectively. Result Calonectria has a total of 70 ABC transporters, which belong to 8 subfamilies. 71% of the transporters are located in the cell membrane, 10% in the vacuole, and the rest in the mitochondria, peroxisome, endoplasmic reticulum and other endometrial systems. Calonectria ABC transporter has 4 types of molecules, contains full-size molecules, 3/4 molecules, half molecules and 1/4 molecules. According to the homology it is estimate that Calonectria ABC transporters has high similarity with MDR, PDR, HMT, MPE, STE, P-FAT and other transporters. It also has high similarity with the ABC transporters related to the synthesis of ribosome, translation and synthesis of peroxisome. Conclusion The ABC transporter of Calonectria pseudoreteaudii can transport exogenous chemicals, hydrophobic chemical molecules. It is also involved in cell metabolism, translation, ribosome synthesis, the export of mRNA, beta-oxidation, and provide energy for infecting as a cofactor of coenzyme Q.

2017, 30(4): 693-699.
doi: 10.13275/j.cnki.lykxyj.2017.04.023
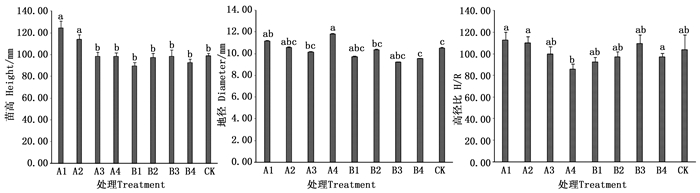
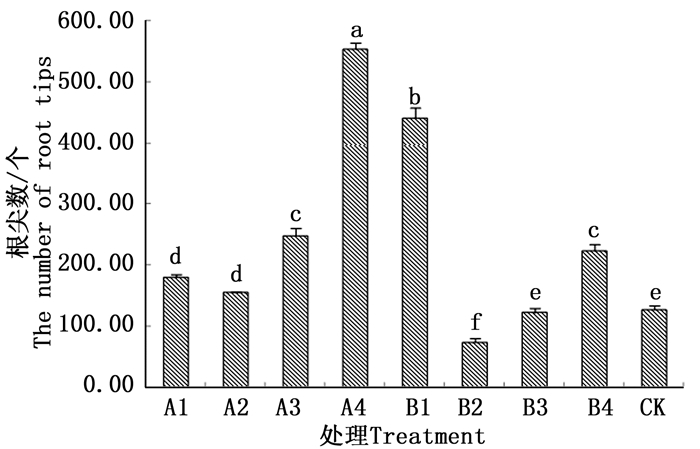
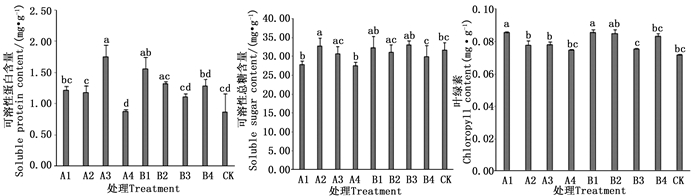
Abstract:
Objective To conduct chemical agent root-controlling experiments aiming at controlling bulky taproots, rare fibrous roots and root system twining of olive container seedlings, and to find the chemical root-controlling agents suitable for the olive container seedlings, so as to solve problems such as poor quality of olive seedlings caused by root system malformation. Method CuSO4 agents and ZnSO4 agents under 4 different concentrations were used in root-controlling experiments of 2-year-old olive container seedlings. The seedling height, ground diameter, aboveground biomass and underground biomass were measured. The growth characteristics of the root system were analyzed by a root system scanner, so that the effects of different growth indexes and physiological indexes on root-controlling effects were discussed. Result 1. The growth increment of aboveground parts of the container seedlings could be boosted by Cu agents under the concentrations of 20 g·L-1 and 60 g·L-1; the biomass accumulation could increase obviously by Cu agents under the concentrations of 60 g·L-1 and 200 g·L-1. 2. The Cu agent under 200g·L-1 had the most significant impact on the growth of new seedling roots; the Cu agent under 120g·L-1 promoted the increase of diameter, superficial area and volume of the root system effectively; various indexes of seedling lateral roots were inhibited by treatments under different ZnSO4 root-controlling agents. 3. Significant positive correlation existed between branch growth increment and lateral root length; Extremely significant positive correlation existed between the ground diameter increment, branch growth and the superficial area of lateral root. 4. Soluble protein content in leaves reached the maximum after treatment under the Cu agent of 120g·L-1; the chlorophyll content in leaves increased under treatment of Cu agent of 20g·L-1. Conclusion It was verified in the experiments that the CuSO4 agents under mass concentrations of 120 g·L-1 and 200 g·L-1 have good root control effects and can be applied in practice.

 Subvmission Guidelines
 Peer Review
 Reviewer Online
 Office Work


 Email alert
 RSS
RSS