

-
传统森林经营多以单一功能为目标,如追求木材生产的用材林经营就较少关注其它多种功能。由于在森林多种功能之间常存在矛盾,追求某种功能时可能会降低其它功能[1-2],这就难以满足社会日益快速增长的森林多种功能需求。因此,以多功能利用为特征的森林多功能经营应运而生,但需解决的技术瓶颈首先是尚不清楚森林各垂直层之间的关系,因而难以通过适当经营来调控乔木层结构并形成和维持林分的合理垂直结构,进而实现森林多功能利用[3-4]。
辽东栎(Quercus wutaishanica Mayr)次生林是黄土高原及宁夏六盘山区的典型天然林,研究其林分垂直结构特征变化规律可为其多功能经营提供科学依据。以前有关辽东栎林的研究多关注其分布范围、自然更新[5]、物种多样性和区系组成[6]、林分结构和空间分布[7]、细根生物量[8]等,有关林分生物量和碳储量层次组成的研究多是仅关注某个方面[9],而对林分结构特征(如林分密度和郁闭度等)如何影响各植物层生物量以及如何在此基础上开展多功能管理的系统研究还很少[10],尤其在有大量辽东栎林自然分布的六盘山区,此类研究还未见报道,这严重限制着辽东栎林的多功能经营技术发展。
本研究通过调查研究辽东栎林的垂直分层(乔木层、林下植物层、枯落物层)生物量组成及其随林分结构的变化规律,并权衡确定能使各层生物量均保持在较高水平的最佳林分结构,以便为辽东栎林多功能管理提供科学依据。
-
辽东栎林是六盘山区的地带性植被类型之一,在20世纪50年代曾进行过大规模采伐,在20世纪80年代建立自然保护区后停止采伐,现存几乎都是采伐后萌蘖更新形成的次生林,占自然保护区天然次生林面积的31.5%。伴生乔木树种主要有白桦(Betula platyphylla Suk.)、山杨(Populus davidiana Dode.)、少脉椴(Tilia paucicostata Maxim.)。林下灌木主要有陕西荚蒾(Viburnum schensianum Maxim.)、水荀子(Cotoneaster multiflora Bunge.)、绣球绣线菊(Spiraea blumei G.Don)、山楂(Crataegus pinnatifida Bunge.)、北京忍冬(Lonicera elisae Franch.)、榛(Corylus heterophylla Fisch.)、桦叶荚蒾(Viburnum betulifolium Batal.)、鞘柄菝葜(Smilax stans Maxim.)等;林下草本主要有淫羊藿(Epimedium brevicornu Maxim.)、点叶薹草(Carex hancockiana Maxim.)、糙苏(Phlomis umbrosa Turcz.)等。
宁夏六盘山自然保护区(35º27′22.5″~35º33′29.7″ N,106º12′10.6″~106º16′30.5″ E)面积904 km2,是六盘山森林分布的核心区,在自然地理区划上处于暖温带半湿润区向半干旱区的过渡带。保护区海拔变化在1 700~2 931 m,年均气温5.8 ℃,年最高气温30. 0 ℃,年极端最低气温−26. 0 ℃,无霜期90~130 d;土壤类型主要为石灰性灰褐土,总体特征是土层薄、质地粗。年均降水量557 mm,由南向北逐渐递减,降水集中于6—9月[11]。
-
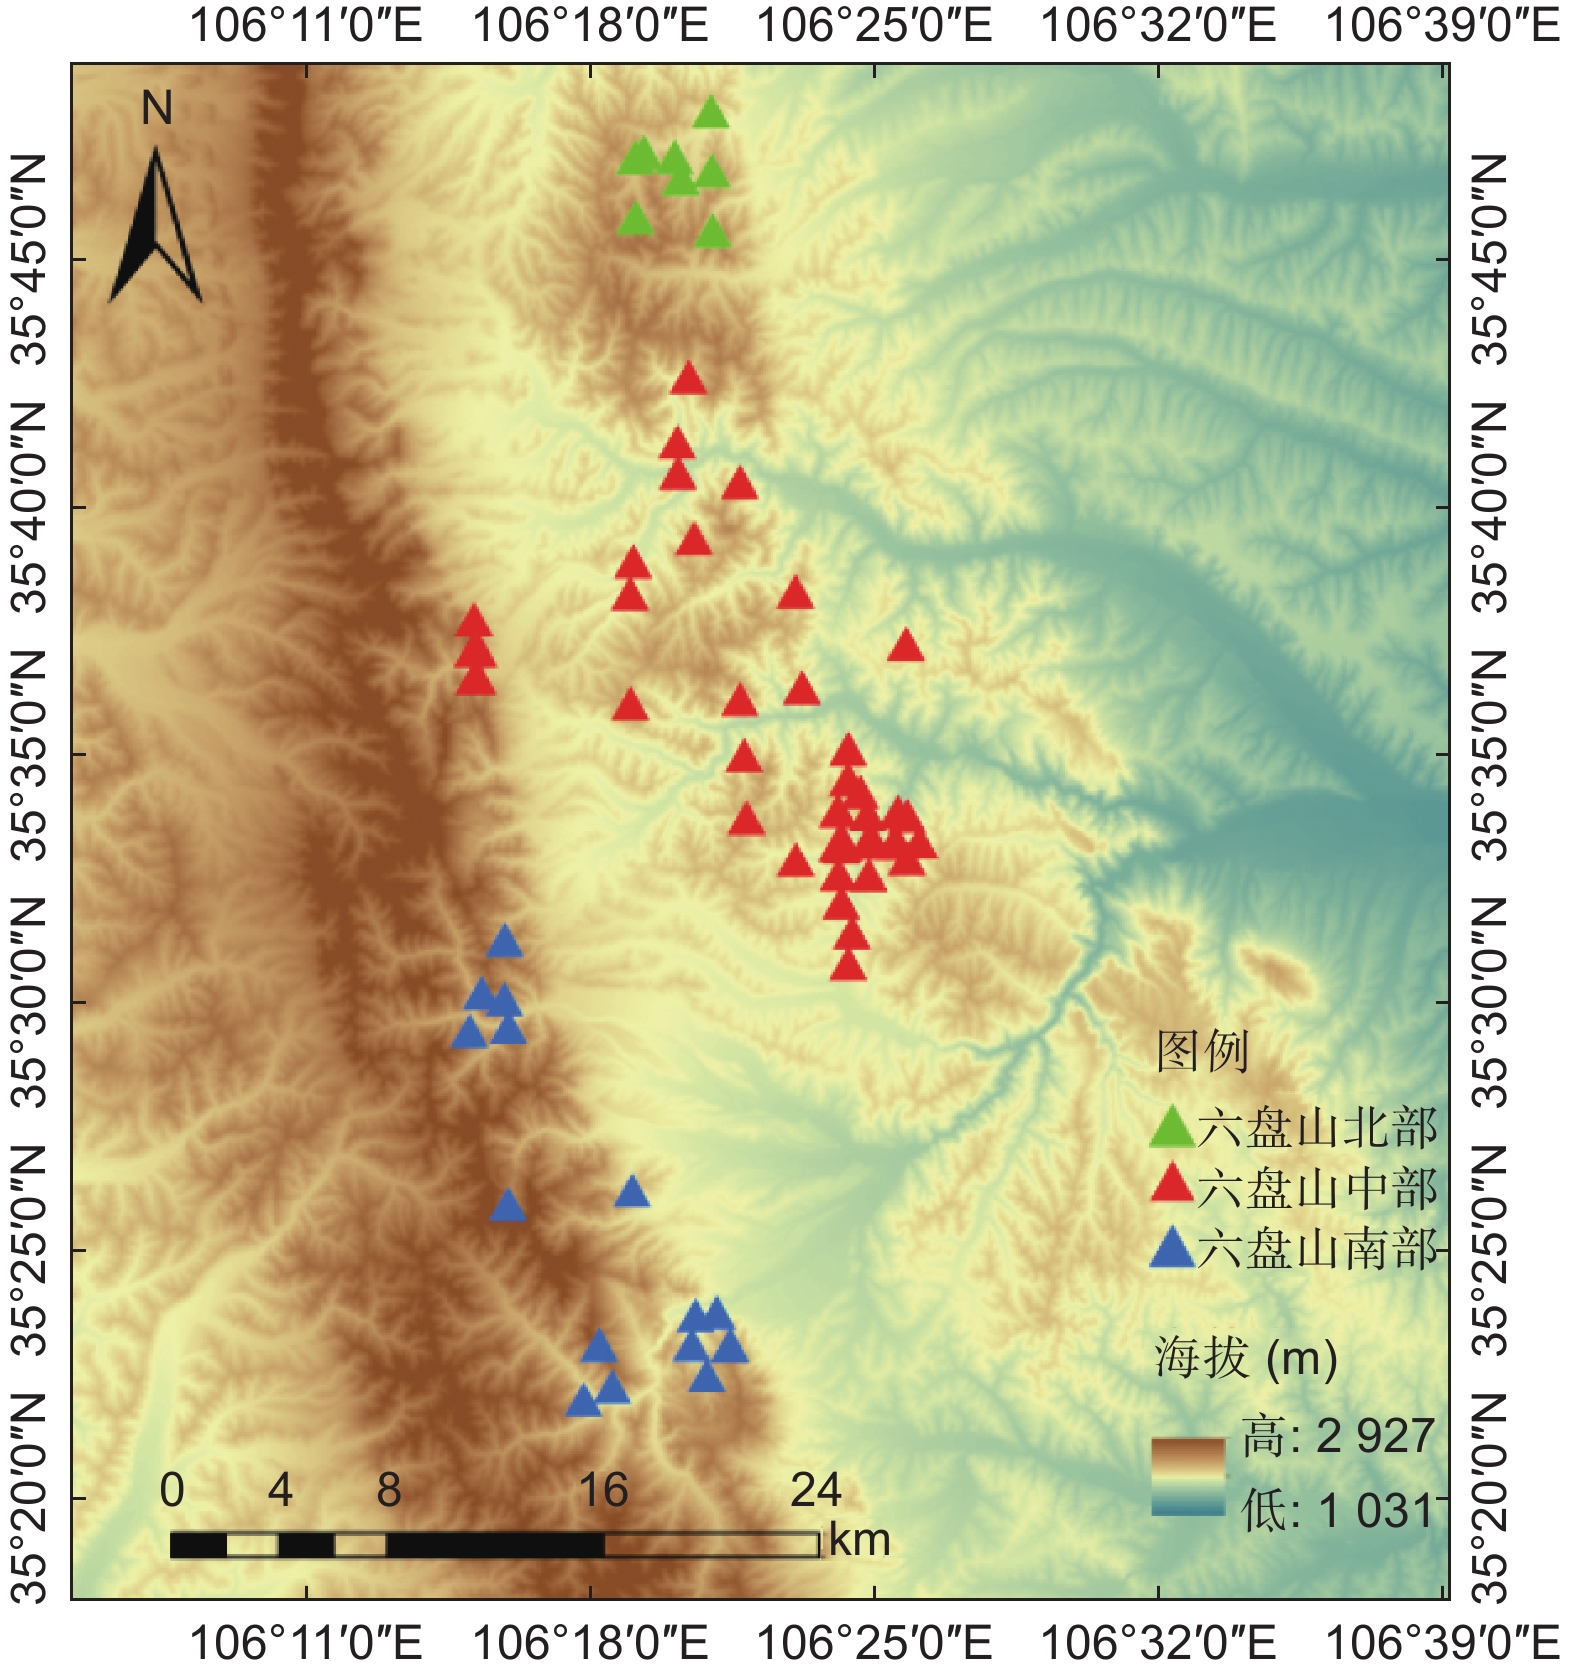
本研究所用样地共70个,包括2015年的24个25.82 m × 25.82 m的国家森林资源清查固定样地、2021年作者调查的15个30 m × 30 m的森林生态水文研究固定样地、2022年作者面上调查的31个20 m × 20 m的临时样地。为尽可能真实反映六盘山区辽东栎林生长情况,将六盘山辽东栎林分布区按年均降水量分为500~600(北部)、600~700(中部)、>700 mm(南部),按坡向分为阴坡、半阴坡、半阳坡,按海拔划分为1 800~1 950、1 950~2 100、2 100~2 250、>2 250 m等区间,样地尽可能均匀分布在这些环境条件区间的组合类型中(见图1)。调查样地基本都为辽东栎纯林,仅有少量白桦、山杨和椴树混生,其株数占比不足8%。
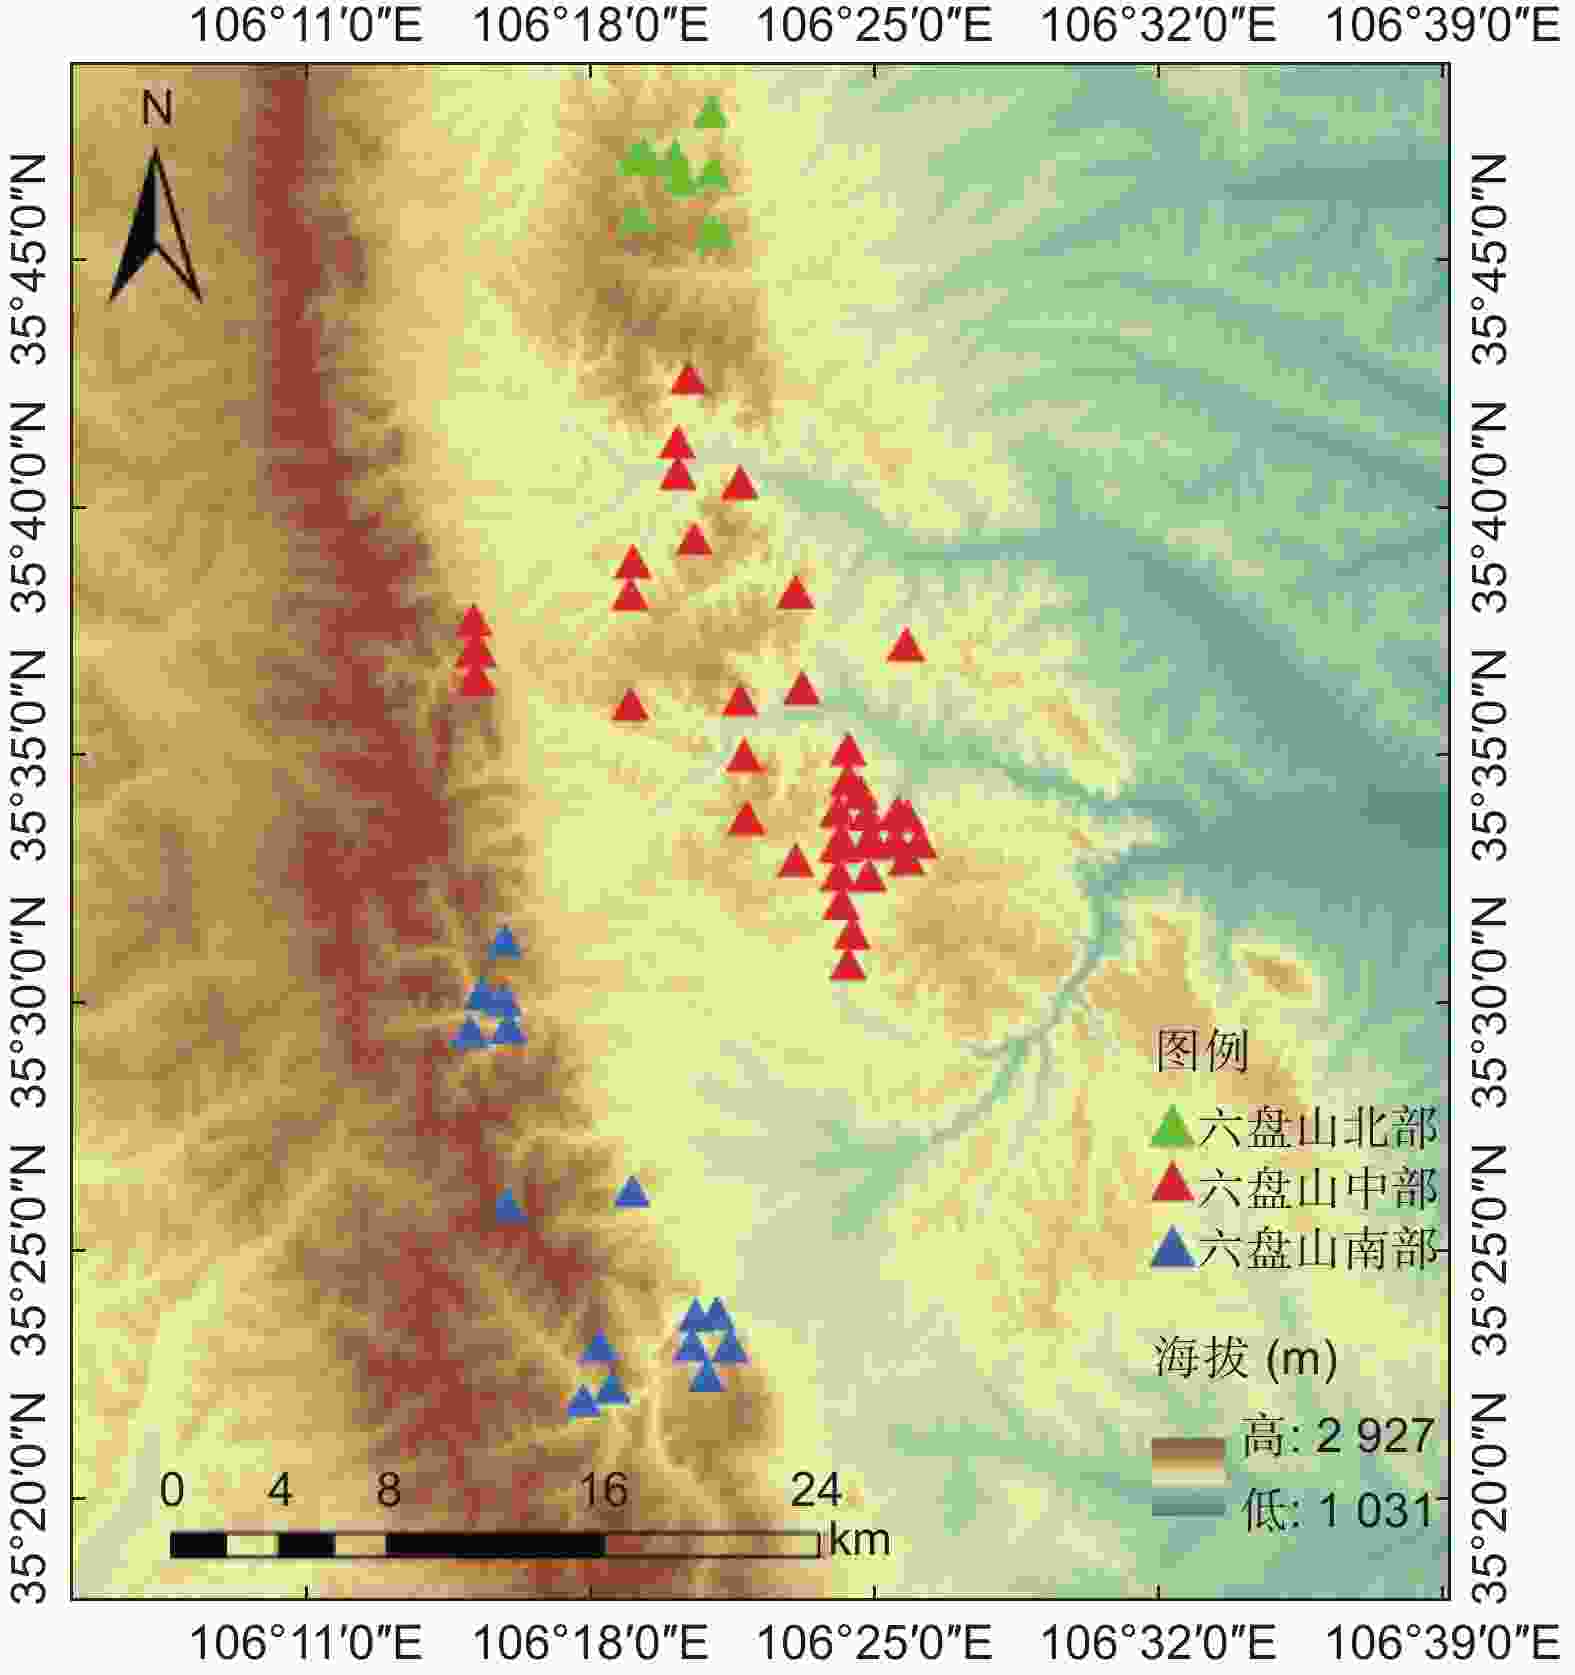
Figure 1. Sample plots layout of Quercus wutaishanica forest stands in Liupan Mountains Area of Ningxia
对样地内所有乔木进行每木检尺,并记录样地基本信息;同时沿样地对角线布设3个面积5 m × 5 m的灌木典型样方,调查样方内胸径<5 cm的乔木幼苗和灌木的种类、数量、高度、地径(距地面10 cm处的直径)、冠幅、覆盖度等;并在样地四角及中间设置5个面积1 m × 1 m的草本典型样方,调查草的种类、数量、平均高度、多度等,同时在每个草本样方内布设面积30 cm × 30 cm的枯落物典型样方,即每个样地内有5个枯落物样方,调查枯落物层厚度和生物量等。
-
对每个样地,分乔木层、林下植物层(灌木层、草本层)、枯落物层计算其生物量,用于后续分析。
-
在计算辽东栎及少量白桦、椴树的单株生物量时,应用在六盘山区基于解析木调查建立的单株生物量方程[12];对出现很少的山杨,其单株生物量计算采用在七老图岭山建立的方程[13](表1)。将样地内所有单株乔木生物量求和,并依样地面积求得乔木层生物量(式1)。
树种
Tree species拟合方程
Fitting equations方程来源
Equation source辽东栎 Quercus wutaishanica B=0.732 0(D) 1.968 1 文献[12] 白桦 Betula platyphylla B=0.668 4(D) 1.965 6 少脉椴 Tilia paucicostata B=0.291 6(D) 2.146 8 山杨Populus tremula B=0.262 4(D) 2.215 0 文献[13] 注:B为乔木单株整体生物量(kg·株−1),D为乔木单株胸径(cm)。
Note: B is the overall biomass of a single tree (kg·tree−1), and D is the diameter at breath height (cm) of single tree.Table 1. The relations of single tree biomass of Quercus wutaishanica secondary forest
式中:
$ {W}_{\mathrm{乔}} $ 为样地乔木层生物量(t∙hm−2),$ {W}_{\mathrm{乔}i} $ 为样地内第i株乔木生物量(t∙hm−2),$ {S}_{\mathrm{乔}} $ 为样地面积(hm2),n为样地内乔木株数。 -
不同灌木种的生物量方程差异较大。因此,作者构建了本区域辽东栎林下6种主要灌木的单株生物量方程。在2021年8月进行灌木调查时,将全部样地中的植株根据高(H)和地径(D),分为3级,每级标准木选3~6株,最后共选择绣球绣线菊16株、山楂8株、北京忍冬8株、水荀子6株、榛15株、桦叶荚蒾14株。采用收获法测定单株生物量,将样株在离地面5 cm左右处锯断,将干、枝、叶(含花、果)分离,再将树根尽可能全部挖出,全部带回室内置于70 ℃烘箱中烘干48 h达到恒质量后,对每种灌木样株的各器官分别称取干质量。利用这些数据,建立了6种灌木的单株生物量与地径的回归方程(表2),用于计算林下灌木生物量。对样地内其它灌木种类,其单株生物量计算采用已发表的六盘山区混合灌木生物量模型[14]。将各样地的3个灌木样方内的所有灌木单株生物量求和并依据样方总面积求得该样地的灌木层生物量(式2)。
灌木种类
Shrub species拟合方程
Fitted equations决定系数
R2方程来源
Equation source绣球绣线菊(Spiraea blumei) B=0.498(D)1.653 2 0.925 8 依据本研究的灌木生物量调查数据建立 山楂(Crataegus pinnatifida) B=0.104 6D2−0.045 1D + 0.030 9 0.981 5 北京忍冬(Lonicera elisae) B=0.075 6(D)1.257 0.832 0 水荀子(Cotoneaster multiflora) B=0.062 2(D)1.693 9 0.982 8 榛(Corylus heterophylla) B=0.045 2(D)1.743 0.907 7 桦叶荚蒾(Viburnum betulifolium) B=−0.000 6D2 + 0.176 3D−0.116 1 0.908 7 其它灌木Other shrub species B地上=1.890 7ln D−2.496 2 0.862 1 文献[14] B根=0.896 6 lnD−2.263 3 0.568 5 注:B为灌木单株生物量(kg·株−1);D为灌木地径(cm)。
Note: B is the overall biomass of a single shrub (kg·plant−1), and D is the ground diameter (cm) of single shrub plant.Table 2. The relations of single plant biomass of main shrub species in Quercus wutaishanica
式中:
$ {W}_{\mathrm{灌}} $ 为样地灌木层生物量(t∙hm−2),$ {W}_{\mathrm{灌}-\mathrm{单}} $ 为灌木样方内第i 株生物量(t∙hm−2),$ {S}_{\mathrm{灌}} $ 为灌木样方面积(hm2),n为各样方内灌木株数。 -
由于辽东栎林下草本种类繁多,测定草本生物量时未分种类,而是采用全部收获法。在2021年8月,对15个辽东栎林样地内的75个1 m × 1 m草本样方,将草本植株全部收获,包括地上和地下部分,实测鲜质量后带回实验室在70 ℃烘箱中烘24 h后称取干质量,选用幂函数建立了草本总干质量(包括地上和地下生物量)与地上鲜质量的回归关系(式3),用于计算2022年31个样地内各样方草本总干质量。将各样地内5个草本样方的生物量求和并根据样方总面积计算各样地的草本层生物量(式4)。基于2021和2022年草本的调查数据,选用指数函数建立了草本层生物量与各样方草本平均高度和盖度的回归关系(式5),用于计算2015年24个样地内草本层生物量。
式中:
$ {W}_{\mathrm{草}-\mathrm{样}\mathrm{方}} $ 、$ {W}_{\mathrm{地}\mathrm{上}-\mathrm{鲜}} $ 和$ {W}_{\mathrm{草}} $ 分别表示样方内的草本总干质量(kg)、地上鲜质量(kg)和样地的草本层生物量(t∙hm−2),$ {S}_{\mathrm{草}} $ 为草本样方面积(hm2),$ {C}_{\mathrm{草}} $ 为样方草本盖度(%),$ {H}_{\mathrm{草}} $ 为样方内草本平均高度(cm),1 000为生物量单位转换系数。因调查样地内草本生物量较低,将其和灌木层合并,称为林下植物层生物量(
$ {W}_{\mathrm{林}\mathrm{下}} $ ,t∙hm−2)(式6)。 -
将30 cm × 30 cm样方内枯落物全部收集,带回实验室在75 ℃烘箱内烘24 h后称干质量,计算各样地内5个枯落物样方的生物量平均值,并依样方总面积计算各样地的枯落物层生物量(式7),然后建立其与枯落物层厚度的统计关系,用于估算枯落物层生物量(式8)。
式中:
$ {W}_{\mathrm{枯}} $ 为样地枯落物层生物量(t∙hm−2),$ {W}_{\mathrm{枯}-\mathrm{样}\mathrm{方}} $ 为某样方内枯落物干质量(kg),$ {S}_{\mathrm{枯}} $ 为枯落物样方面积(hm2),$ T $ 为枯落物层厚度(cm),1 000为生物量单位转换系数。 -
由于林分生长指标在野外同时受多因子的复杂影响,很难区分出各单一因子的影响。因此,使用可在一定范围内排除其它因子影响的上外包线法,分析单因子作用[15]。具体做法是:将各因变量Y对应各单一自变量因子X的数据绘成散点图,根据自变量变化范围将其分成若干区段,在每段内选取高于全体数值平均值一倍偏差的数据点[16],或在一些数据密度较低的区段中直接选择最高值的数据,用这些被选取的数据点拟合因变量对单因子的响应关系式,确定响应函数类型,并能在一定程度上定量表征响应关系。
利用Microsoft Excel 2016对六盘山各分区的辽东栎林样地的生长及生境指标求取算术平均值;对各样地生物量总和统计后利用Origin 2019进行非线性回归分析及制图。
-
六盘山区辽东栎林主要生长在海拔1 789~2 420 m的阴坡和半阴坡,少量在半阳坡,阳坡几乎没有。从南到北的样地立地特征存在差异(表3),如年降水量减少,土层厚度降低;平均林龄为38~45 a,各分区差异不大。样地的平均胸径、树高、郁闭度都是从南向北表现为降低,林分密度表现为增加。
项目
Item六盘山南部
South of Liupan
Mountains六盘山中部
Middle of Liupan
Mountains六盘山北部
North of Liupan
Mountains海拔 Altitude/m 1 960~2 280 1 789~2 420 2 030~2 260 土层厚度 Soil thickness/cm 78 ± 24 64 ± 20 58 ± 12 坡度 Slope gradient/(°) 34 ± 7 30 ± 8 37 ± 2 林分密度 Tree density/(株∙hm−2) 1 037 ± 494 1 055 ± 337 1 314 ± 388 郁闭度 Canopy density 0.71 ± 0.12 0.68 ± 0.15 0.57 ± 0.08 林龄 Stand age/a 38 ± 17 45 ± 10 38 ± 4 平均树高 Average tree height/m 12.3 ± 3.8 8.2 ± 2.7 6.6 ± 0.8 平均胸径 Average DBH/cm 17.3 ± 4.9 13.3 ± 3.8 11.4 ± 1.7 Table 3. Site and structure characteristics of the Quercus wutaishanica stand plots in different sub-regions
-
六盘山区辽东栎林的生物量为乔木层>枯落物层>灌木层>草本层(表4),所有样地的各层生物量占比分别为86.92%、10.85%、1.77%、0.46%。生物量存在空间差异,总生物量为南部最高(234.89 ± 94.16 t∙hm−2),分别是中部和北部的1.6倍和2.1倍;乔木层和枯落物层生物量也是南部>中部>北部;但林下植物层生物量为中部最高(4.15 ± 3.00)t∙hm−2,分别是北部的1.14倍和南部的1.51倍。
植物层
Plant layers六盘山南部
South of Liupan
Mountains六盘山中部
Middle of Liupan
Mountains六盘山北部
North of Liupan
Mountains平均值
Average乔木层 Overstory tree layer 209.28 ± 92.21 124.50 ± 61.39 94.59 ± 64.73 146.39 ± 79.67 林下植物层 Understory plant layer 2.75 ± 1.35 4.15 ± 3.00 3.65 ± 2.00 3.76 ± 2.67 灌木层 Shrub layer 2.44 ± 1.36 3.11 ± 2.32 3.28 ± 1.95 2.98 ± 2.11 草本层 Herb layer 0.31 ± 0.31 1.04 ± 2.22 0.37 ± 0.32 0.78 ± 1.84 枯落物层 Humus layer 22.86 ± 6.45 16.70 ± 7.74 15.70 ± 3.52 18.27 ± 7.67 总生物量 Total biomass 234.89 ± 94.16 145.35 ± 64.05 113.94 ± 68.06 168.42 ± 82.79 Table 4. The biomass of different layers of Quercus wutaishanica forests in different sub-regions t∙hm−2
-
由图2中的外包线可知,乔木层生物量随林分密度增加先快速增加,在密度达1 050 株∙hm−2(对应上外包线乔木层生物量296.9 t∙hm−2)后增加逐渐变缓并趋平稳(图2a);随郁闭度增加呈“S”型增长模式,郁闭度为0.4以下时缓慢增长,0.4~0.75(对应上外包线乔木层生物量292.3 t∙hm−2)时快速增加,0.75之后增加趋缓(图2b)。
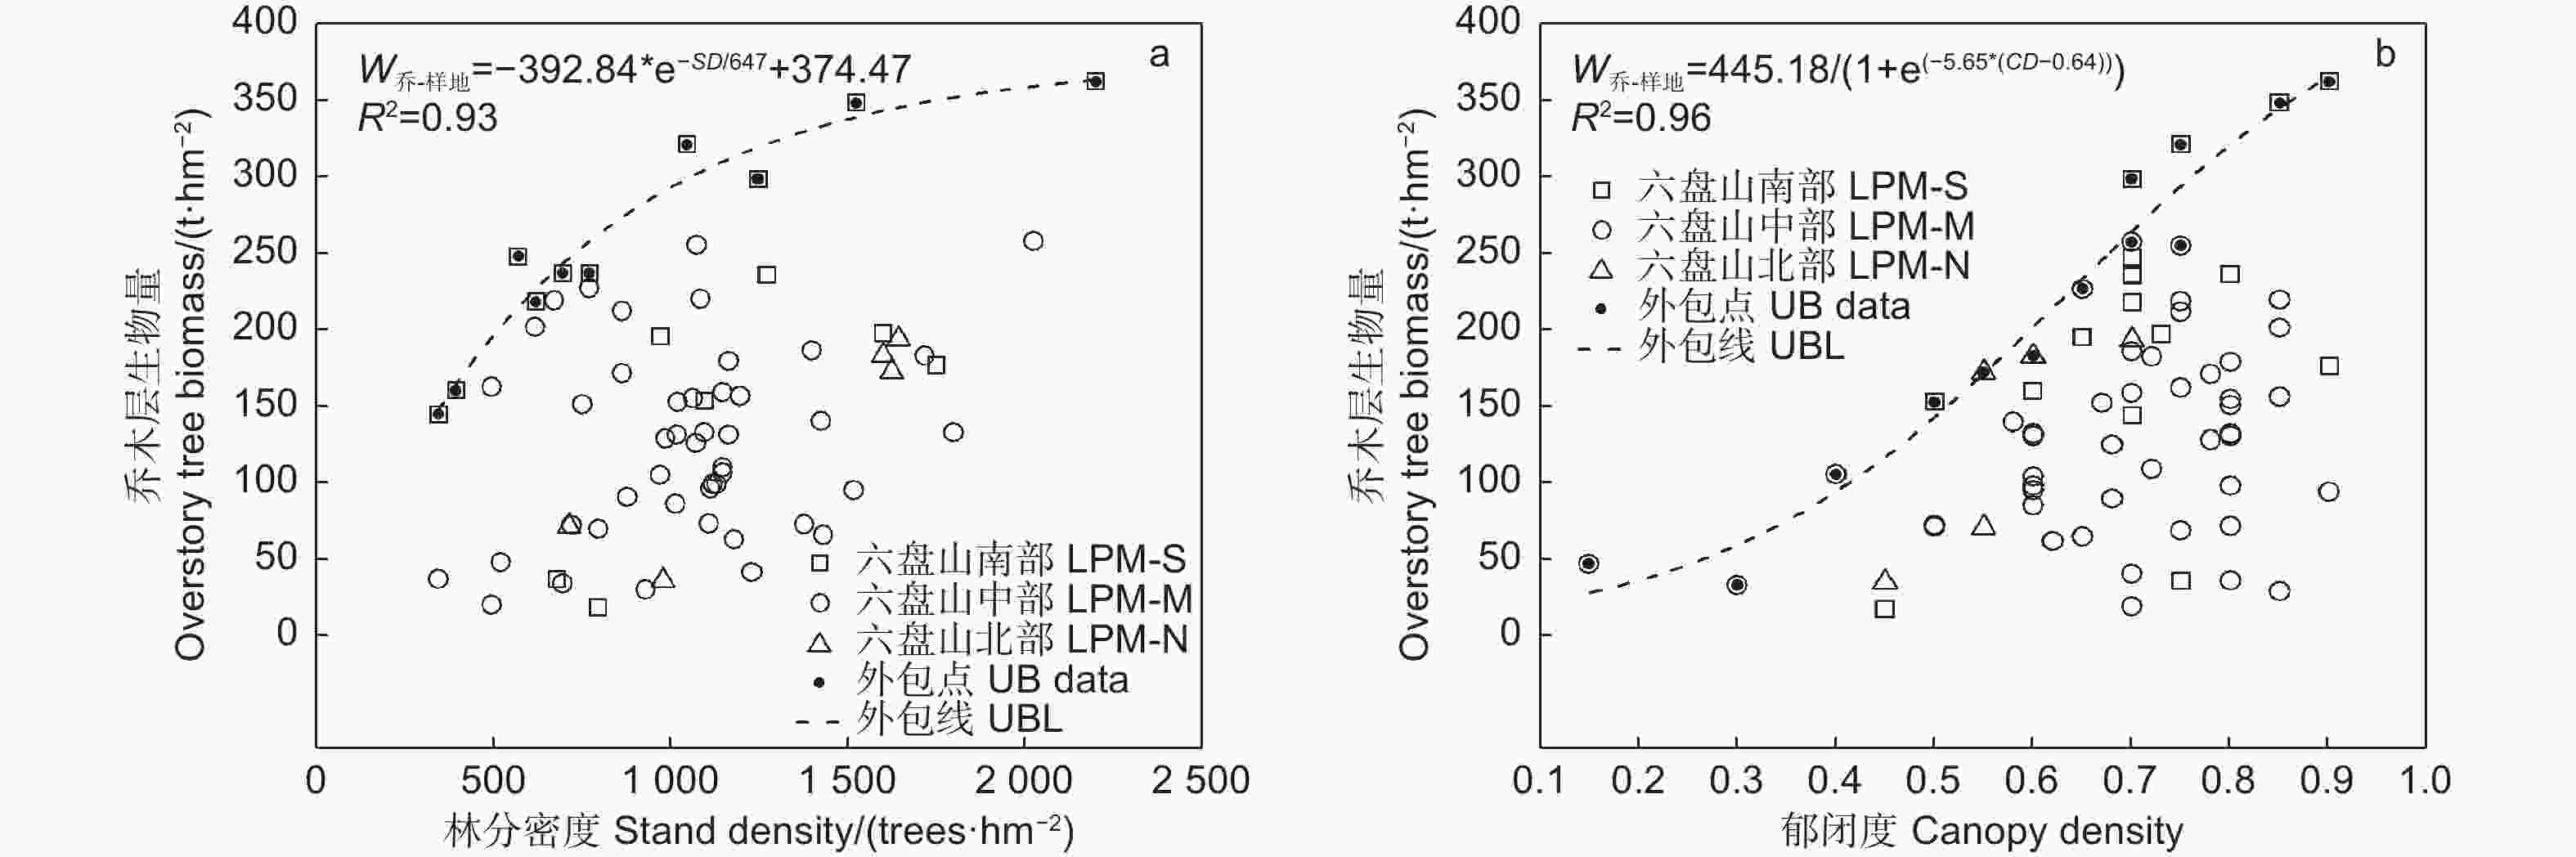
Figure 2. Variation of overstory tree biomass of Quercus wutaishanica forests with stand structure
-
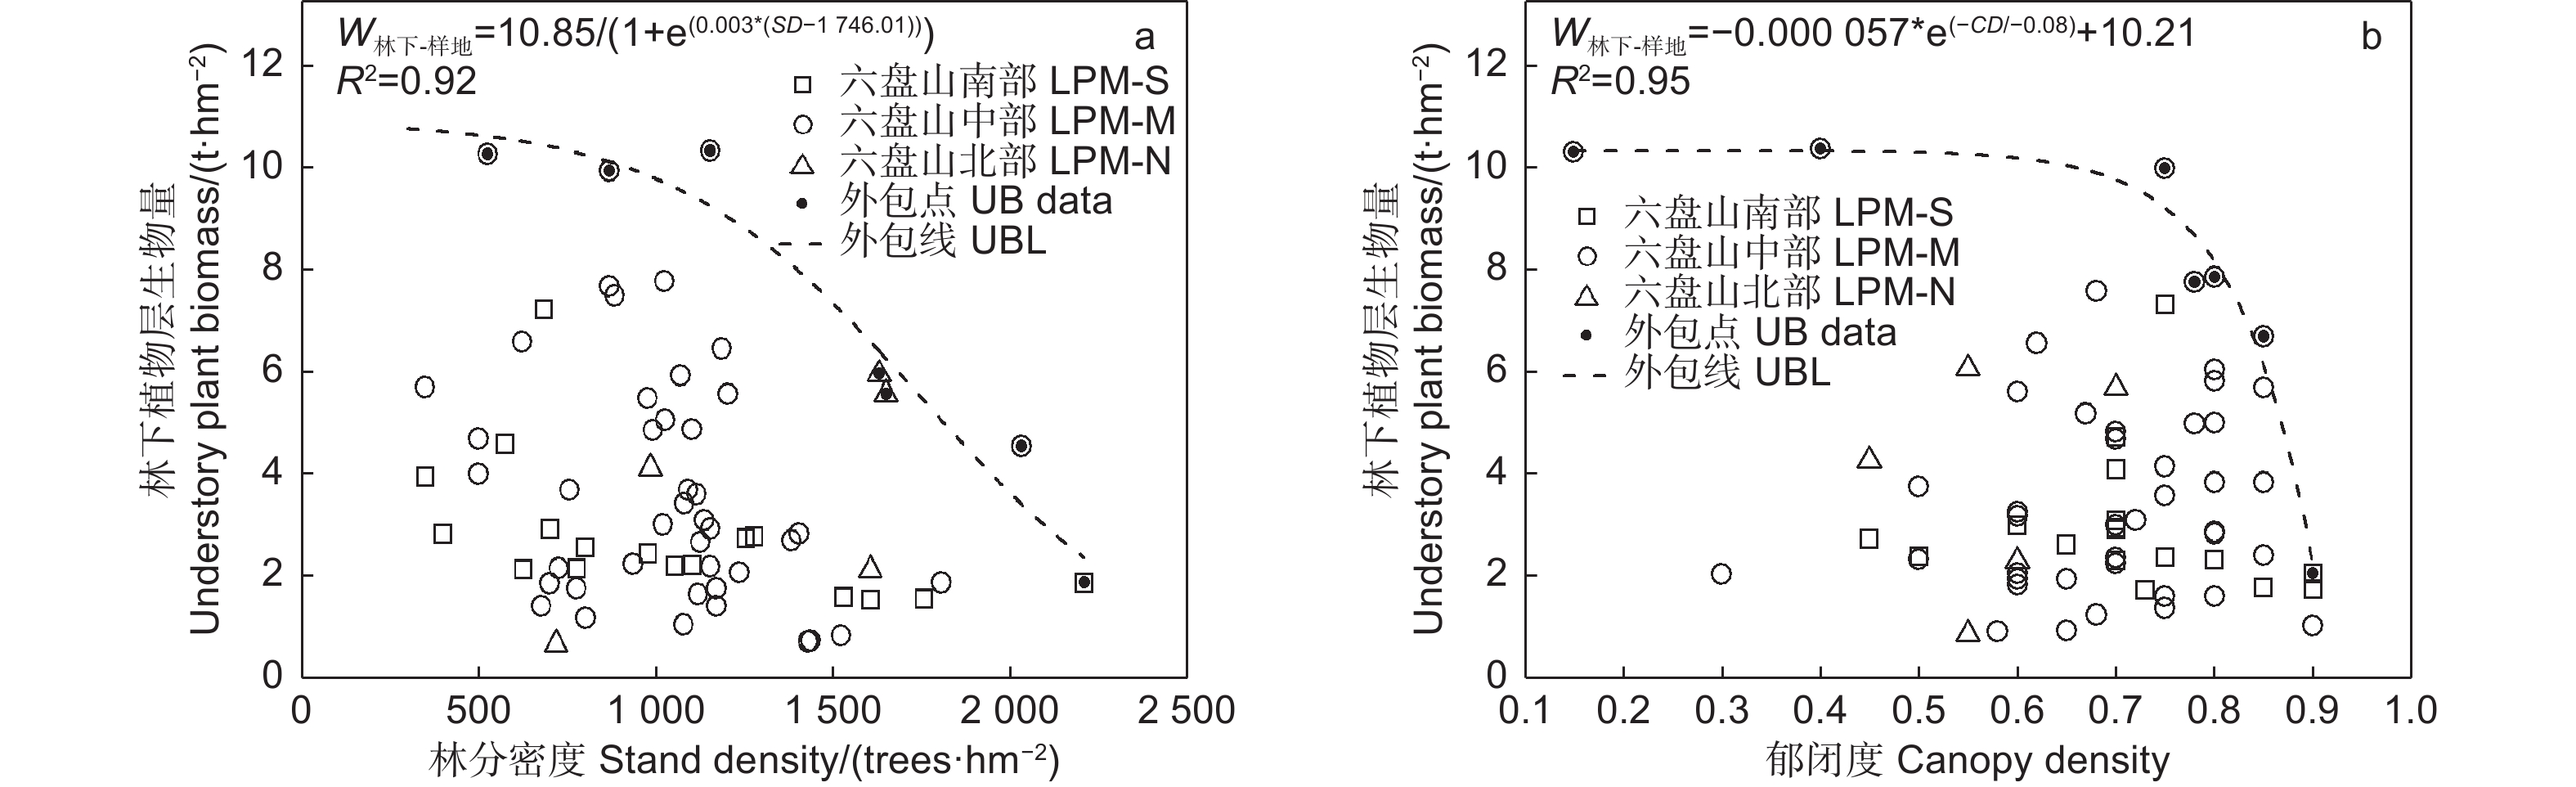
由图3中的外包线可知,林下植物层生物量随林分密度和郁闭度增加均呈先平稳后加速下降的变化,但响应密度的降低起点更早、降低速度更缓。林下植物层生物量在密度达到1 150株∙hm−2和郁闭度达到0.75(分别对应上外包线的林下植物层生物量9.17、9.08 t∙hm−2)之前保持平稳,之后快速下降并最终趋于零。
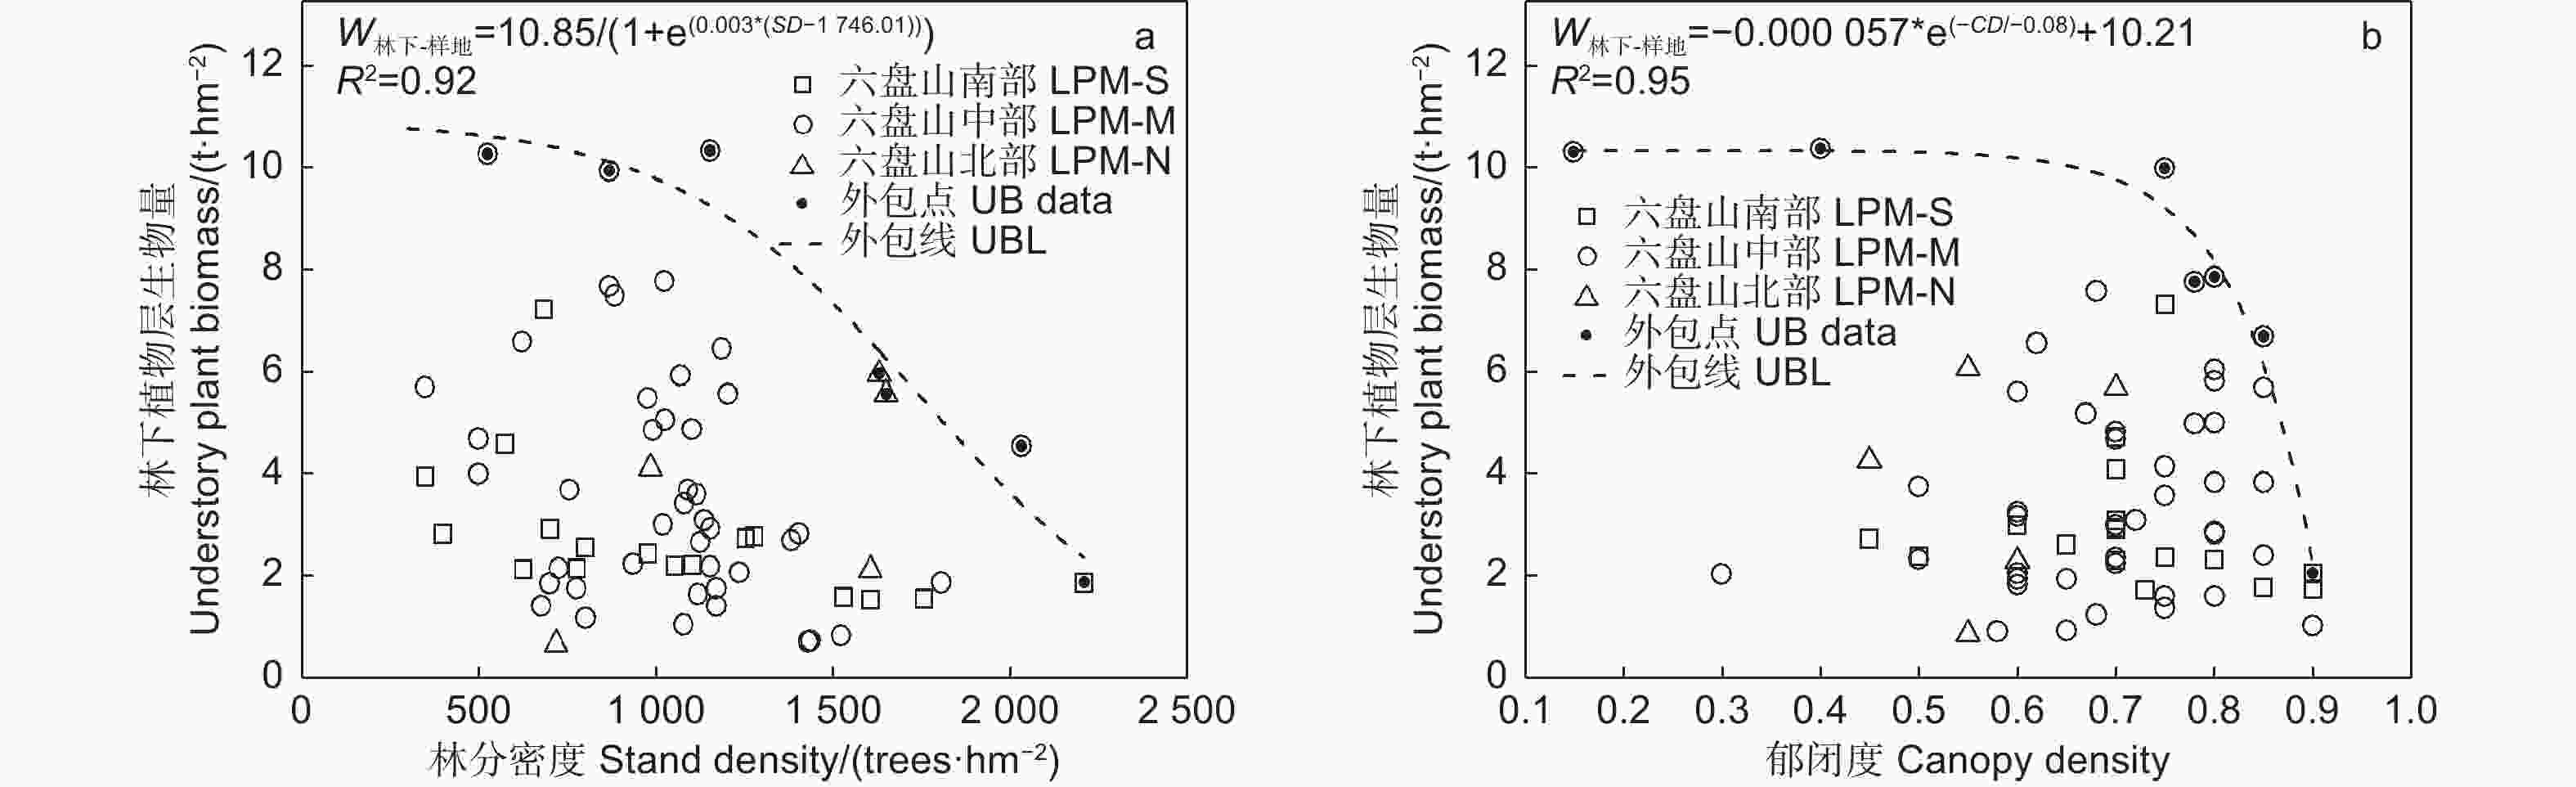
Figure 3. Variation of understory plant biomass of Quercus wutaishanica forests with stand structure
-
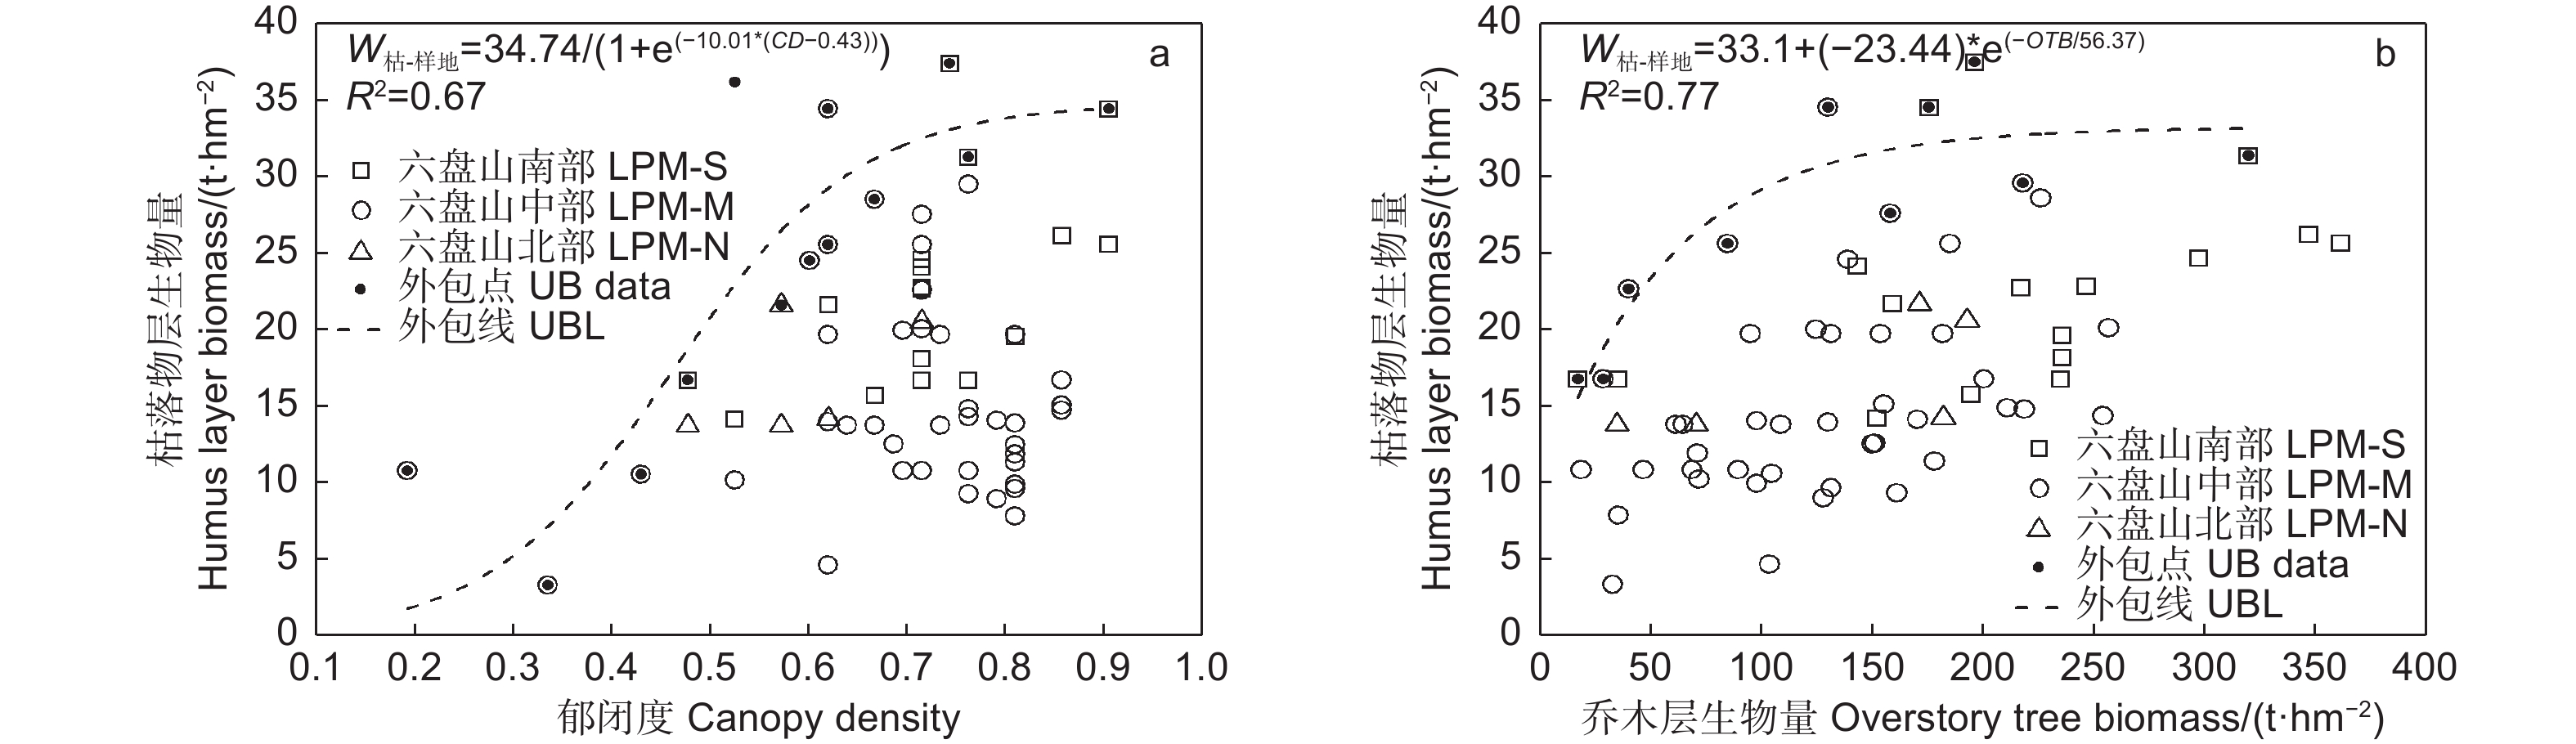
图4中的上外包线表明,枯落物层生物量随郁闭度增加呈“S”型增长,在郁闭度为0.3(对应上外包线枯落物层生物量7.23 t∙hm−2)以前增长缓慢,在0.3~0.7之间快速增长,之后增速变缓并趋平稳,在郁闭度0.75和0.90时分别对应33.34和34.41 t∙hm−2(图4a);枯落物层生物量随乔木层生物量增加表现为先快速增加,在乔木层生物量为130 t∙hm−2后增加变缓并趋平稳(图4b)。
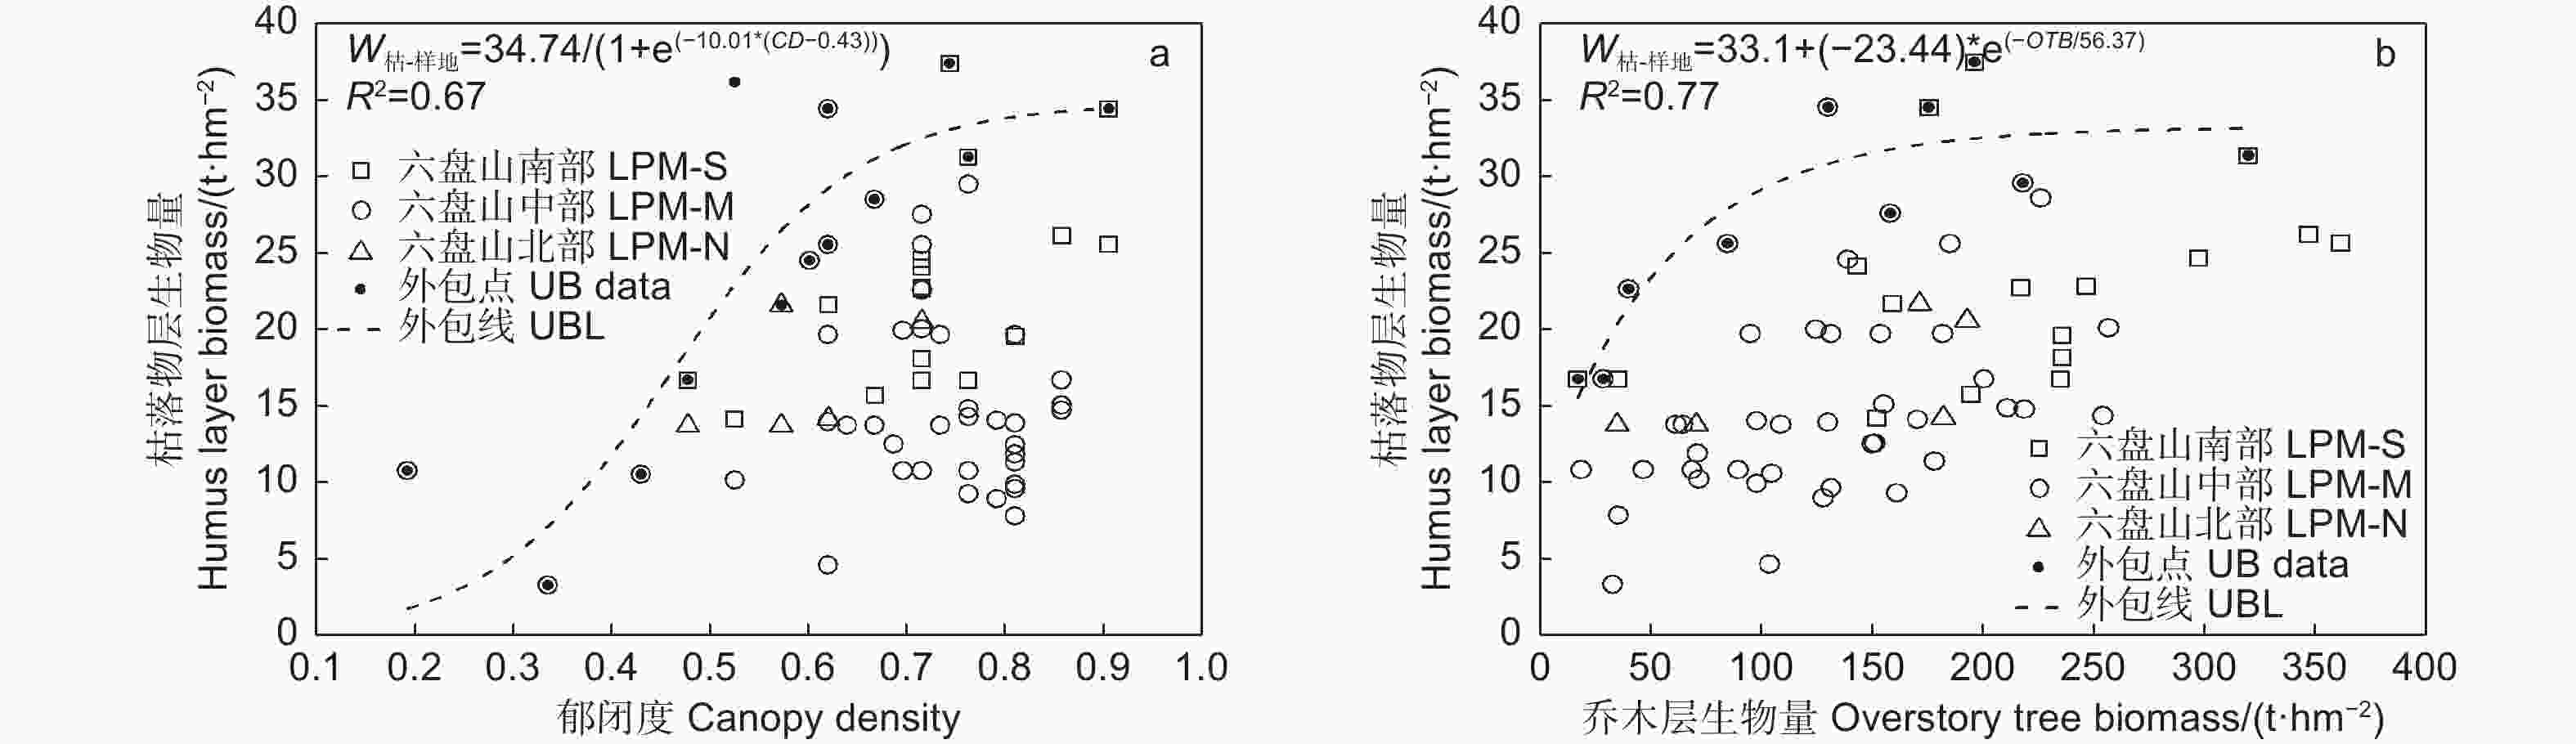
Figure 4. Variation of little layer biomass of Quercus wutaishanica forests with stand structure
-
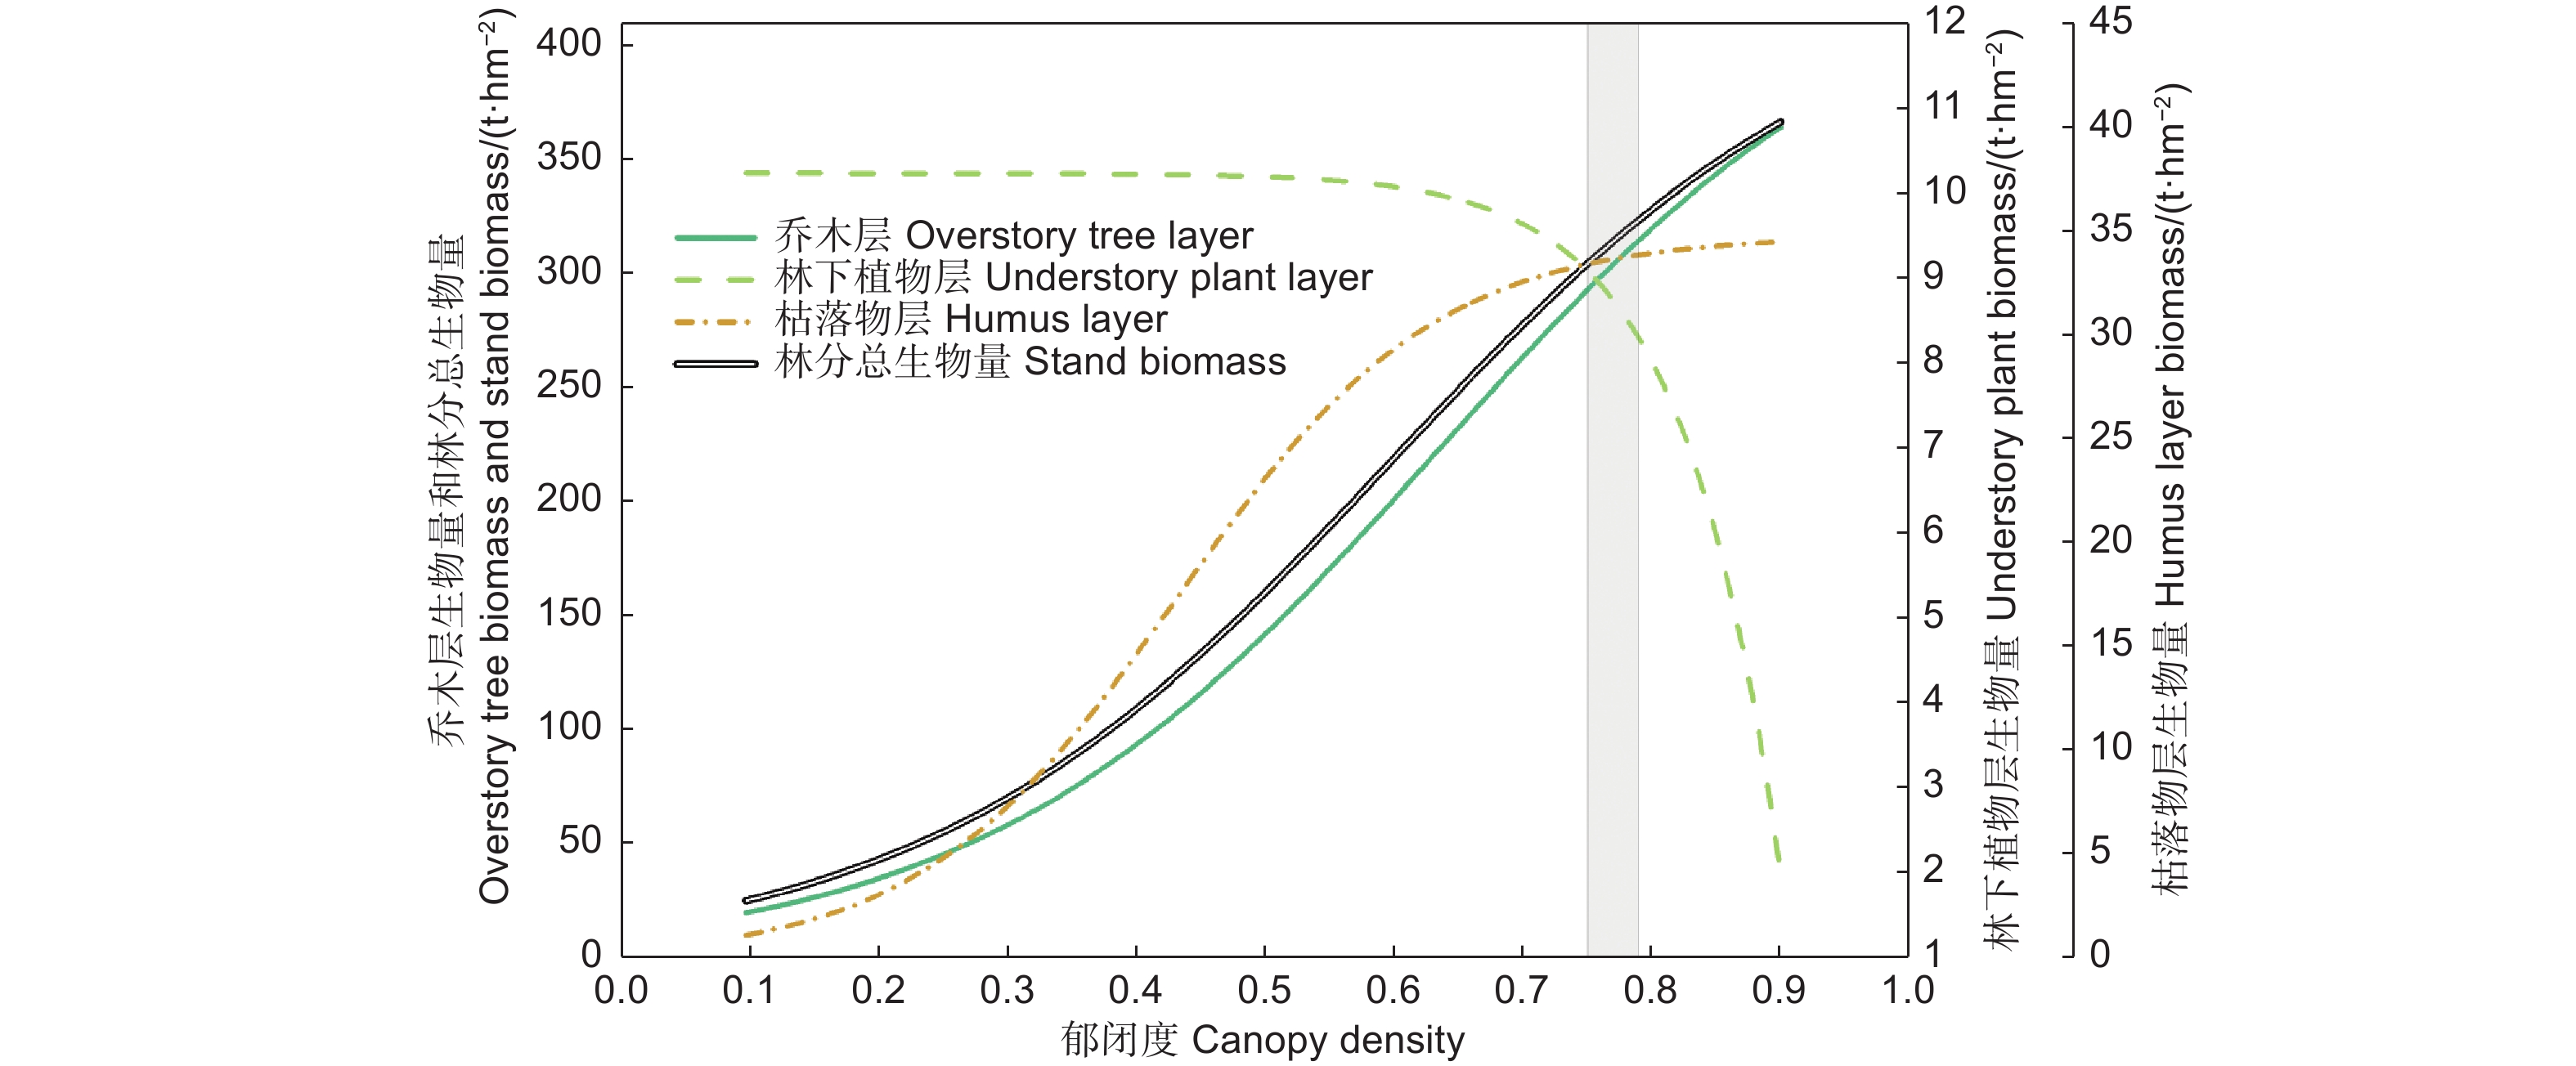
因为林冠郁闭度比其他林分结构对光照的影响更直接,而且生产应用上也容易估计和获取。因此,在图5中,汇总和对比了林分各层生物量随郁闭度的变化,以理解它们的权衡或协同关系。
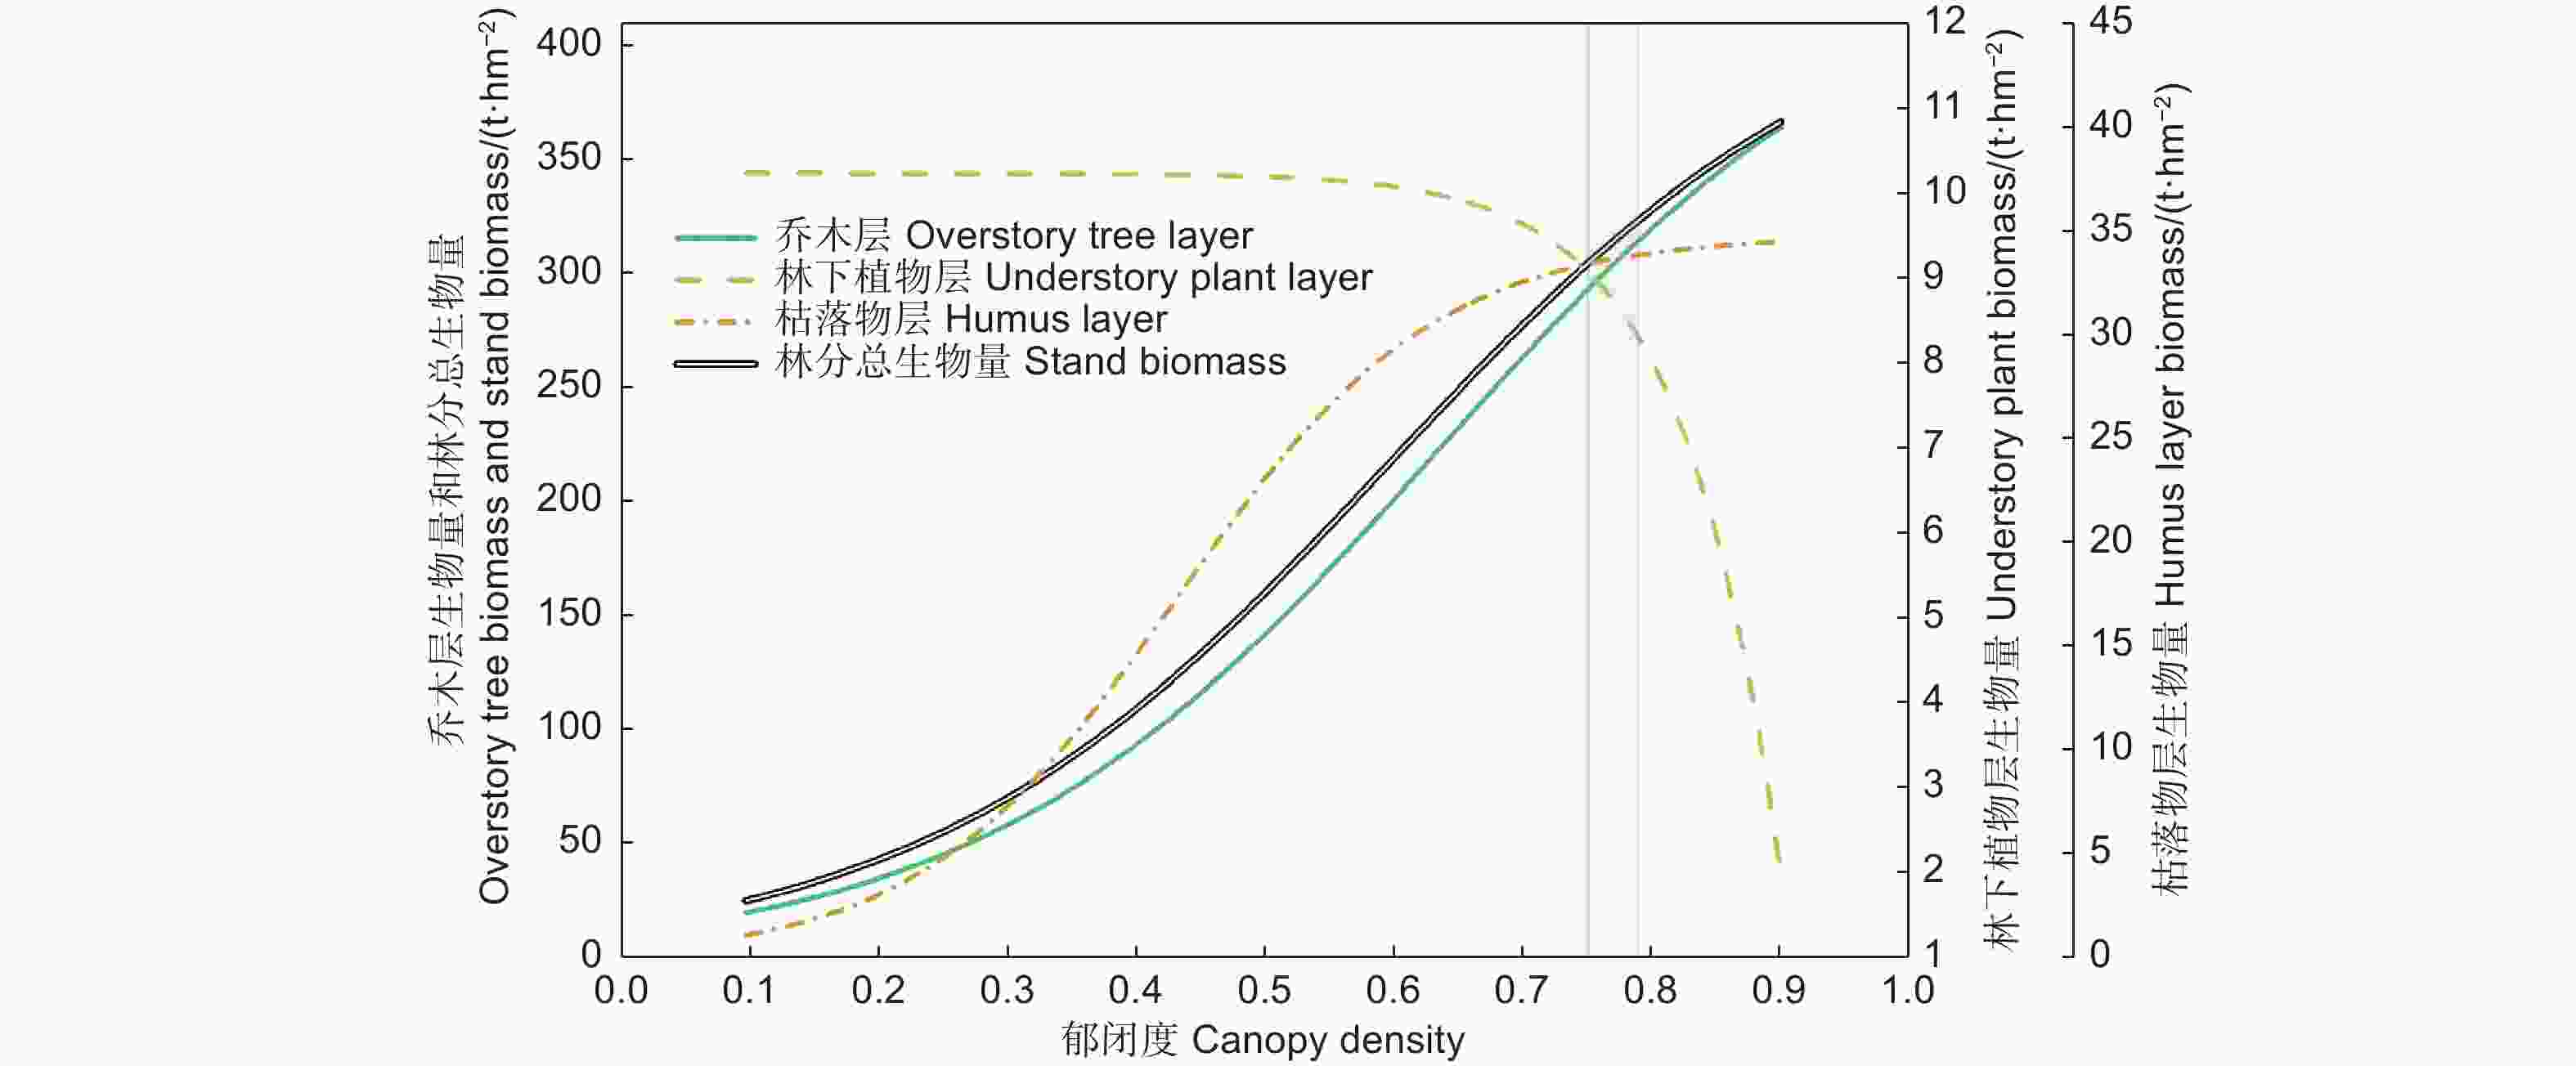
Figure 5. Variation of the biomass components of overstory tree layer, understory plant layer, litter layer and stand of Quercus wutaishanica forests with rising canopy density (based on the upper boundary line response of each component to canopy density)
辽东栎林各层生物量及其相互关系存在最佳郁闭度范围。在郁闭度0.75以前,林下植物层生物量基本稳定不变,受乔木层和枯落物层生物量的增加影响很小。在郁闭度高于0.75以后,林下植物层生物量的减少与乔木层、枯落物层生物量的继续增加呈越来越明显的竞争关系。若将郁闭度维持在0.75~0.79的范围,可使辽东栎林各层生物量均维持在较高水平。此时乔木层、林下植物层、枯落物层生物量在上外包线上分别为292.3~314.1、8.29~9.08、33.34~33.78 t∙hm−2,都在其上外包线的最大值的80%以上,分别为80%~86%、81%~89%、97%~98%,这时林分总生物量的上外包线数值为334.72~356.17 t∙hm−2,为最大预测值的84%~89%。若郁闭度进一步增加,虽然会使乔木层和枯落物层生物量继续缓慢增加,但林下植物层生物量迅速下降,郁闭度0.9时降到1.98 t∙hm−2,仅为上外包线最大值的20%。因此,可确定郁闭度最优范围是0.75~0.79,这能使辽东栎林各层生物量均维持在较高水平。
-
本研究中辽东栎林的乔木层生物量随林分密度和郁闭度增加而升高,但达到一定阈值后升高趋缓或趋于平稳,这是因为在低于密度和郁闭度阈值时树木个体遭受的光照、水分、养分等竞争较小,树木密度增加带来了乔木层生物量增加;但超过阈值后对单株树木生长的竞争影响越来越大,使降低树木个体生长和生物量的作用越来越接近增加林木密度提高乔木层生物量的作用,从而乔木层生物量逐渐趋于稳定,这与李玲燕[17]的研究结果一致。
以往相关研究都是利用林冠郁闭度预测植物尤其林下植物生物量[18-19];郁闭度通常与树木大小和密度共同导致的冠层生物量密切相关,有必要降低过密林分的密度,以增加林下光照促进林下植物生长[20]。本研究中,林分密度和郁闭度低于某阈值时对林下植物的限制作用相对降低,这是因为林下灌草可通过植物种类变化(增加耐荫性)来适应林下环境(尤其光照)变化[21],从而使林下植物生物量维持相对稳定;当超过阈值后,过高的林分密度和郁闭度使林下光照降低,使耐荫植物生长也受限制,从而使林下植物生物量加速降低[22],甚至限制林下植物生长发育以及灌草的丰富度[23]。
本研究中,辽东栎林枯落物层生物量随乔木层生物量和郁闭度增加而增大。这是因枯落物输入大部分源于乔木层枯枝落叶,密度增大导致的乔木层生物量增加必然导致枯落物输入量增加;只是枯落物层生物量随乔木层生物量增大的升高速度逐渐变缓,这是因一小部分枯落物输入来源于死亡的林下植物,而且枯落物层生物量还受枯落物分解速率影响,当乔木层生物量很大导致郁闭度过高时,源于林下植物的枯落物输入量会变小[24],而且高度郁闭的林下阴湿环境利于枯落物分解[25],从而使枯落物层生物量增速变缓,这与郭耆等[26]的研究结果一致。
-
郁闭度是个重要的林分和林冠结构指标,它与林龄和林木密度的相关性较弱,且年内变化可忽略,容易估测得到,所以有重要的生态学和林学意义[27]。郁闭度影响着林内的光照、水分、温度等条件,对林下植物生长发育、林下树木更新、枯落物层生物量动态等都有重要影响[28],是指导森林结构调控和多功能管理的实用林分结构指标。
一般来说,具有乔灌草复层结构的森林的稳定性和多功能性更高,因此需确定最佳郁闭度,以便同时维持乔木层、林下植物层和枯落物层的较高生物量[29-30]。本研究表明,六盘山区辽东栎林能维持各层生物量均衡的最优郁闭度范围是0.75~0.79,这时各层生物量均处于较高水平。这个郁闭度范围稍高于对陕西黄龙山林区建议的适宜郁闭度(0.7)[31],原因可能是黄龙山的年降水量(611.8 mm)以及海拔较低(962.6~1 783.5 m)和气温(8.6 ℃)较高导致蒸散较强使得树木可利用水分低于六盘山区。类似研究结果在一些其它树种森林的研究中也得到证实[32],如对同属六盘山区的华北落叶松人工林,若维持最佳郁闭度0.7(对应中龄林的林分密度1 100~1 500 株∙hm−2),可同时保持较高的乔木层、林下植物层、枯落物层和土壤层碳密度[33-34]。
-
在本研究中,权衡确定最佳郁闭度时,把乔木层、林下植物层、枯落物层的生物量视为同等重要。但是,如需给予各层次生物量不同权重时,就需确定各层生物量要求的最佳郁闭度的加权平均值,这时的森林多功能管理会更适合一些特殊要求。本研究的另一个不足是,有关研究基于观测数据的外包线,没有考虑林龄的影响,也没给出依据最佳郁闭度计算不同林龄的对应密度的经验公式,需在未来继续积累数据后深入开展这些研究,从而能计算确定不同林龄时的多功能管理最佳密度。再则,本研究在确定最佳林分结构时,并未直接与森林的多种服务功能(水文调节、木材生产、生物多样性保护、固碳等)及林分稳定性和自然更新的要求联系起来,未来需在积累更多数据后首先建立包括郁闭度和密度等在内的林分结构指标与各种服务功能的数量关系,然后计算确定各自要求的林分结构指标并综合权衡后确定能满足多功能管理要求的辽东栎林分结构指标,实现更精细的辽东栎林多功能管理。
-
研究了宁夏六盘山区辽东栎次生林不同植物层生物量受林分结构特征的影响,得到如下结论:(1)随林分密度和郁闭度增大,乔木层生物量先快速上升后缓慢上升,林下植物层生物量先保持平缓后加速下降,枯落物层生物量则表现为增速逐渐变缓。(2)基于辽东栎林各植物层生物量对郁闭度的响应,认为能使各植物层生物量均处于较高水平的最优郁闭度范围为0.75~0.79。
The Effects of Stand Structure of Quercus wutaishanica Forests on the Biomass of Different Plant Layers in the Liupan Mountains of Northwest China
- Received Date: 2022-10-06
- Accepted Date: 2023-01-30
- Available Online: 2023-06-20
Abstract:


 DownLoad: