• 中国中文核心期刊
  • 中国科学引文数据库(CSCD)核心库来源期刊
  • 中国科技论文统计源期刊(CJCR)
  • 第二届国家期刊奖提名奖
Volume 34 Issue 6
Dec.  2021
Article Contents
Turn off MathJax

Citation:

Climate-sensitive Stand Biomass Model for Larix spp. Plantation

  • Corresponding author: LEI Xiang-dong, xdlei@ifrit.ac.cn
  • Received Date: 2020-11-15
    Accepted Date: 2021-03-04
  • Objective To Establish stand biomass model and analyze the effects of stand factors and climatic factors on stand biomass, so as to provide a model for the biomass estimation for regional scale. Method Taking Larix spp. plantations from 7 provinces in Northeast and North China as samples, the data from 8th national forest inventory of permanent sample plots were used to establish the basic stand biomass models of aboveground and total base on log-transformed by least square regression and robust regression, respectively. The climate variables were screened by principal component analysis and correlation analysis, and climate-sensitive stand biomass models (including aboveground biomass AGB and total biomass TGB) were established. The determination coefficient (R2), root mean square error (RMSE) and relative root mean square error (rRMSE) were used to evaluate the models. The interpretation rate of each factor was divided into independent interpretation and covariant parts and the interpretation rate of different factors was quantified. Result (1) The form of the optimal basic model was the direct introduction of variables. The R2 of the optimal AGB and TGB models were 0.967 and 0.953, respectively, and the AGB were larger than the TGB biomass. The result of ordinary least square regression was similar to that of robust regression, and robust regression was slightly better than ordinary least square regression. The RMSE and rRMSE of the optimal model based on robust regression were lower than the corresponding ordinary least square regression for AGB by 0.046 t·hm−2 and 0.085%, respectively, and for TGB by 0.059 t·hm−2 and 0.081%, respectively. (2) The correlation coefficients between AGB, TGB and moisture-heat index (AHM) were −0.350 and −0.363, respectively. The climate-sensitive stand biomass model further improved the prediction effect of the model. The R2 of AGB increased by 0.41%, while RMSE and rRMSE decreased by 6.85%. The R2 of TGB increased by 0.63%, and the error statistics decreased by 6.79%. (3) The independent interpretations of stand factor of AGB and TGB were 87.37% and 82.32% respectively, the independent interpretations of climate factor were 0.40% and 0.60% respectively, and the covariant parts were 9.33% and 9.98%. The interpretation rate of stand factor was much higher than that of climate factor and the covariant part was large. Conclusion When the modeling data quality of the stand biomass model is high, there is little difference between the models established by robust regression and ordinary least square regression, but climate factors have a significant impact on stand biomass. It is necessary to establish a climate-sensitive stand biomass model to estimate the biomass.
  • 加载中
  • [1]

    Pan Y, Birdsey R A, Fang J, et al. A large and persistent carbon sink in the world’s forests[J]. Science, 2011, 333(6045): 988-993. doi: 10.1126/science.1201609
    [2]

    De Groot R S, Alkemade R, Braat L, et al. Challenges in integrating the concept of ecosystem services and values in landscape planning, management and decision making[J]. Ecological Complexity, 2010, 7(3): 260-272. doi: 10.1016/j.ecocom.2009.10.006
    [3] 陈传国, 朱俊凤. 东北主要林木生物量手册[M]. 北京: 中国林业出版社, 1989.

    [4] 国家林业局. 立木生物量模型及碳计量参数落叶松[S]. 北京: 中国标准出版社, 2016.

    [5]

    Wang C. Biomass allometric equations for 10 co-occurring tree species in Chinese temperate forests[J]. Forest Ecology and Management, 2006, 222(1-3): 9-16. doi: 10.1016/j.foreco.2005.10.074
    [6]

    Návar J. Biomass component equations for Latin American species and groups of species[J]. Annals of Forest Science, 2009, 66: 208-208. doi: 10.1051/forest/2009001
    [7]

    Ter-Mikaelian M T, Korzukhin M D. Biomass equations for sixty-five north American tree species[J]. Forest Ecology and Management, 1997, 97(1): 1-24. doi: 10.1016/S0378-1127(97)00019-4
    [8] 雷相东, 张会儒, 牟惠生. 东北过伐林区蒙古栎林分相容性生物量模型研究[J]. 第四纪研究, 2010, 30(3):559-565.

    [9] 董利虎, 李凤日. 大兴安岭东部主要林分类型乔木层生物量估算模型[J]. 应用生态学报, 2018, 29(9):2825-2834.

    [10] 赵嘉诚, 李海奎. 杉木单木和林分水平地下生物量模型的构建[J]. 林业科学, 2018, 54(2):81−89.

    [11]

    Rudgers J A, Hallmark, A, Baker S R, et al. Sensitivity of dryland plant allometry to climate[J]. Functional Ecology, 2019, 33(12): 2290-2303. doi: 10.1111/1365-2435.13463
    [12]

    Fu L Y, Lei X D, Hu Z D, et al. Integrating regional climate change into allometric equations for estimating tree aboveground biomass of Masson pine in China[J]. Annals of Forest Science, 2017, 74(42): 42.
    [13]

    Zeng W S, Duo H R, Lei X D, et al. Individual tree biomass equations and growth models sensitive to climate variables for Larix spp. in China[J]. European Journal of Forest Research, 2017, 136(2): 233-249. doi: 10.1007/s10342-017-1024-9
    [14]

    Usoltsev V A, Shobairi S O R, Tsepordey I S, et al. Modeling the additive structure of stand biomass equations in climatic gradients of Eurasia[J]. Environmental Quality Management, 2018, 28(2): 55-61. doi: 10.1002/tqem.21603
    [15] 雷相东, 符利勇, 李海奎, 等. 基于林分潜在生长量的立地质量评价方法与应用[J]. 林业科学, 2018, 54(12):116-126. doi: 10.11707/j.1001-7488.20181213

    [16] 何 潇, 李海奎, 曹 磊, 等. 退化森林生态系统中林分碳储量的驱动因素—以内蒙古大兴安岭为例[J]. 林业科学研究, 2020, 33(2):69-76.

    [17] 胥 辉. 生物量模型方差非齐性研究[J]. 西南林学院学报, 1999, 19(2):73-77.

    [18] 郭清文, 冯仲科, 张彦林, 等. 单木生物量模型误差分析与定权方法探讨[J]. 中南林业调查规划, 2006, 25(1):5-9. doi: 10.3969/j.issn.1003-6075.2006.01.002

    [19]

    Huber P J. Robust Regression: Asymptotics, Conjectures, and Monte Carlo[J]. Annals of Statistics., 1973, 1(5): 799-821.
    [20]

    Wang T L, Wang G Y, Innes J L, et al. ClimateAP: An application for dynamic local downscaling of historical and future climate data in Asia Pacific[J]. Frontiers of Agricultural Science and Engineering, 2017, 4(4): 448-458. doi: 10.15302/J-FASE-2017172
    [21] 曾伟生, 唐守正. 非线性模型对数回归的偏差校正及与加权回归的对比分析[J]. 林业科学研究, 2011, 24(2):137-143.

    [22]

    Baskerville G L. Use of logarithmic regression in the estimation of plant biomass[J]. Canadian Journal of Forest Research, 1972, 2(1): 49-53. doi: 10.1139/x72-009
    [23] 茆诗松, 王静龙, 史定华, 等. 统计手册[M]. 北京: 科学出版社, 2003.

    [24] 薛春泉, 徐期瑚, 林丽平, 等. 广东主要乡土阔叶树种含年龄和胸径的单木生物量模型[J]. 林业科学, 2019, 55(2):97-108. doi: 10.11707/j.1001-7488.20190210

    [25] 洪奕丰, 陈东升, 申佳朋, 等. 长白落叶松人工林单木和林分水平的相容性生物量模型研究[J]. 林业科学研究, 2019, 32(4):33-40.

    [26] 徐奇刚, 雷相东, 国 红, 等. 基于多层感知机的长白落叶松人工林林分生物量模型[J]. 北京林业大学学报, 2019, 41(5):97-107.

    [27] 黄建辉, 韩兴国, 陈灵芝. 森林生态系统根系生物量研究进展[J]. 生态学报, 1999, 19(2):270-277. doi: 10.3321/j.issn:1000-0933.1999.02.021

    [28]

    Emmingham W H, Waring R H. An index of photosynthesis for comparing forest sites in western Oregon[J]. Canadian Journal of Forest Research, 1977, 7: 165-174. doi: 10.1139/x77-023
  • 加载中
通讯作者: 陈斌, bchen63@163.com
  • 1. 

    沈阳化工大学材料科学与工程学院 沈阳 110142

  1. 本站搜索
  2. 百度学术搜索
  3. 万方数据库搜索
  4. CNKI搜索

Figures(2) / Tables(6)

Article views(4983) PDF downloads(127) Cited by()

Proportional views

Climate-sensitive Stand Biomass Model for Larix spp. Plantation

    Corresponding author: LEI Xiang-dong, xdlei@ifrit.ac.cn
  • 1. Research Institute of Forest Resource Information Techniques, Chinese Academy of Forestry, Beijing 100091, China
  • 2. Key Laboratory of Forest Management and Growth Modeling, National Forestry and Grassland Administration, Beijing 100091, China

Abstract:  Objective To Establish stand biomass model and analyze the effects of stand factors and climatic factors on stand biomass, so as to provide a model for the biomass estimation for regional scale. Method Taking Larix spp. plantations from 7 provinces in Northeast and North China as samples, the data from 8th national forest inventory of permanent sample plots were used to establish the basic stand biomass models of aboveground and total base on log-transformed by least square regression and robust regression, respectively. The climate variables were screened by principal component analysis and correlation analysis, and climate-sensitive stand biomass models (including aboveground biomass AGB and total biomass TGB) were established. The determination coefficient (R2), root mean square error (RMSE) and relative root mean square error (rRMSE) were used to evaluate the models. The interpretation rate of each factor was divided into independent interpretation and covariant parts and the interpretation rate of different factors was quantified. Result (1) The form of the optimal basic model was the direct introduction of variables. The R2 of the optimal AGB and TGB models were 0.967 and 0.953, respectively, and the AGB were larger than the TGB biomass. The result of ordinary least square regression was similar to that of robust regression, and robust regression was slightly better than ordinary least square regression. The RMSE and rRMSE of the optimal model based on robust regression were lower than the corresponding ordinary least square regression for AGB by 0.046 t·hm−2 and 0.085%, respectively, and for TGB by 0.059 t·hm−2 and 0.081%, respectively. (2) The correlation coefficients between AGB, TGB and moisture-heat index (AHM) were −0.350 and −0.363, respectively. The climate-sensitive stand biomass model further improved the prediction effect of the model. The R2 of AGB increased by 0.41%, while RMSE and rRMSE decreased by 6.85%. The R2 of TGB increased by 0.63%, and the error statistics decreased by 6.79%. (3) The independent interpretations of stand factor of AGB and TGB were 87.37% and 82.32% respectively, the independent interpretations of climate factor were 0.40% and 0.60% respectively, and the covariant parts were 9.33% and 9.98%. The interpretation rate of stand factor was much higher than that of climate factor and the covariant part was large. Conclusion When the modeling data quality of the stand biomass model is high, there is little difference between the models established by robust regression and ordinary least square regression, but climate factors have a significant impact on stand biomass. It is necessary to establish a climate-sensitive stand biomass model to estimate the biomass.

  • 森林生态系统中存储的生物量-碳储量是全球碳循环的基础。研究表明,全球森林生态系统大约含有861 ± 66 Gt碳储量[1],这对于全球气候调节服务至关重要[2]。生物量估计的常用方法是建立回归模型,目前,国内外研建了大量的单木生物量模型[3-7],这些单木模型是林分生物量计算的基础。由于森林资源调查数据中可能没有单木数据,仅记录了林分因子,导致单木生物量模型的应用受限。而在大尺度上更直接有效的方法是建立林分生物量模型,利用林分因子估计生物量,但是林分层次的生物量模型并不多见[8-10]。此外,为了制定应对气候变化的适应性经营策略,迫切需要了解气候对生物量估算的影响。Rudgers等[11]发现林木生物量及其分配会受到气候的影响,使得生物量模型的参数变化,进而影响生物量估计结果。Fu等[12]和Zeng等[13]建立了气候敏感的单木生物量异速生长方程,发现气候与生物量之间存在显著关系。Usoltsev等[14]将气候变量引入可加性林分生物量方程中以确定气候对林分生物量的影响。因此,在生物量估计模型中应考虑气候变量,以减少模型的不确定性。

    常见的模型参数估计方法是最小二乘法,然而森林生长受到立地质量[15]和外界干扰[16]的影响,可能导致调查数据存在较多的离群点,加上生物量数据的异方差性[17],如果使用最小二乘方法求解参数可能会导致模型参数的有效性降低,引起模型的不确定性增加[18]。因此,有学者提出了用稳健回归来尽可能降低离群点对参数估计的影响[19],郭清文等[18]的实验结果证明:基于稳健回归的生物量模型不仅能有效降低建模数据中离群点带来的影响,还使得参数估计在理论上接近最优。

    本研究利用东北和华北地区的落叶松(Larix spp.)人工林生物量数据,比较稳健回归方法和普通最小二乘方法求解林分生物量模型的差异,并在模型中考虑气候因子,量化分析林分因子和气候因子对林分生物量(包括林分地上生物量AGB和林分总生物量TGB)的解释率,以期为大尺度生物量精准估计提供基础模型和方法。

1.   材料与方法
  • 数据来源于黑龙江、吉林、辽宁、北京、河北、山西和内蒙古等7个省份(34°34′~53°33′ N,97°12′~135°05′ E)第8次森林资源连续清查(2009—2013)中的落叶松人工纯林固定样地。经逻辑检查后共得到445块有效样地数据。样地调查因子包括平均年龄、平均胸径以及平均高等,其中平均高是在样地中测量3 ~ 5株平均木的树高取平均值得到。考虑到划分训练集和验证集可能会导致气候因子对林分生物量的解释率量化受到抽样的影响,因此本研究没有进行样本划分,各因子统计量见表1。气候因子来自ClimateAP[20],根据每个样地的地理坐标和海拔下载,气候因子变量名及其描述见表2,样地气候因子为1981 — 2010期间的平均值。

    变量
    Variables
    平均值Mean标准差S.D.最小值Min.最大值Max.
    平均年龄 Age/a2891160
    平均高 H/m12.04.04.224.0
    株数密度 N/(株·hm−2 10215952633933
    平均胸径 Dg/cm13.44.3626.4
    林分蓄积 V/(m3∙hm−282.8153.223.28282.25
    地上生物量 AGB/(t∙hm−253.9833.492.75168.07
    总生物量 TGB/(t∙hm−272.0544.533.74226.50

    Table 1.  Summary statistics of stand variables and biomass

    变量 Variables描述 Description
    AHM湿热指数
    Annual heat: moisture index
    CMD哈格里夫斯气候水分亏缺
    Hargreaves climatic moisture deficit
    DD_00℃以下的天数
    Degree-days below 0℃
    DD_1818℃以下的天数
    Degree-days below 18℃
    DD1818℃以上的天数
    Degree-days above 18℃
    DD55℃以上的天数
    Degree-days above 5℃
    EMT/℃近30年期间的极端最低气温
    Extreme minimum temperature over a 30-year period
    EXT/℃近30年期间的极端最高气温
    Extreme maximum temperature over a 30-year period
    EREF哈格里夫斯相对蒸发
    Hargreaves reference evaporation
    MAP/mm年平均降水量
    Mean annual precipitation (mm)
    MAT/℃年平均温度
    Mean annual temperature
    MCMT/℃最冷月份的平均温度
    Mean coldest month temperature
    MWMT/℃最暖月份的平均温度
    Mean warmest month temperature
    NFFD无霜期天数
    The number of frost-free days
    PAS/mm上年8月至当年度7月期间的降雪量
    Precipitation as snow between August in previous year and July in current year
    TD/℃最暖月份的平均温度和最冷月份的平均温度之差
    Temperature difference between MWMT and MCMT, or continentality

    Table 2.  The name of climatic variables and its description

  • 林分生物量使用单木生物量模型计算,然后累加得到。我国林业行业标准《LY/T 2654—2016:立木生物量模型及碳计量参数—落叶松》[4]中就提供了落叶松的单木生物量模型,对于有行业标准的伴生树种也采用行业标准中给出单木生物量模型进行计算,剩余树种则使用文献[3]和[5]中给出的单木生物量模型进行计算。

  • 最小二乘是回归模型参数求解的常用方法,但如果建模数据中存在离群点且排除是数据录入错误等原因所导致的,则使用最小二乘回归可能得到的不是最优估计。而稳健回归是在剔除离群点和保留离群点之间的一个折中,根据观测值的稳健情况对每个样本点进行赋权,对应的优化目标为式(1)。

    式中,wi是第i个样本对应的权重,yi为第i个样本的因变量实测值;$ {\widehat{y}}_{i} $为第i个样本的模型估计值。

    本研究使用Huber提出的稳健回归方法(式2)[19],可以看出权重估计依赖于残差分布,而残差估计又反过来需要权重。因此,稳健回归是一个迭代重复加权最小二乘直到结果收敛,获得稳健的参数估计结果的过程。

    式中,wj表示第j次迭代的权函数;uj表示第j次迭代的标准化残差。

  • 董利虎等[9]指出落叶松林分生物量模型的误差结构是相乘的,本研究以式(3)~(6)作为基础林分生物量模型,分别采用最小二乘法和稳健回归法求解模型参数。因为使用对数回归来消除生物量数据的异方差,在预测时会产生偏差,曾伟生等[21]详细讨论了非线性模型对数回归的偏差矫正原理与方法,本研究采用Baskerville[22]提出的校正因子CF,对模型进行矫正。

    式中,B为林分生物量,包括AGBTGBDg为林分平均胸径;N为株数密度;H为林分平均高;βii = 1 ~ 4)为模型参数;$\varepsilon $为误差项。

    向最优基础林分生物量模型中添加气候变量,为了降低气候变量的共线性,本研究采用主成分分析和相关分析方法筛选气候变量,步骤如下:(1)对所有气候变量进行主成分分析;(2)选择因子载荷较大的气候变量;(3)通过相关分析筛选出气候变量之间相关性较低但和林分生物量相关性较高的气候变量。最后利用筛选出来的气候变量建立气候敏感的林分生物量模型。

  • 模型评价包括两方面:首先确保模型参数在0.05水平下显著;其次使用决定系数(R2)、均方根误差(RMSE)、相对均方根误差(rRMSE)等指标对模型进行评价,公式见文献[23]。

  • 林分生物量的总解释率可被划分为:(1)独立解释的部分(a:林分因子的独立解释率,c:气候因子的独立解释率);(2)共变的部分(b),即无法确定是由哪个因子所解释的部分;(3)模型不可解释的部分(d)。计算方法如下:含林分因子和气候因子的全模型的R2即为总解释率a + b + c,且存在a + b + c = 1−d的关系,最优基础林分生物量模型的R2a + b,仅以气候因子为自变量的林分生物量模型的R2b + c。由上述关系可计算abcd

2.   结果与分析
  • 所有模型参数在0.05水平下显著(表3表4)。对于同一形式的模型,2种方法的参数估计值略有差异,从参数符号可以看出AGBTGB均随DgNH的增加而增加,但CF没有明显的区别。从基础模型的评价指标发现,AGB模型优于TGB模型。对于AGB而言,采用直接引入变量的模型比变量组合形式的模型拟合效果要好,除5号和6号模型的评价指标显示出普通最小二乘回归略优于稳健回归外,其余模型均显示出稳健回归略优于普通最小二乘回归,其中模型8的R2最高,可达0.967,稳健回归的RMSErRMSE要比普通最小二乘回归分别低0.046 t∙hm−2和0.085%,二者差异不大。对于TGB而言,其规律和AGB相似,所有TGB模型中,15号和16号模型的R2可达0.953,稳健回归的误差统计量略好一些,但比AGB模型低0.014。由于建模数据的质量较好,两种方法建立的模型没有太大差异,稳健回归的优越性没有得到充分体现,甚至普通最小二乘回归略优于稳健回归。不论是AGB还是TGB,最优基础模型形式相同,采用稳健回归的方法求得的参数略优。因此,本研究分别以模型8和模型16作为AGBTGB的最优基础林分生物量模型,用于解释率的量化分解。

    序号
    Number
    模型
    Model
    方法
    Method
    模型参数 Model parametersR2RMSE/(t∙hm−2)rRMSE/%CF
    β1β2β3β4
    1式3OLS−9.279 0 (0.097 9)2.472 5 (0.018 4)0.992 7 (0.010 5)0.9408.20315.1981.058 28
    2Huber−9.274 9 (0.099 8)2.471 8 (0.018 8)0.992 3 (0.010 7)0.9408.19715.1861.058 28
    3式4OLS−8.337 2 (0.116 6)0.805 2 (0.007 6)0.889 6 (0.012 9)0.9279.05016.7661.073 51
    4Huber−8.324 0 (0.114 3)0.808 2 (0.007 4)0.884 0 (0.012 6)0.9288.99716.6691.073 57
    5式5OLS−9.066 0 (0.095 0)0.986 7 (0.009 9)0.453 2 (0.019 1)0.9616.63912.2991.055 24
    6Huber−9.069 3 (0.098 3)0.984 4 (0.010 3)0.466 5 (0.019 8)0.9596.76412.5311.055 28
    7式6OLS−9.044 7 (0.085 8)2.184 7 (0.027 6)0.295 6 (0.023 3)0.960 5 (0.009 3)0.9666.14511.3841.049 74
    8Huber−9.001 8 (0.090 6)2.153 2 (0.029 1)0.326 1 (0.024 6)0.955 1 (0.009 9)0.9676.09911.2991.049 84
      注:1.括号中的数值为参数标准差:2.OLS代表普通最小二乘回归,Huber代表稳健回归。下同。
      Notes: 1.The value in parentheses is the standard deviation of the parameter. 2.OLS stands for general least square regression, Huber stands for robust regression. The same as below.

    Table 3.  Fitting and evaluation results of basic stand aboveground biomass model

    序号
    Number
    模型
    Model
    方法
    Method
    模型参数 Model parametersR2RMSE/(t∙hm−2)rRMSE/%CF
    β1β2β3β4
    9式3OLS−8.959 7 (0.115 5)2.468 9 (0.021 7)0.989 4 (0.012 4)0.91413.08318.1581.069 22
    10Huber−8.959 2 (0.120 1)2.469 9 (0.022 6)0.989 0 (0.012 9)0.91313.11218.1991.069 22
    11式4OLS−8.051 4 (0.120 0)0.807 1 (0.007 8)0.888 0 (0.013 2)0.92612.10916.8071.075 74
    12Huber−8.040 9 (0.117 9)0.810 6 (0.007 6)0.882 2 (0.013 0)0.92612.06616.7471.075 80
    13式5OLS−8.695 1 (0.106 2)0.972 5 (0.011 1)0.488 2 (0.021 4)0.9509.90213.7441.061 94
    14Huber−8.681 5 (0.110 0)0.967 5 (0.011 5)0.508 0 (0.022 1)0.94910.03213.9241.062 00
    15式6OLS−8.677 2 (0.100 6)2.122 0 (0.032 4)0.356 4 (0.027 3)0.950 6 (0.011 0)0.9539.68713.4451.058 58
    16Huber−8.634 2 (0.104 4)2.089 2 (0.033 6)0.390 6 (0.028 4)0.944 4 (0.011 4)0.9539.62813.3641.058 69

    Table 4.  Fitting and evaluation results of basic stand total biomass model

  • 主成分分析表明,前3个主成分的贡献率分别为56.0%、22.9%、16.7%,其中第一主成分中载荷大于0.3的气候变量有:MATNFFDEMT,主要是和温度有关的气候变量;第二主成分中载荷大于0.3的气候变量有:CMDAHM,主要是和湿热特征有关的气候变量;第三主成分中载荷大于0.33的气候变量有:TDEXTMWMT,主要是和极端天气有关的气候变量。从相关分析(表5)的结果看出:AGBTGB的结果相似,都与AHMCMD的相关系数较高,而与其他气候因子的较低。由于AHMCMD之间的相关系数为0.856,而AHM和林分生物量的关系更密切,因此将AHM添加到最优基础林分生物量模型中,得到气候敏感的林分生物量模型。

    变量 VariablesAGBTGBMATNFFDEMTCMDAHMTDEXTMWMT
    AGB10.999−0.085−0.090−0.082−0.285−0.3500.074−0.025−0.059
    TGB1−0.082−0.078−0.084−0.306−0.3630.094−0.001−0.037
    MAT10.9560.9370.0530.376−0.5550.4610.698
    NFFD10.870−0.0760.296−0.3730.5450.802
    EMT10.0950.418−0.7580.1790.458
    CMD10.856−0.249−0.102−0.114
    AHM1−0.3890.0400.142
    TD10.4300.202
    EXT10.915
    MWMT1

    Table 5.  Correlation coefficient matrix between stand biomass and some climatic variables

    表6看出,气候敏感的林分生物量模型(模型17 ~ 20)的参数均显著,2种算法的参数估计结果略有差异,AGBTGB均随AHM增加而降低,但矫正因子CF基本没有差异。根据评价指标,稳健回归稍优于普通最小二乘回归,而气候敏感的模型明显优于最优基础模型:对于AGB,模型18与4相比,R2提高了0.41%,而RMSErRMSE降低了6.85%;对于TGB,模型20与16相比,R2提高了0.63%,而RMSErRMSE降低了6.79%。这说明建立气候敏感的林分生物量在统计上是合理的,气候因子对林分生物量有显著影响,加入AHM后,模型的拟合优度提升。本研究分别以模型18和模型20作为AGBTGB的最优气候敏感的林分生物量模型,用于解释率的量化分解。

    序号
    Number
    模型
    Model
    方法
    Method
    模型参数 Model parametersR2RMSE/
    (t∙hm−2)
    rRMSE/%CF
    β1β2β3β4β5
    17 log(AGB) = β1 + β2 × log(Dg) +
    β3 × log(H)+β4 × log(N) +
    β5 × log(AHM)
    OLS −8.105 4
    (0.101 2)
    2.202 1
    (0.023 4)
    0.225 69
    (0.020 4)
    0.957 8
    (0.007 9)
    −0.257 7
    (0.019 4)
    0.971 5.730 10.616 1.041 89
    18 Huber −8.090 6
    (0.106 0)
    2.191 8
    (0.024 5)
    0.238 6
    (0.021 3)
    0.955 1
    (0.008 3)
    −0.258 3
    (0.020 3)
    0.971 5.708 10.575 1.041 92
    19 log(TGB) = β1 + β2 × log(Dg) +
    β3 × log(H)+β4 × log(N) +
    β5 × log(AHM)
    OLS −7.581 4
    (0.118 9)
    2.142 3
    (0.027 5)
    0.274 8
    (0.023 40)
    0.947 6
    (0.009 3)
    −0.300 6
    (0.022 8)
    0.959 9.037 12.543 1.049 41
    20 Huber −7.561 2
    (0.124 3)
    2.130 2
    (0.028 7)
    0.290 3
    (0.025 0)
    0.944 0
    (0.009 7)
    −0.301 8
    (0.023 8)
    0.959 9.016 12.514 1.049 44

    Table 6.  Fitting and evaluation results of climate sensitive stand biomass basic model

  • 分别以AGBTGB为对象,量化气候因子和林分因子对林分生物量的贡献,结果如图1所示。对于AGB:气候因子的总解释率(b + c)为9.73%,其中独立解释部分(c)为0.40%,而林分因子的总解释率(a + b)为96.70%,独立解释部分(a)为87.37%,共变部分(b)为9.33%,二者的总解释率(a + b + c)为97.10%。对于TGB:气候因子的总解释率(b + c)为10.58%,其中独立解释部分(c)为0.60%,而林分因子的总解释率(a + b)为95.30%,独立解释部分(a)为85.32%,共变部分(b)为9.98%,二者共同解释率为95.90%。总的来看,林分因子对林分生物量的解释率很高,加入气候因子后模型解释率明显提升,但其中共变部分较大,气候因子的独立解释率不到1%。气候因子对AGB的独立解释率小于对TGB的独立解释率,说明不同组分的生物量对于气候的响应程度有所不同。

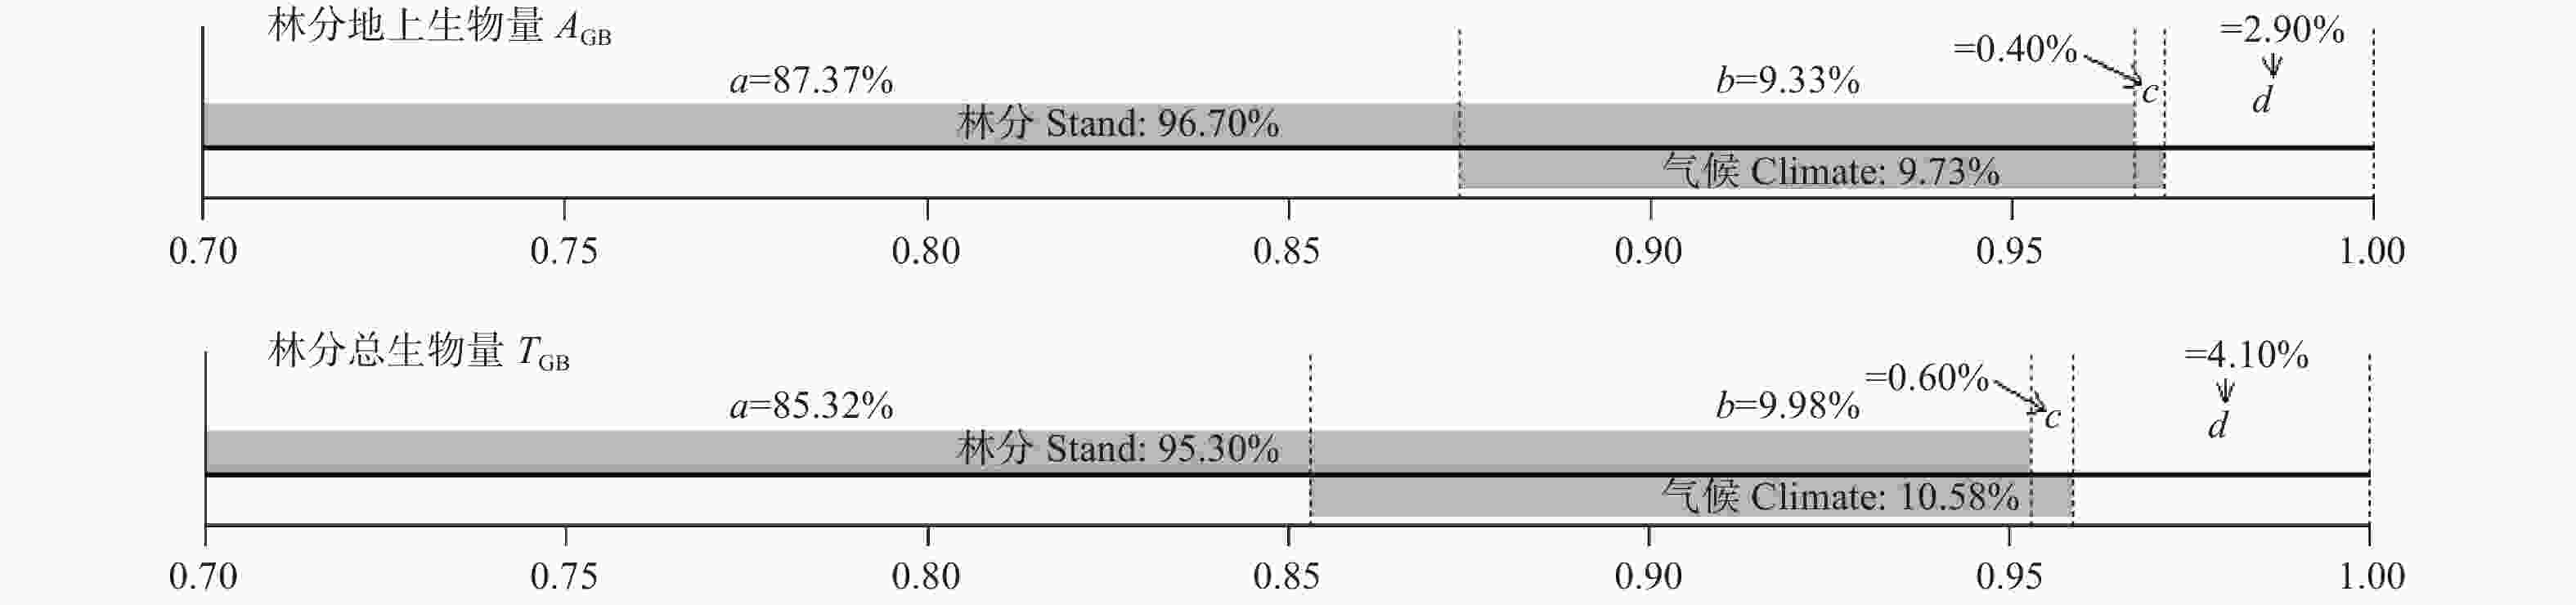
    Figure 1.  Explanation rate decomposition of stand and factors to stand biomass

3.   讨论
  • 本研究采用普通最小二乘法和稳健回归方法建立落叶松人工林林分生物量模型。从模型形式上看,不论是AGB还是TGB,最优基础模型的自变量均为DgHN同时直接引入的方式,而采用组合变量的形式,模型精度略低,这与单木层次类似[24]。其原因是组合变量相当于对参数进行了限制,使得自变量的作用减弱。洪奕丰等[25]指出建立林分生物量模型需要多维度的自变量,而在本研究中,DgHN较好的描述了林分生物量,R2在0.95以上,该结果和徐奇刚等[26]的结果一致。从生物量组分上看,林分地上生物量优于总生物量,主要是树根生物量的分布不均匀、变异性较大所导致的[27]。从方法上看,对数转换虽然是消除生物量模型异方差的有效手段[21],但没有解决离群点对模型参数估计的影响,稳健回归则对残差值较大的样本进行了多次限制,使得参数估计更加有效,但这与建模数据的质量有很大关系,如果建模数据中基本不存在离群点,稳健回归则会把每一个样本点赋予接近1的权重,那么稳健回归和普通最小二乘回归的差异不大,对于本研究而言,由于建模数据的质量较高,虽然基于稳健回归的模型的误差统计量略小,但这种差异还不到1%,稳健回归的优势就难以发挥。另外,当前仅开发了基于线性形式的稳健回归方法,本研究没有对加性误差进行实验,更有效的手段是基于非线性形式开发稳健回归方法,对生物量模型的误差结构进行深入分析。

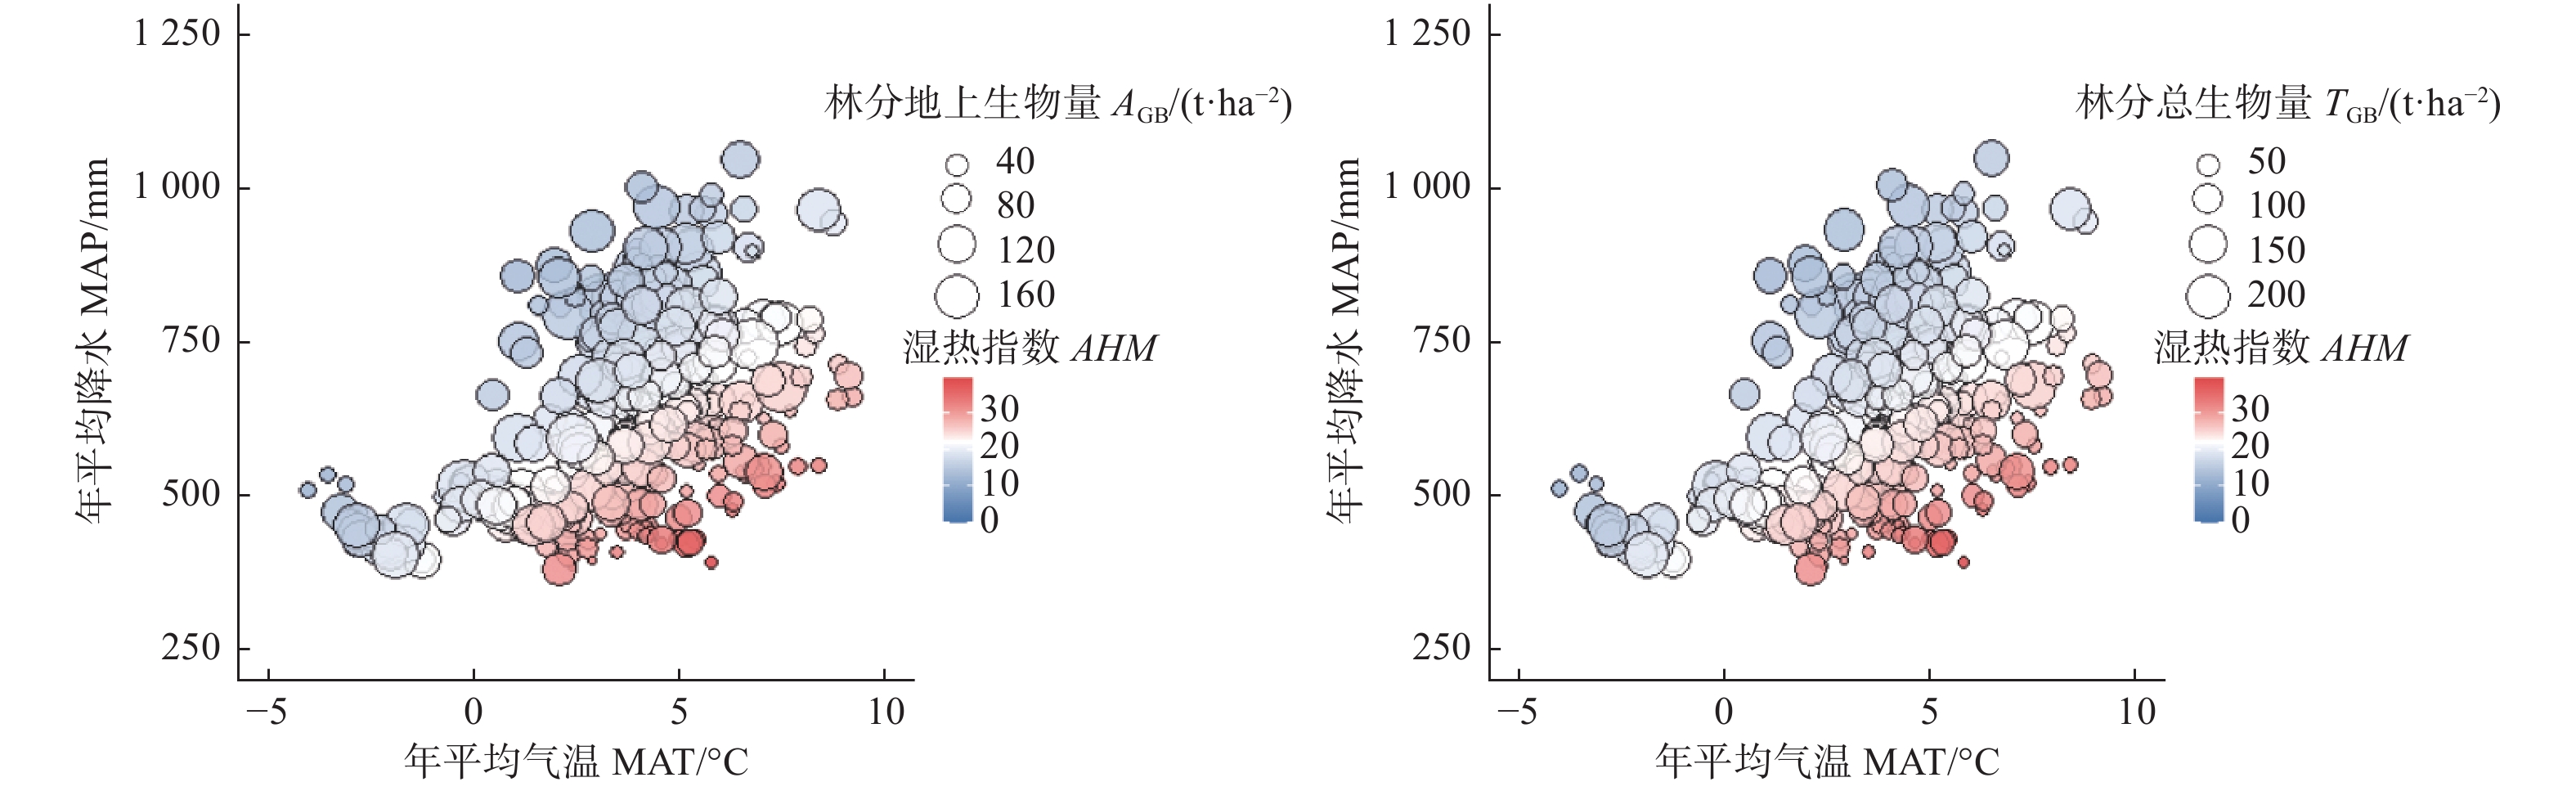
    了解林分生物量与气候变量之间的关系才能量化气候因子对林分生物量的影响,同时有必要在大尺度范围内进行研究,才能获得较为可信的模拟结果,如果尺度太小,则气候变量的变异较小,生物量对气候的响应不能完全表达。为了避免这种不确定性,本研究以我国北方地区7个省份的落叶松人工林作为研究对象,在大尺度上对林分生物量和气候因子之间的关系进行了探索。为了降低共线性的风险,结合主成分分析和相关分析,即能筛选出具有统计学意义的气候变量加入到林分生物量模型中,是一套合理、方便的方法。从理论上讲,气候敏感的林分生物量模型比传统的模型更好,而本研究的实验结果也证明:不论是AGB还是TGB,考虑气候影响的模型性能优于最优基础模型,这和以前的研究结果一致[12-14]AHM是将气温和降水量相结合的一个综合指标,可用来比较温度和降水量均不同的环境下的气候对林分生物量的影响程度。本研究发现单独使用温度或降水量模拟气候对生物量的影响并不合适,温度和降水存在共同变化,从图2可以看出生物量与气候因子之间的复杂作用关系,比如温度较高而降水量过低时,AHM比较大,此时林分生物量比较小,但是当温度和降水量同时变高或变低时,AHM可能增加也可能会降低,此时林分生物量的变化波动就比较厉害,无法用单一气候变量说明林分生物量的变化趋势,这也印证了与利用主成分分析和相关分析筛选出具有统计学意义的气候变量的重要性。气候因子的变化将会影响林木的生理过程(如光合和呼吸作用),导致生物量的积累和分配发生变化[28]。通过解释率的分解,本研究发现林分因子对林分生物量的独立解释率在87%以上,气候因子对林分生物量的独立解释率不超过0.6%,有大约10%的解释率无法确定是由哪一类因子所解释的,虽然气候因子对林分生物量的解释率不高,但对林分生物量有显著影响。同时,不同生物量组分对于气候的响应程度有所差异,说明气候等非生物因子对于生物量的影响不能被忽视,应该深入探究林分生物量多元驱动机制。

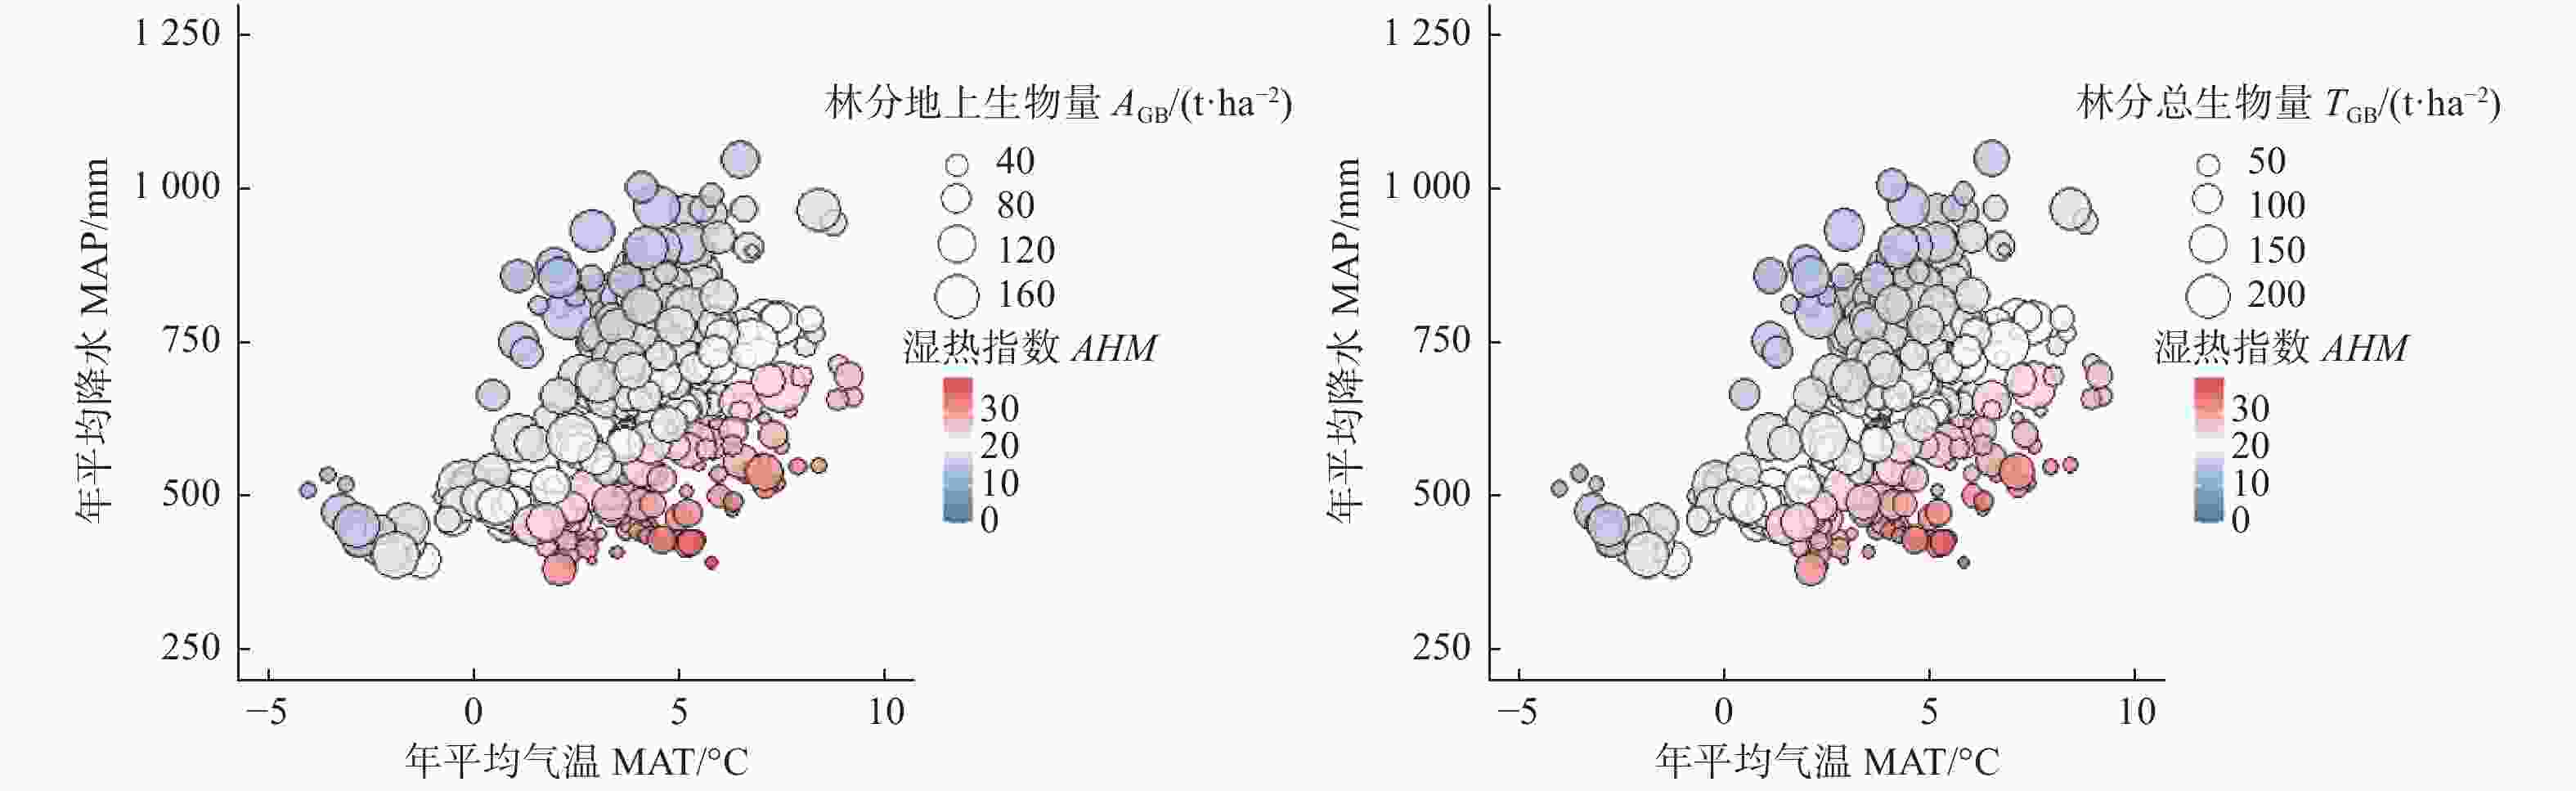
    Figure 2.  Comprehensive effect between stand biomass and climatic factors

4.   结论
  • 在建模数据质量高的情况下,稳健回归方法和普通最小二乘方法的差异不大,均可用来估计林分生物量的参数。最优基础林分地上生物量和总生物量的模型R2分别为0.967、0.953,可以对林分生物量进行很好的估计,而通过相关方法筛选气候变量,建立气候敏感的林分生物量模型能够进一步提升模型性能,模型R2分别达到0.971、0.959,可用于林分生物量精准估计。进一步分析发现:林分因子对林分生物量的独立解释率大于88%,气候因子对林分生物量的独立解释率不超过0.6%,但是二者共同解释率大于95%,因此建立林分生物量模型时不能忽视气候因子的影响,应在大尺度范围内建立气候敏感的生物量模型,以减少生物量模型的不确定性。

Reference (28)

Catalog

    /

    DownLoad:  Full-Size Img  PowerPoint
    Return
    Return