• 中国中文核心期刊
  • 中国科学引文数据库(CSCD)核心库来源期刊
  • 中国科技论文统计源期刊(CJCR)
  • 第二届国家期刊奖提名奖
Volume 34 Issue 6
Dec.  2021
Article Contents
Turn off MathJax

Citation:

Effect of Diameter at Breast Height Structure on the Occurrence of Shoot Blight in Pinus densiflora Pure Forest

  • Corresponding author: LIANG Jun, liangjun@caf.ac.cn
  • Received Date: 2021-05-27
    Accepted Date: 2021-07-13
  • Objective To clarify the effect of diameter at breast height (DBH) structure on the occurrence of shoot blight in Pinus densiflora pure forest, so as to provide theoretical and technical support for taking reasonable forest management measures to adjust the stand DBH structure and prevent and control the prevalence of P. densiflora shoot blight. Method A total of 50 temporary sample plots were set up in P. densiflora pure forest of Kunyu Mountains to investigate the DBH and the disease index of shoot blight. Weibull distribution fitted the location parameter, scale parameter and shape parameter, and $ {x}^{2} $ test verified three parameters. Then the correlation between disease index of shoot blight and eight DBH structure characteristic indices of P. densiflora, i.e. the three parameters, the average DBH of P. densiflora, the average DBH of infected P. densiflora, the average DBH of uninfected P. densiflora, the average DBH of maximum disease grade P. densiflora, and the average DBH of minimum disease grade of P. densiflora were determined by Spearman rank correlation analysis. Result The DBH structure of temporary sample plots of P. densiflora pure forest conformed to Weibull distribution. The DBH distribution center was 9.66 ~16.25 cm, and the DBH structure of 90.00% plots followed a positively skewed unimodal distribution. The disease indices of P. densiflora shoot blight were negatively correlated with the average DBH of uninfected P. densiflora, the average DBH of maximum disease grade P. densiflora and the average DBH of minimum disease grade P. densiflora, but the test results were not significant. Meanwhile the disease indices of P. densiflora shoot blight were significantly and negatively correlated with the scale parameters, the average DBH of P. densiflora and the average DBH of infected P. densiflora (p<0.05), and highly, significantly and negatively correlated (p< 0.01) with the shape parameters. It was indirectly, significantly and negatively correlated with the position parameters. Conclusion Weibull distribution is able to well fit the DBH structure of P. densiflora pure forest. There are significant or extremely significant negative correlations between the disease indices of shoot blight and the DBH structure characteristic indexes, such as the DBH structure distribution center, the DBH structure distribution curve shape, the average DBH of P. densiflora, the average DBH of infected P. densiflora. There is an indirect and significantly negative correlation between the disease indices of shoot blight and the minimum DBH of P. densiflora. It is suggested to take forest management measures such as tending and thinning to increase the proportion of dominant trees in the forest, reduce the P. densiflora DBH differentiation degree, decrease the infested P. densiflora with small DBH in order to achieve the purpose of ecological regulation of P. densiflora shoot blight.
  • 加载中
  • [1] 吴小芹. 全球松树枯梢病发生状况与防治策略[J]. 世界林业研究, 1999(1):16-21.

    [2]

    Jankovský L, Palovčíková D. Dieback of Austrian pine-the epidemic occurrence of Sphaeropsis sapinea in southern Moravia[J]. Journal of Forest Science, 2003, 49(8): 389-394.
    [3]

    Iturritxa E, Ganley R J, Raposo R, et al. Resistance levels of Spanish conifers against Fusarium circinatum and Diplodia pinea[J]. Forest Pathology, 2013, 43(6): 488-495. doi: 10.1111/efp.12061
    [4]

    Zlatkovic M, Keča N, Wingfield M J, et al. New and unexpected host associations for Diplodia sapinea in the Western Balkans[J]. Forest Pathology, 2017, 47(3): 1-11.
    [5]

    Manzanos T, Aragonés A, Iturritxa E. Genotypic diversity and distribution of Sphaeropsis sapinea within Pinus radiata trees from northern Spain[J]. Forest Pathology, 2019, 49(6): 1-9.
    [6] 孟宪宇. 测树学[M]. 第3版. 北京: 中国林业科学出版社, 2006.

    [7] 林庆源, 林 强, 黄 劼, 等. 毛竹枯梢病发生与林分及立地条件的关系[J]. 林业科学研究, 1999, 12(6):628-632. doi: 10.3321/j.issn:1001-1498.1999.06.011

    [8] 胡瑞瑞, 梁 军, 谢 宪, 等. 昆嵛山赤松纯林赤枯病特征及与林分因子的关系[J]. 林业科学, 2019, 55(7):95-104. doi: 10.11707/j.1001-7488.20190710

    [9] 罗 娜. 土沉香人工林林分结构与林下植被多样性对病虫害的影响[D]. 长沙: 中南林业科技大学, 2016.

    [10] 张 平, 解光强, 田 桢, 等. 红松人工林生物群落与根朽病发生的相互关系[J]. 中南林业科技大学学报, 2021, 41(3):54-63.

    [11] 焦一杰, 黄逢龙, 丁 辉, 等. 杨树林分的胸径特征与溃疡病感病指数的关系[J]. 林业科学研究, 2010, 23(3):342-348.

    [12] 谭飞川. 云杉落针病与林地各因子及林分结构的相关性分析[D]. 成都: 四川农业大学, 2018.

    [13]

    Xie X, Liang J, Zhang M, et al. Endophytic fungal community of Pinus densiflora infected by different incidences of Sphaeropsis sapinea in a mixed coniferous forest[J]. International Journal of Agriculture and Biology, 2020, 23: 1044-1050.
    [14] 沈伯葵, 褚祥如, 张明海, 等. 松梢枯病的发生规律[J]. 林业科学研究, 1993, 6(2):157-161.

    [15]

    Hu R R, Liang J, Xie X, et al. Stand characteristics and soil properties in Japanese red pine (Pinus densiflora) pure forests with different disease severity index in Kunyushan Mountains region, China[J]. International Journal of Agriculture and Biology, 2019, 21: 726-732.
    [16] 孟宪宇. 使用Weibull分布对人工油松林直径分布的研究[J]. 北京林业大学学报, 1985, 1:30-40.

    [17] 张 贵, 陈建华. 应用Weibull分布研究毛竹林分直径结构规律[J]. 经济林研究, 2002, 20(4):31-33. doi: 10.3969/j.issn.1003-8981.2002.04.008

    [18] 刘相兵, 刘亚茜, 李兵兵, 等. 生态疏伐对林分密度及直径结构的影响[J]. 西北林学院学报, 2012, 27(3):145-149. doi: 10.3969/j.issn.1001-7461.2012.03.30

    [19] 周国模, 刘恩斌, 刘安兴, 等. Weibull分布参数辨识改进及对浙江毛竹林胸径年龄分布的测度[J]. 生态学报, 2006, 26(9):2918-2926. doi: 10.3321/j.issn:1000-0933.2006.09.018

    [20] 张建国, 段爱国, 童书振. 林分直径结构模拟与预测研究概述[J]. 林业科学研究, 2004, 17(6):787-795. doi: 10.3321/j.issn:1001-1498.2004.06.017

    [21] 寇文正. 林木直径分布的研究[J]. 南京林业大学学报:自然科学版, 1982, 1:51-65.

    [22] 周泽宇, 杨绕华, 张玉珍, 等. 华北落叶松人工林直径分布预测模型构建[J]. 南京林业大学学报:自然科学版, 2020, 44(2):117-124.

    [23] 庄崇洋, 黄清麟, 马志波, 等. 典型中亚热带天然阔叶林各林层直径分布及其变化规律[J]. 林业科学, 2017, 53(4):18-27. doi: 10.11707/j.1001-7488.20170403

    [24] 樊小红, 王立涛, 安娟艳, 等. 长白山东北红豆杉生境内针阔混交林直径结构分布研究[J]. 植物研究, 2021, 41(1):89-97. doi: 10.7525/j.issn.1673-5102.2021.01.012

    [25]

    Nord-Larsen T, Cao Q V. A diameter distribution model for even-aged beech in Denmark[J]. Forest Ecology and Management, 2006, 231: 218-225. doi: 10.1016/j.foreco.2006.05.054
    [26]

    Cao Q V. Predicting parameters of a Weibull function for modeling diameter distribution[J]. Forest Science, 2004, 50(5): 682-685.
    [27] 国 红, 雷渊才. 蒙古栎林分直径Weibull分布参数估计和预测方法比较[J]. 林业科学, 2016, 52(10):64-71. doi: 10.11707/j.1001-7488.20161008

    [28] 马志波, 黄清麟, 庄崇洋, 等. 基于分层的典型中亚热带天然阔叶林林木竞争关系研究[J]. 林业科学研究, 2018, 31(2):1-10.

  • 加载中
通讯作者: 陈斌, bchen63@163.com
  • 1. 

    沈阳化工大学材料科学与工程学院 沈阳 110142

  1. 本站搜索
  2. 百度学术搜索
  3. 万方数据库搜索
  4. CNKI搜索

Figures(5) / Tables(4)

Article views(2328) PDF downloads(31) Cited by()

Proportional views

Effect of Diameter at Breast Height Structure on the Occurrence of Shoot Blight in Pinus densiflora Pure Forest

    Corresponding author: LIANG Jun, liangjun@caf.ac.cn
  • 1. Key Laboratory of Forest Protection of National Forestry and Grassland Administration, Research Institute of Forest Ecology, Environment and Protection, Chinese Academy of Forestry, Beijing 100091, Beijing, China
  • 2. Kunyushan Forest Ecosystem Observation and Research Station, National Forestry and Grassland Administration, Yantai 264100, Shangdong, China
  • 3. Beijing Xishan Experiment Forest Farm, Beijing 100083, China
  • 4. Hebei Quality Inspection and Testing Center of Forestry Grass and Flower,Shijiazhuang 050092,Hebei,China
  • 5. Central South University of Forestry and Technology, Changsha 410004, Hu'nan, China

Abstract:  Objective To clarify the effect of diameter at breast height (DBH) structure on the occurrence of shoot blight in Pinus densiflora pure forest, so as to provide theoretical and technical support for taking reasonable forest management measures to adjust the stand DBH structure and prevent and control the prevalence of P. densiflora shoot blight. Method A total of 50 temporary sample plots were set up in P. densiflora pure forest of Kunyu Mountains to investigate the DBH and the disease index of shoot blight. Weibull distribution fitted the location parameter, scale parameter and shape parameter, and $ {x}^{2} $ test verified three parameters. Then the correlation between disease index of shoot blight and eight DBH structure characteristic indices of P. densiflora, i.e. the three parameters, the average DBH of P. densiflora, the average DBH of infected P. densiflora, the average DBH of uninfected P. densiflora, the average DBH of maximum disease grade P. densiflora, and the average DBH of minimum disease grade of P. densiflora were determined by Spearman rank correlation analysis. Result The DBH structure of temporary sample plots of P. densiflora pure forest conformed to Weibull distribution. The DBH distribution center was 9.66 ~16.25 cm, and the DBH structure of 90.00% plots followed a positively skewed unimodal distribution. The disease indices of P. densiflora shoot blight were negatively correlated with the average DBH of uninfected P. densiflora, the average DBH of maximum disease grade P. densiflora and the average DBH of minimum disease grade P. densiflora, but the test results were not significant. Meanwhile the disease indices of P. densiflora shoot blight were significantly and negatively correlated with the scale parameters, the average DBH of P. densiflora and the average DBH of infected P. densiflora (p<0.05), and highly, significantly and negatively correlated (p< 0.01) with the shape parameters. It was indirectly, significantly and negatively correlated with the position parameters. Conclusion Weibull distribution is able to well fit the DBH structure of P. densiflora pure forest. There are significant or extremely significant negative correlations between the disease indices of shoot blight and the DBH structure characteristic indexes, such as the DBH structure distribution center, the DBH structure distribution curve shape, the average DBH of P. densiflora, the average DBH of infected P. densiflora. There is an indirect and significantly negative correlation between the disease indices of shoot blight and the minimum DBH of P. densiflora. It is suggested to take forest management measures such as tending and thinning to increase the proportion of dominant trees in the forest, reduce the P. densiflora DBH differentiation degree, decrease the infested P. densiflora with small DBH in order to achieve the purpose of ecological regulation of P. densiflora shoot blight.

  • 松枯梢病(病原菌:Sphaeropsis sapinea (Fr.) Dyko & B. Sutton)是一种世界性的寄主主导性病害,寄主广泛,可侵染冷杉属(Abies)、雪松属(Cedrus)、刺柏属(Juniperus)、落叶松属(Larix)、云杉属(Picea)、松属(Pinus)、黄杉属(Pseudotsuga)和崖柏属(Thuja)等8属约60种(含部分变种)针叶树,美国、荷兰、新西兰、南非和中国等全球近40个国家早已报道该病发生,主要引起寄主树木枯梢、枝干溃疡、流脂、坏死以及根茎腐烂和木材蓝变等,幼树和大树均可受害,病害发生严重时可使林木成片枯死[1-5],为林业健康稳定发展带来巨大威胁。

    森林群落内部存在许多特征因子,如树种、胸径、树高、林龄等,并且都具有一定的分布状态[6],其中胸径结构是最基本的植物群落结构特征之一,反映了植物群落内植物种群生长状况以及林木竞争、分化和自疏现象等,同时影响着森林生态系统病虫害的发生与发展。在野外踏查过程中常观察到林分内部某些较大胸径或较小胸径的树木上更易发生某种病害,并且林庆源等[7]、胡瑞瑞等[8]分别研究发现随寄主树木胸径减小,毛竹(Phyllostachys pubescens Mazel ex J. Houz.)枯梢病和赤松(Pinus densiflora Sieb. et Zucc.)赤枯病病害越发严重;而罗娜[9]、张平等[10]分别表明土沉香(Aquilaria sinensis (Lour.) Spreng.)烟煤病和炭疽病病情以及红松(Pinus koraiensis Sieb. et Zucc.)根朽病病情均与寄主胸径呈正相关。同时,焦一杰等[11]、谭飞川[12]分别在分析欧美杨108(Populus × euramericana(Dode)Guineir cv. ‘Guarinen to’)和新疆杨(Populus alba var. pyramidalis Bunge)以及云杉(Picea asperata Mast.)胸径结构特征与杨树溃疡病和云杉落叶病的关系时发现,3种树木的胸径较大且分布范围集中时不利于寄主病害的发生,即树木胸径结构对病害流行会产生影响。以上可知,病害的发生与寄主胸径结构特征息息相关。因此,了解林木胸径结构对特定病害发生的效应,并结合此效应制定病害防治措施,对防控病害流行、维持森林生态系统稳定性等具有重要意义。

    目前,赤松枯梢病逐渐发展成为昆嵛山地区主要病害,严重威胁着赤松次生林的健康稳定发展。然而该病害流行原因有待分析,无污染、有效且长期的生态防控措施仍需挖掘。因此,本研究以昆嵛山赤松纯林为研究对象,通过对赤松胸径及其枯梢病病情进行调查,从赤松胸径结构对枯梢病发生效应角度进行剖析,明确调整林分胸径结构防控赤松枯梢病流行的方法,为研究该病害发生机制以及生态防治工作提供理论依据和技术支撑。

    • 昆嵛山赤松天然次生林位于胶东半岛东部暖温带落叶阔叶林区(121°41′34″~121°48′04″ E,37°11′50″~37°17′22″ N),是赤松分布最集中的地区。年平均气温为12.3℃,年降水量为800 ~1200 mm,年均相对湿度为62.6%,无霜期为200 ~ 220 d;土壤多为有机质含量较低的砂质棕壤[8,13]

    2.   研究方法
    • 本研究在海拔(200±25 m)、坡位(中)、坡度(30°±3°)、坡向(阳)、棕壤和林龄(40±4 a)等条件相近的赤松纯林设置了50块临时样地,每块样地面积为20 m×20 m。调查临时样地内所有赤松胸径(DBH)和枯梢病发病情况,然后每个样地按2 cm一个径阶统计赤松株数,起测径阶为5 cm[14-15]。病害分级标准如表1

      病级
      Disease grade
      代表值
      Representative value
      植株分级标准
      Plant classification standard
      0健康无病
      11/4以下枝梢发病
      21/4~1/2枝梢发病
      31/2~3/4枝梢发病
      43/4以上枝梢发病

      Table 1.  The classification standard of shoot blight of Pinus densiflora

    • 为更好描述赤松种群胸径分布差异,选择应用较为广泛且灵活性较强的Weibull分布函数进行分析。利用Microsoft Excel 2016软件,采用最大似然估计法迭代求得abc参数值并进行$ {x}^{2} $检验。

      Weibull分布密度函数为:

      其中,$ x\ge $a$ b > \text{0.00} $$ c > \text{0.00} $a是位置参数,认定为临时样地内所测赤松最小胸径;b是尺度参数,为赤松胸径分布中心,频度最高的位置;c是形状参数,其值尤为重要,取值不同,分布曲线形状类型会有所差异。当$ a=\text{0.00} $时,为两参数Weibull分布密度函数;当$ a=\text{0.00},c < \text{1.00} $时为反J型分布,当$ \text{1.00} < c < \text{3.6}\text{0} $时为正偏山状分布,当$ c\approx \text{3.60} $时近正态分布,当$ c > \text{3.60} $时正偏逐渐变为负偏,当c=2.00为Rayleigh分布,当$ c\to \infty $时为单点分布[11,16]

      $ {x}^{2} $统计量$ U $为:

      其中,m为样地内赤松径阶划分个数,$ {v}_{i} $为样地内赤松实际株数,n为赤松总株数,$ {p}_{i} $为样地内赤松理论频率,$ n{p}_{i} $为样地内赤松理论株数。若$ U $<$ {x}^{2} $$ (m-1) $,赤松纯林胸径结构符合Weibull分布,若$ U $>$ {x}^{2}(m-1) $,赤松纯林胸径结构不符合Weibull分布[17]$ {x}^{2} $检验临界值由CHIINV函数获得。

      将符合Weibull分布赤松纯林临时样地内的3参数abc以及赤松平均胸径D0,感病赤松平均胸径D1,未感病赤松平均胸径D2,最大病级赤松平均胸径D3,最小病级赤松平均胸径D4表征为赤松胸径结构特征指标,分别与赤松枯梢病病情指数进行Spearman秩相关性分析,并将D1D2以及D3D4两组对应胸径结构特征指标进行方差分析。

    3.   结果与分析
    • 昆嵛山各赤松纯林临时样地胸径结构$ {x}^{2} $检验统计量U均小于显著水平为0.05时的$ {x}^{2} $检验临界值(表2),即各赤松纯林临时样地胸径结构均符合Weibull分布,应用Weibull分布方法对该林分赤松纯林胸径结构进行拟合所获得的结果极为可靠。

      样地编号
      Plot number
      U$ {x}_{0.05}^{2} $样地编号样地编号
      Plot number
      U$ {x}_{0.05}^{2} $
      1 16.074 19.675 26 11.441 15.507
      2 17.988 18.307 27 6.261 15.507
      3 8.048 15.507 28 3.909 15.507
      4 10.256 14.067 29 8.461 16.919
      5 4.963 15.507 30 15.730 19.675
      6 12.342 16.919 31 10.583 19.675
      7 6.429 18.307 32 10.326 15.507
      8 12.802 23.685 33 16.839 16.919
      9 8.540 19.675 34 6.909 15.507
      10 22.429 24.996 35 6.907 14.067
      11 11.372 19.675 36 12.618 19.675
      12 5.183 19.675 37 6.800 16.919
      13 17.601 18.307 38 14.202 15.507
      14 6.665 18.307 39 9.716 19.675
      15 7.673 19.675 40 6.614 16.919
      16 7.120 16.919 41 3.263 18.307
      17 7.215 15.507 42 3.184 16.919
      18 4.503 16.919 43 3.574 14.067
      19 4.571 16.919 44 3.670 18.307
      20 4.358 19.675 45 2.802 2.802
      21 9.690 19.675 46 1.818 15.507
      22 7.428 18.307 47 3.433 14.067
      23 12.829 19.675 48 1.249 15.507
      24 11.080 22.362 49 3.346 15.507
      25 10.360 15.507 50 2.768 14.067

      Table 2.  $ {x}^{2} $ test results of Weibull distribution

    • 各赤松纯林临时样地Weibull分布3参数结果表明:位置参数分布范围为5.10~6.60。尺度参数分布范围为9.66~16.25,即赤松纯林胸径分布中心在9.66 ~16.25 cm。形状参数分布范围为1.76~4.65,其中45个样地c值属于$ \text{1.00} < c < \text{3.60} $,占样地总数的90.00%,胸径结构表现为正偏山状分布,即赤松劣势、中小胸径林木居多;45号样地c值为3.61,胸径结构近似正态分布;19号、40号、46号和47号样地c值分别为4.65,4.48,3.98和4.30,均大于3.60,胸径结构表现为负偏山状分布(表3)。

      样地编号
      Plot number
      DIabcD0D1D2D3D4
      1 37.67 5.20 11.19 2.16 13.42 9.99 15.26 8.52 9.76
      2 37.96 5.30 15.30 3.23 12.32 11.38 15.94 8.14 12.77
      3 36.64 5.10 10.53 2.31 10.35 9.70 12.87 7.26 8.58
      4 38.46 5.10 10.31 2.82 10.16 5.65 11.93 10.07 10.17
      5 36.21 5.10 13.53 3.10 13.12 12.36 17.23 5.10 13.13
      6 36.00 5.20 12.82 2.71 12.41 11.18 15.29 7.99 12.49
      7 36.84 5.10 12.25 2.44 11.95 11.44 13.67 8.04 10.59
      8 38.19 5.40 16.25 2.39 15.58 14.92 20.83 11.74 15.08
      9 37.70 5.50 12.34 2.12 12.13 11.96 17.20 7.55 12.74
      10 42.31 5.10 13.77 1.76 13.42 12.83 16.67 7.20 17.54
      11 34.29 5.70 13.69 2.53 13.24 13.01 21.00 12.80 14.40
      12 35.42 5.20 14.41 2.45 13.84 12.49 17.90 8.53 12.11
      13 39.22 5.30 12.35 2.36 12.32 11.38 15.94 8.14 12.77
      14 38.89 5.10 11.77 2.21 11.77 11.50 13.52 8.40 12.50
      15 37.80 5.70 15.15 2.86 14.46 14.16 16.48 9.29 14.58
      16 36.93 5.50 13.43 3.00 12.94 12.90 14.50 7.76 13.56
      17 36.27 5.30 12.97 3.44 12.55 12.37 13.55 7.20 12.55
      18 32.00 5.80 12.36 2.68 11.87 11.46 16.30 6.15 11.94
      19 25.00 6.40 16.25 4.65 15.80 14.20 19.37 13.06 15.18
      20 37.50 5.40 13.18 2.42 12.71 11.12 17.47 8.40 10.83
      21 35.94 5.30 14.52 2.76 13.74 11.94 19.14 7.72 15.83
      22 37.02 5.50 14.80 3.29 14.31 14.25 15.05 9.60 16.11
      23 37.88 6.00 12.58 2.29 12.21 11.50 14.87 8.33 15.25
      24 31.25 5.10 15.94 2.59 15.06 12.88 19.85 8.95 15.96
      25 34.13 5.10 11.35 2.77 11.13 10.82 14.12 8.66 11.63
      26 35.42 5.10 10.79 2.46 10.69 9.29 15.75 7.93 10.40
      27 40.68 5.20 11.47 2.59 11.29 10.54 15.00 9.14 12.61
      28 37.93 5.10 11.11 2.61 10.92 10.11 13.70 8.95 11.34
      29 41.85 5.10 12.42 2.70 12.02 11.24 16.37 7.93 14.42
      30 35.81 5.10 14.25 2.76 13.71 12.55 17.29 9.08 15.93
      31 38.30 5.20 11.56 2.04 11.41 11.31 13.75 5.60 14.63
      32 37.50 5.30 12.27 2.89 12.32 11.38 15.94 8.14 12.77
      33 40.00 5.30 9.66 1.84 12.32 11.38 15.94 8.14 12.77
      34 35.38 5.10 11.10 2.62 10.84 10.77 14.50 9.40 10.19
      35 35.71 5.10 9.93 2.44 9.95 9.79 13.17 6.00 9.69
      36 39.62 5.10 10.95 1.87 10.92 9.17 18.41 6.93 9.31
      37 37.12 6.60 12.22 3.27 11.98 11.47 15.66 7.03 12.55
      38 36.11 5.30 12.39 3.13 12.32 11.38 15.94 8.14 12.77
      39 35.19 5.60 14.08 2.67 13.58 11.81 18.17 9.17 13.56
      40 26.67 6.00 15.74 4.48 15.30 13.90 18.10 9.38 15.65
      41 38.89 5.10 10.23 1.88 10.33 9.12 14.98 7.70 9.66
      42 38.08 5.20 10.40 2.12 10.40 9.75 15.87 6.55 11.22
      43 37.50 5.20 11.28 2.96 11.19 10.47 14.56 7.20 11.94
      44 35.71 5.10 12.23 2.32 11.74 11.47 20.80 5.85 12.64
      45 35.71 5.60 12.03 3.61 11.93 11.01 15.31 8.47 12.35
      46 33.13 5.80 13.18 3.98 12.85 12.18 15.16 6.10 15.16
      47 31.98 5.20 12.73 4.30 12.45 11.54 15.88 6.76 12.76
      48 33.80 5.10 11.76 2.79 11.40 9.96 14.62 7.94 12.29
      49 38.21 5.10 9.71 2.23 9.92 9.09 12.52 7.85 10.85
      50 36.81 5.10 11.71 3.33 11.42 10.76 13.73 6.80 12.94
        注:D0D1D2D3D4计量单位均为cm。
        Note: The measurement units of D0, D1, D2, D3 and D4 are cm.

      Table 3.  The DBH characteristics and disease index of shoot blight in Pinus densiflora pure forest

      赤松纯林临时样地胸径特征指标结果表明:赤松平均胸径分布范围为9.92 ~15.80 cm,感病赤松平均胸径分布范围为5.65~14.92 cm,未感病赤松平均胸径分布范围为11.93~21.00 cm,最大病级赤松平均胸径分布范围为5.10~13.06 cm,最小病级赤松平均胸径分布范围为8.58~ 17.54 cm。将感病和未感病赤松平均胸径以及最大病级和最小病级赤松平均胸径进行方差分析后发现,感病赤松平均胸径与未感病赤松平均胸径间存在极显著差异(F(1,98)=142.279,p<0.01),且各样地未感病赤松平均胸径均大于感病赤松平均胸径;最大病级赤松平均胸径与最小病级赤松平均胸径间存在极显著差异(F(1,98)=160.907,p<0.01),各样地最小病级赤松平均胸径均大于最大病级赤松平均胸径(表3)。即在赤松纯林中,胸径较大的赤松林木更不易出现枯梢病症状,而胸径较小的赤松林木更易遭受枯梢病病原菌侵袭。

    • 将赤松枯梢病病情指数与各个胸径结构特征指标进行相关性分析结果表明:赤松枯梢病病情指数与各胸径指标相关系数由大到小依次为形状参数、尺度参数、感病赤松平均胸径、赤松平均胸径、未感病赤松平均胸径、位置参数、最小病级赤松平均胸径、最大病级赤松平均胸径,即形状参数与赤松枯梢病病情关系最为密切(表4)。

      变量
      Variable
      相关性检验
      Correlation test
      DIabcD0D1D2D3D4
      DIr1.000−0.193−0.340*−0.544**−0.280*−0.297*−0.215−0.076−0.106
      p0.1790.0160.0000.0490.0360.1340.6020.462
      ar1.0000.504**0.356*0.540**0.542**0.353*0.2180.433**
      p0.0000.0110.0000.0000.0120.1280.002
      br1.0000.434**0.902**0.878**0.633**0.325*0.767**
      p0.0020.0000.0000.0000.0210.000
      cr1.0000.323*0.319*0.0010.1360.311*
      p0.0220.0240.9970.3460.028
      D0r1.0000.874**0.654**0.381**0.745**
      p0.0000.0000.0060.000
      D1r1.0000.551**0.2660.801**
      p0.0000.0620.000
      D2r1.0000.1890.486**
      p0.1890.000
      D3r1.0000.191
      p0.185
      D4r1.000
      p
        注:r为Spearman秩相关系数,p为双尾显著性检验结果。
        Note: r is Spearman rank correlation coefficient, and p is the two-tail significance test result.

      Table 4.  Correlation coefficient in term of DBH characteristics and disease index of shoot blight in Pinus densiflora pure forest

      赤松枯梢病病情指数与未感病赤松平均胸径、最大病级赤松平均胸径和最小病级赤松平均胸径呈负相关,但检验结果为不显著;与尺度参数、赤松平均胸径和感病赤松平均胸径呈显著负相关(p<0.05),与形状参数呈极显著负相关(p<0.01)(表4)。并且与赤松枯梢病病情指数呈显著或极显著负相关关系的胸径特征指标均表现出一种随各胸径指标减小病情指数增加的趋势(图25)。各胸径结构指标间相关性分析还发现位置参数与形状参数呈显著正相关(p<0.05),与尺度参数、赤松平均胸径、感病赤松平均胸径呈极显著正相关(p<0.01)(表4),而与位置参数显著或极显著正相关关系的4个胸径结构特征指标又均与赤松枯梢病病情指数呈显著或极显著负相关,即位置参数与枯梢病病情指数存在间接显著负相关,随位置参数减小,病情指数逐渐增加(图1)。

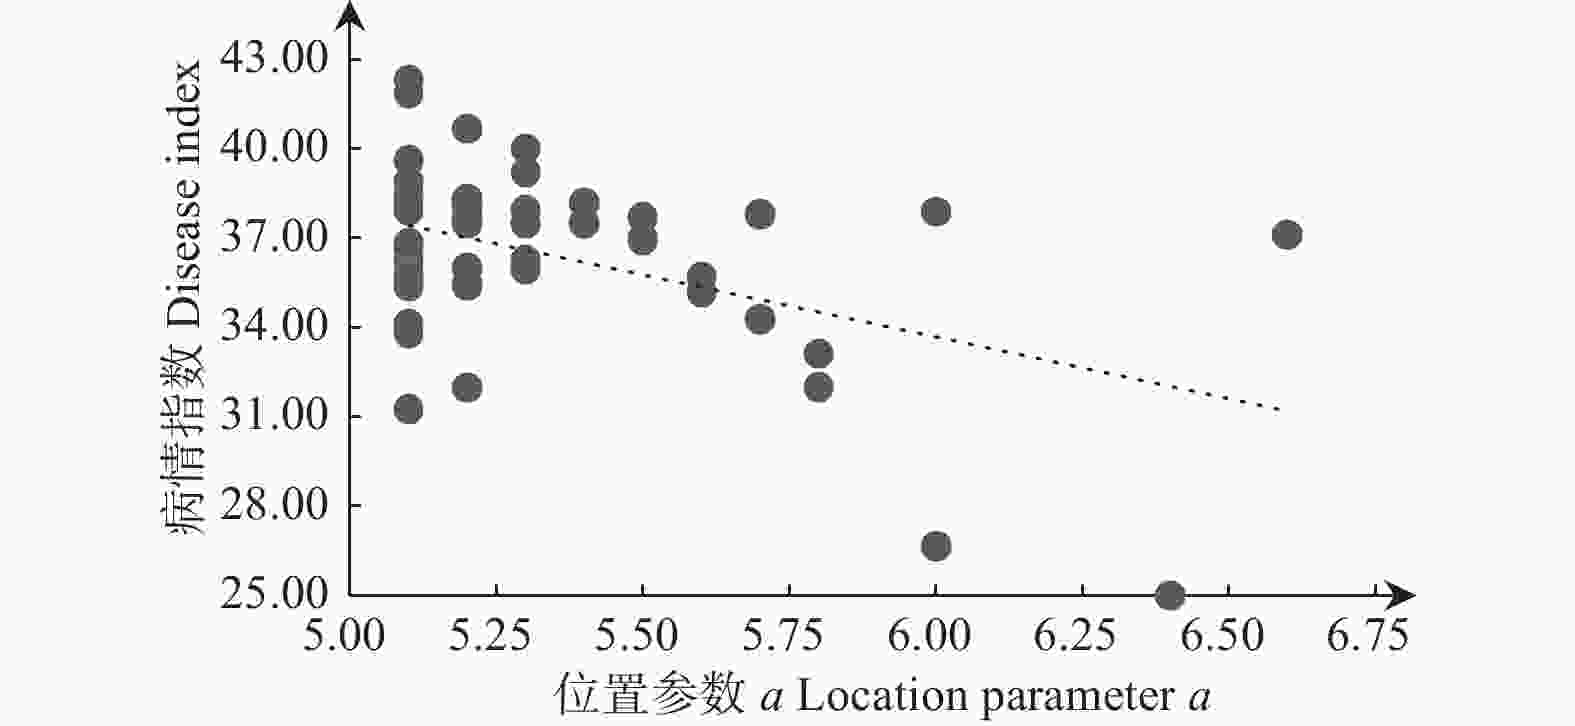
      Figure 1.  The relationship between location parameters of Pinus densiflora DBH distribution and disease index of shoot blight

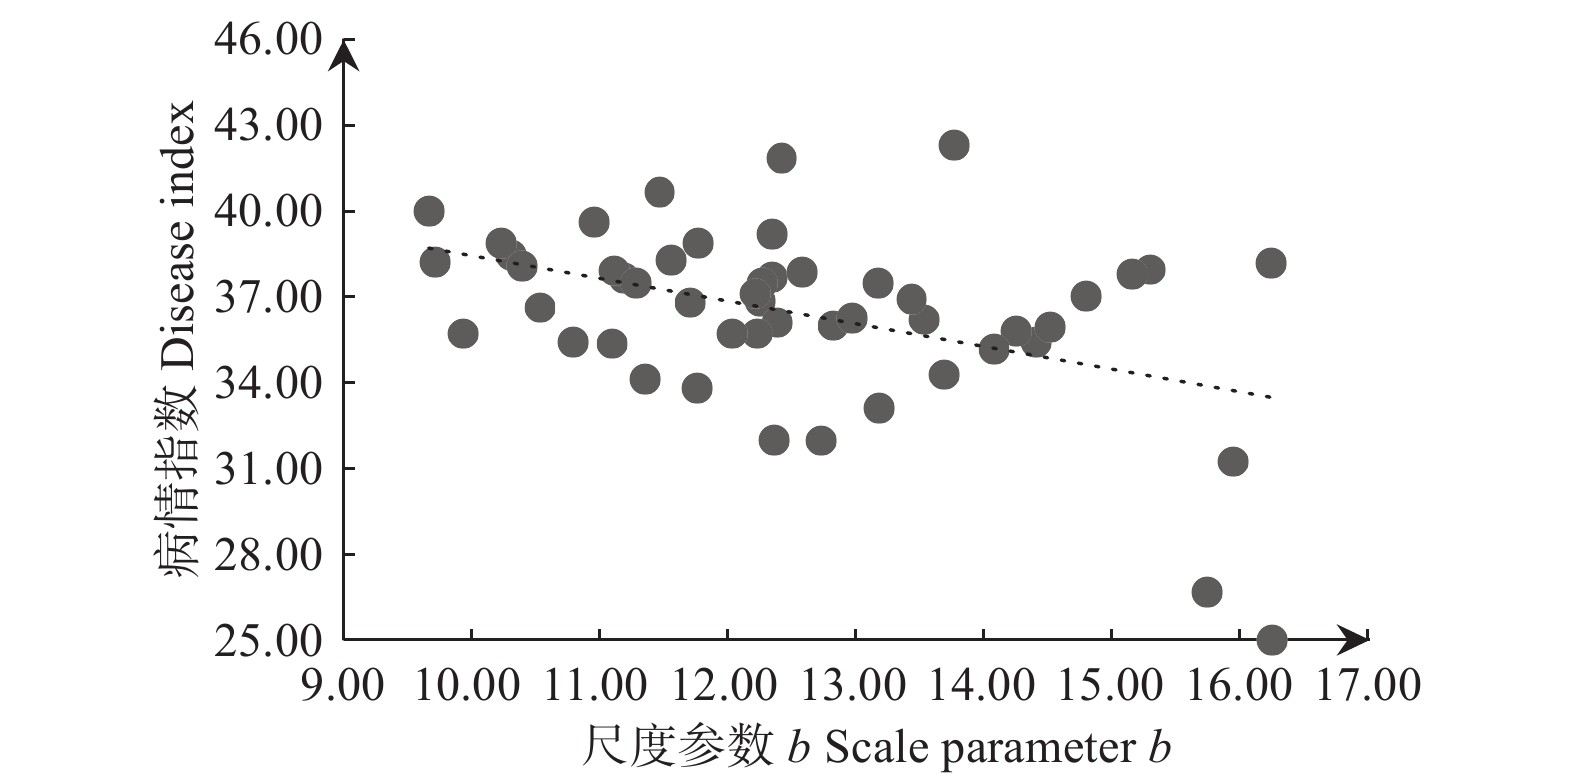
      Figure 2.  The relationship between scale parameters of Pinus densiflora DBH distribution and disease index of shoot blight

      Figure 3.  The relationship between shape parameters of Pinus densiflora DBH distribution and disease index of shoot blight

      Figure 4.  The relationship between average DBH of Pinus densiflora and disease index of shoot blight

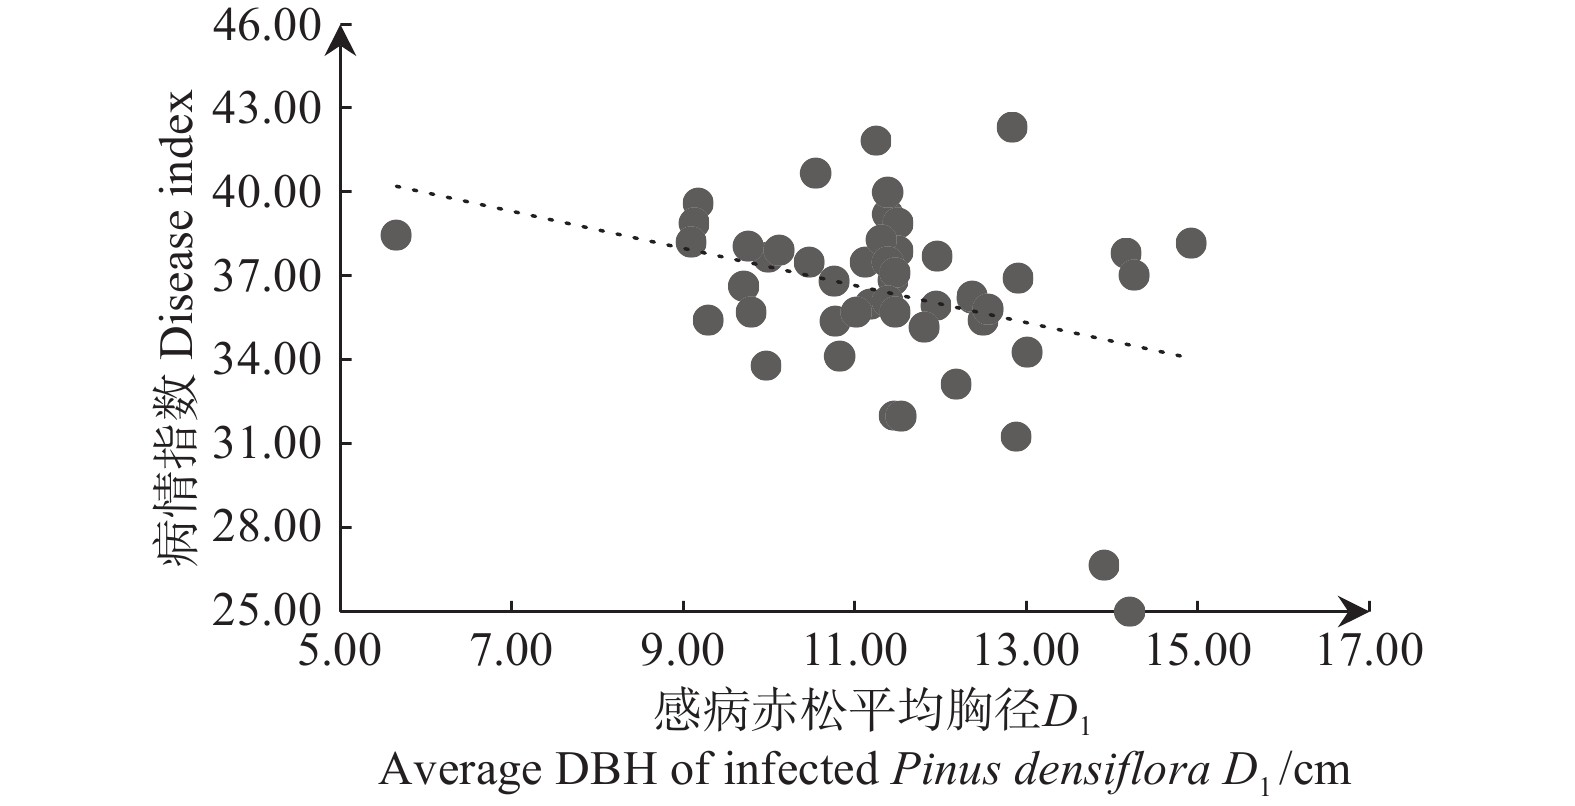
      Figure 5.  The relationship between average DBH of infected Pinus densiflora and disease index of shoot blight

    4.   讨论
    • 赤松纯林胸径分布模型的选择和建立,对研究胸径结构和病害的相关关系具有重要意义。关于同龄纯林树木胸径结构拟合方法有很多种,如正态分布、Weibull分布、Γ分布、β分布和Sb分布等。其中,Weibull分布因其灵活性高、适应性强特点,既可以拟合不同偏度、峰度的单峰山状曲线,又能够拟合反J型递减曲线[16,18-21]常被用来构建林分直径胸径分布模型。在华北落叶松(Larix principis-rupprechtii Mayr.)人工林、中亚热带天然阔叶林、东北红豆杉(Taxus cuspidata Sieb. et Zucc.)针阔混交林、欧洲山毛榉(Fagus sylvatica L.)等林分进行直径分布模拟时,Weibull分布均表现出较优的拟合效果[22-25]。因此该方法被选择应用于赤松纯林胸径结构拟合。目前Weibull分布参数求解方法尚未统一,常用的有最大似然估计法、最小二乘法、矩法和百分位法等[20]。但多项研究表明最大似然估计法参数求解精度较高,能够较好地预测林分胸径分布[20,25-27],基于这一发现,本研究在应用Weibull分布拟合胸径结构时使用了最大似然估计法进行迭代求解,尽可能保证赤松纯林胸径结构拟合模型的准确性。

      本研究发现赤松胸径分布形状参数与枯梢病病情指数呈极显著负相关关系。形状参数越大,其峰值逐渐从正偏过渡到负偏,林木优势木逐渐增多,并且胸径结构分布集中,有利于增强赤松的抗病性;而形状参数正偏,林内劣势木增多,对病害抵抗力降低,有利于病害的流行[11]。昆嵛山赤松纯林胸径结构主要为正偏山状分布,林内中小胸径林木居多,受枯梢病病原菌侵染风险较高,可通过间伐调整林分结构,增加林内优势木比重,提高林分整体抗性。

      赤松胸径分布尺度参数与枯梢病病情指数呈显著负相关关系。随着尺度参数逐渐增加,赤松胸径分布中心增大,竞争压力减轻,挤压现象减弱,光照、空间等资源较为充足,枯梢病病情指数较低;而尺度参数较小时,赤松胸径分布中心较小,资源竞争增强,枯梢病病情指数较高[11,18,28]。可通过间伐等森林经营措施降低赤松胸径分化程度,减轻赤松竞争压力,间接提高林木对病害的抵抗力。

      赤松平均胸径与枯梢病病情指数呈显著负相关关系,这一结果可能是由于林木胸径平均水平较高时,林木较为粗壮,对病害抵抗能力较强。感病赤松平均胸径同样与枯梢病病情指数呈显著负相关关系,感病赤松胸径越小,枯梢病病情指数越高。这可能是由于感病赤松胸径较小时抗逆性较差,受病原菌侵染威胁较大,并且病害严重到一定程度时感病林木也会成为新的侵染源,危害其它抗逆性较差的弱小赤松,导致林分病害加重[11-12]。此外,本研究还发现赤松胸径分布位置参数与枯梢病病情指数存在间接的负相关关系,原因可能在于位置参数代表各样地赤松最小胸径,其值越小,出现极端偏小胸径赤松分布概率越高,而这些小胸径赤松生存条件较差,对病害抵抗能力较弱,极易感染发病,同时也会成为侵染源促进病害的流行。因此在昆嵛山赤松纯林中,可通过抚育间伐小胸径赤松,特别是感病小胸径赤松,控制枯梢病的发生与发展。

    5.   结论
    • Weibull分布能够较好地拟合赤松纯林胸径结构。赤松纯林枯梢病病情指数与胸径结构分布中心、胸径结构分布形状、赤松平均胸径和感病赤松平均胸径结构指标存在显著或极显著负相关,与所测赤松最小胸径存在间接显著负相关。因此,可采取抚育间伐等森林经营措施增加林内优势木比重,降低赤松胸径分化程度,减少感病小胸径赤松,达到赤松枯梢病生态调控的目的。

Reference (28)

Catalog

    /

    DownLoad:  Full-Size Img  PowerPoint
    Return
    Return