• 中国中文核心期刊
  • 中国科学引文数据库(CSCD)核心库来源期刊
  • 中国科技论文统计源期刊(CJCR)
  • 第二届国家期刊奖提名奖
Volume 35 Issue 2
Mar.  2022
Article Contents
Turn off MathJax

Citation:

Relationship between Leaf Biomass and Radial Growth of Larix olgensis Based on Pipe Model Theory

  • Corresponding author: SUN Yu-jun, sunyj@bjfu.edu.cn
  • Received Date: 2021-06-28
    Accepted Date: 2021-08-16
  • Objective To understand the relationship between leaf biomass and radial growth of Larix olgensis in Xiaoxing'anling Mountains. Method The relationship between leaf biomass and radial growth at individual tree level and at different direction interval of individual tree was studied based on pipe model theory, and the correlation between crown distribution and radial growth was analyzed. Result Leaf biomass was significantly and positively correlated with stem diameter, basal area and sapwood area at breast height and height to crown base, as well as basal area growth in recent 1 , 2 , 3 and 5 years, and the leaf biomass model using breast height basal area as a predictor had the best fitting effect. The leaf biomass in different direction interval of a single tree was significantly positively correlated with the stem radius and basal area at the corresponding DBH and the height to crown base, and the growth of basal area in recent 1, 2, 3 and 5 years. Conclusion When estimating the leaf biomass per tree, the basal area of breast height is the best predictor. The leaf biomass of different direction interval in a individual tree is significantly and positively correlated with the stem radius, basal area and basal area growth of corresponding directions, and there is a certain correlation between crown displacement and pith eccentricity.
  • 加载中
  • [1]

    Shinozaki K, Yoda K, Hozumi K, et al. A quantitative analysis of plant form-the pipe model theory: II. Further evidence of the theory and its application in forest ecology[J]. Japanese Journal of Ecology, 1964, a,14(4): 133-139.
    [2] 刘 盛, 李国伟. 基于管道模型理论的树形结构分析[J]. 东北林业大学学报, 2006, 34(6):15-16. doi: 10.3969/j.issn.1000-5382.2006.06.006

    [3] 马钦彦, 刘 胜, 刘志刚. 树形管道模型原理[J]. 北京林业大学学报, 1991, 13(3):84-91.

    [4] 刘 盛, 张友祥, 李 想, 等. 管道模型和树木年轮水分输导模式的理论及在落叶松生产力估测中的应用[J]. 北京林业大学学报, 2021, 43(3):18-26.

    [5]

    Shinozaki K, Yoda K, Hozumi K, et al. A quantitative analysis of plant form-the pipe model theory: I. Basic analyses[J]. Japanese Journal of Ecology, 1964, b,14(3): 97-105.
    [6]

    Hagihara A, Yokota T, Ogawa K. Allometric Relations in Hinoki[J]. Bull Nagoya Univ For, 1993, 12: 11-29.
    [7]

    Ogawa K, Adu-Bredu S, Yokota T, et al. Leaf biomass changes with stand development in hinoki cypress (Chamaecyparis obtusa [Sieb. et Zucc. ] Endl. )[J]. Plant Ecology, 2010, 211(1): 79-88. doi: 10.1007/s11258-010-9774-1
    [8]

    Berninger F, Coll L, Vanninen P, et al. Effects of tree size and position on pipe model ratios in Scots pine[J]. Canadian Journal of Forest Research, 2005, 35(6): 1294-1304. doi: 10.1139/x05-055
    [9]

    Sumida A, Nakai T, Yamada M, et al. Ground-based estimation of leaf area index and vertical distribution of leaf area density in a Betula ermanii forest[J]. Silva Fennica, 2009, 43(5): 799-816.
    [10]

    Waring R H, Schroeder P E, Oren R. Application of the pipe model theory to predict canopy leaf area[J]. Canadian Journal of Forest Research, 1982, 12(3): 556-560. doi: 10.1139/x82-086
    [11]

    Lehnebach R, Beyer R, Letort V, et al. The pipe model theory half a century on: a review[J]. Annals of Botany, 2018, 121(5): 773-795. doi: 10.1093/aob/mcx194
    [12]

    Ogawa K. Mathematical consideration of the pipe model theory in woody plant species[J]. Trees-Structure and Function, 2015, 29(3): 695-704. doi: 10.1007/s00468-014-1147-2
    [13]

    Sattler D F, Comeau P G. Crown allometry and application of the pipe model theory to white spruce (Picea glauca (Moench) Voss) and aspen (Populus tremuloides Michx. ) in the western boreal forest of Canada[J]. Canadian Journal of Forest Research, 2016, 46(2): 262-273. doi: 10.1139/cjfr-2015-0165
    [14]

    Wang Y P, Jarvis P G. Influence of crown structural properties on PAR absorption, photosynthesis, and transpiration in Sitka spruce: application of a model (MAESTRO)[J]. Tree Physiology, 1990, 7: 297-316. doi: 10.1093/treephys/7.1-2-3-4.297
    [15]

    Zhang X Q, Xu D. Eco-physiological modelling of canopy photosynthesis and growth of a Chinese fir plantation[J]. Forest Ecology and Management, 2003, 173(1): 201-211.
    [16] 张小全, 赵茂盛, 徐德应. 杉木中龄林树冠叶面积密度空间分布及季节变化[J]. 林业科学研究, 1999, 12(6):612-619.

    [17]

    Gao H, Dong L, Li F. Modeling variation in crown profile with tree status and cardinal directions for planted Larix olgensis Henry trees in Northeast China[J]. Forests, 2017, 8(5): 139-154. doi: 10.3390/f8050139
    [18]

    Marshall J D, Rehfeldt G E, Monserud R A. Family differences in height growth and photosynthetic traits in three conifers[J]. Tree Physiology, 2001, 21(11): 727-734. doi: 10.1093/treephys/21.11.727
    [19] 刘 盛, 郝广明, 拱化国, 等. 应用管道模型原理估测华北落叶松叶量叶面积的方法[J]. 吉林林学院学报, 1993(2):28-35.

    [20] 克累默尔, 考兹洛夫斯基. 木本植物生理学[M]. 北京: 中国林业出版社, 1985.

    [21] 刘 盛, 刘 成. 长白落叶松水分输导模式及叶生物量估测方法[J]. 东北林业大学学报, 2005, 33(5):35-37. doi: 10.3969/j.issn.1000-5382.2005.05.013

    [22]

    Shinozaki K, Yoda K, Hozumi K, et al. A quantitative analysis of plant form: the pipe model theory. II. Further evidence of the theory and its application in forest ecology[J]. Japanese Journal of Ecology, 1964, c,14: 133-139.
    [23]

    Joseph K. Estimation of the amount of foliage of trees and stands[J]. Journal of Forestry, 1944(12): 905-912.
    [24]

    Zalamea P C, Sarmiento C, Stevenson P R, et al. Effect of rainfall seasonality on the growth of Cecropia sciadophylla: intra-annual variation in leaf production and node length[J]. Journal of Tropical Ecology, 2013, 29(4): 361-365. doi: 10.1017/S0266467413000394
    [25]

    Stark N M. Tropical trees and forests: an architectural analysis[J]. Tropical Trees & Forests An Architectural Analysis, 1978, 68(1): 340.
    [26]

    Baldwin V C. Is sapwood area a better predictor of loblolly pine crown biomass than bole diameter?[J]. Biomass, 1989, 20(3): 177-185.
    [27]

    Snell J A K, Brown J K. Notes: Comparison of tree biomass estimators-DBH and sapwood area[J]. Forest Science, 1978, 24(4): 455-457.
    [28]

    Osawa A. Effects of mechanical stresses and photosynthetic production on stem form development of Populus maximowiczii[J]. Annals of Botany, 1993, 71(6): 489-494. doi: 10.1006/anbo.1993.1065
    [29]

    Valentine H T, Makela A, Green E J, et al. Models relating stem growth to crown length dynamics: application to loblolly pine and Norway spruce[J]. Trees-Structure and Function, 2012, 26(2): 469-478. doi: 10.1007/s00468-011-0608-0
    [30]

    Alméras T, Thibaut A, Gril J. Effect of circumferential heterogeneity of wood maturation strain, modulus of elasticity and radial growth on the regulation of stem orientation in trees[J]. Trees-Structure and Function, 2005, 19(4): 457-467. doi: 10.1007/s00468-005-0407-6
    [31]

    Medhurst J, Ottenschlaeger M, Wood M, et al. Stem eccentricity, crown dry mass distribution, and longitudinal growth strain of plantation-grown Eucalyptus nitens after thinning[J]. Canadian Journal of Forest Research, 2011, 41(11): 2209-2218. doi: 10.1139/x11-135
    [32]

    Uemura A, Harayama H, Koike N, et al. Coordination of crown structure, leaf plasticity and carbon gain within the crowns of three winter-deciduous mature trees[J]. Tree Physiology, 2006, 26(5): 633-641. doi: 10.1093/treephys/26.5.633
  • 加载中
通讯作者: 陈斌, bchen63@163.com
  • 1. 

    沈阳化工大学材料科学与工程学院 沈阳 110142

  1. 本站搜索
  2. 百度学术搜索
  3. 万方数据库搜索
  4. CNKI搜索

Figures(5) / Tables(4)

Article views(3787) PDF downloads(69) Cited by()

Proportional views

Relationship between Leaf Biomass and Radial Growth of Larix olgensis Based on Pipe Model Theory

    Corresponding author: SUN Yu-jun, sunyj@bjfu.edu.cn
  • Key Laboratory of Forest Resources & Environmental Management of National Forestry and Grassland Administration, Beijing Forestry University, Beijing 100083, China

Abstract:  Objective To understand the relationship between leaf biomass and radial growth of Larix olgensis in Xiaoxing'anling Mountains. Method The relationship between leaf biomass and radial growth at individual tree level and at different direction interval of individual tree was studied based on pipe model theory, and the correlation between crown distribution and radial growth was analyzed. Result Leaf biomass was significantly and positively correlated with stem diameter, basal area and sapwood area at breast height and height to crown base, as well as basal area growth in recent 1 , 2 , 3 and 5 years, and the leaf biomass model using breast height basal area as a predictor had the best fitting effect. The leaf biomass in different direction interval of a single tree was significantly positively correlated with the stem radius and basal area at the corresponding DBH and the height to crown base, and the growth of basal area in recent 1, 2, 3 and 5 years. Conclusion When estimating the leaf biomass per tree, the basal area of breast height is the best predictor. The leaf biomass of different direction interval in a individual tree is significantly and positively correlated with the stem radius, basal area and basal area growth of corresponding directions, and there is a certain correlation between crown displacement and pith eccentricity.

  • 叶生物量与光截获、蒸腾作用、光合作用直接相关,是决定树木生产力的最重要因素,为了间接估测叶生物量,Shinozaki等提出了一种理论框架[1]:管道模型理论(pipe model theory),管道模型认为,在植物体内,单位数量的管道支持单位数量的叶子,管道不仅具有固定的横截面积,而且通过所有的胞间层从叶子通过树枝、树干伸展到根尖部位,许多这样的管道集合成束,形成一棵完整的树形[2-4]

    根据管道模型理论,给定树种的叶生物量应该与树冠基部的树干横断面积成一定比例[1,5],一些研究已经证明日本扁柏(Chamaecyparis obtusa(Siebold & Zucc.)Endl.)[6-7]、欧洲赤松(Pinus sylvestris Linn.)[8]、白桦(Betula platyphylla Sukaczev)[9]的叶生物量与枝下高树干横断面积成比例。另外有研究表明,叶面积与树干边材面积成比例[10],然而这种比例并非是通用的,也有一些树种存在例外[11-13],管道模型理论对于长白落叶松(Larix olgensis Henry)是否适用,是一个值得研究的问题。对于单株林木而言,关于树叶在树冠内的分布,先前的一些研究一般认为树叶的分布在不同方向间没有差异[14-16],然而在实地调查中发现,树冠半径和树叶的分布在不同方向是有差异的。一些研究表明,分支大小和光合作用特征在不同水平方位是存在差异的,这种差异可能是由光环境的差异和不同方向竞争压力大小的差异造成的[17-18]

    在树干解析的过程中,发现树干半径和径向生长量在不同方向上也存在差异,树冠偏冠与树干髓心偏心是生物量在树冠和树干上的不均匀分布,结合管道模型理论分析单木株内树冠生物量在不同方位的不均匀分布与径向生长周向变异的关系,有助于理解树干生长和树冠结构之间的功能关系,对于理解树木生长发育等生态过程具有重要的意义。

    • 将解析木伐倒后,使用分层标准枝法按1 m分层对标准木的叶生物量进行了测定。测定时,首先按1 m对树干进行分段,使用手锯和枝剪将每段的枝条沿基部截下,现场使用电子秤称取每个枝条的带叶鲜质量,结合每段的平均枝长、平均基径和平均鲜质量,在每段选取2~3个标准枝,称量其带叶鲜质量,然后将标准枝上的枝与叶分离,并分别称取枝和叶鲜质量,而后均匀选取50 g左右的叶样本,记录叶样本的鲜质量,将叶样本带回至实验室,置于烘箱中在105 ℃恒温下烘干2天左右至恒质量,称取记录每个叶样本的干质量即生物量,计算叶样本的含水量,根据现场测定的每层叶鲜质量和该层叶样本的含水率,计算每层的叶生物量,累加后即为该株解析木的叶生物量。

      本研究在黑龙江省伊春市朗乡林业局东折棱河林场共调查获取了31株不同林龄的长白落叶松解析木的叶生物量数据和径向生长量数据,其基本统计指标如表1所示。

      因子
      factor
      平均值
      Mean
      最小值
      minimum
      最大值
      Maximum
      标准差
      SD
      胸径
      DBH/cm
      17.5 9.0 28.2 4.5
      枝下高直径
      DHCB/cm
      11.5 6.4 19.9 2.7
      胸高断面积
      Basal area of BH/cm2
      256.67 63.62 624.58 129.92
      枝下高断面积
      Basal area of HCB/cm2
      108.53 32.17 311.03 52.99
      胸高边材面积
      sapwood area of BH/cm2
      88.64 31.22 170.60 34.63
      胸高断面积近1年生长量
      BAI1 of BH/cm2
      10.44 1.70 44.11 7.80
      胸高断面积近2年生长量
      BAI2 of BH/cm2
      19.65 3.60 73.98 13.16
      胸高断面积近3年生长量
      BAI3 of BH/cm2
      29.04 5.60 96.06 17.51
      胸高断面积近5年生长量
      BAI5 of BH/cm2
      46.39 9.10 128.73 24.99
      枝下高断面积近1年生长量
      BAI1 of HCB/cm2
      8.59 1.90 35.29 5.89
      枝下高断面积近2年生长量
      BAI2 of HCB/cm2
      16.61 3.50 57.89 9.75
      枝下高断面积近3年生长量
      BAI3 of HCB/cm2
      25.20 6.10 75.65 13.17
      枝下高断面积近5年生长量
      BAI5 of HCB/cm2
      41.71 11.00 104.30 18.86
      叶生物量
      Leaf biomass/kg
      4.081 0.640 8.980 2.22

      Table 1.  Descriptive statistics of sampled trees for biomass equations development

    • 在单木株内水平上,将树冠以45°间隔分为北(337.5°, 22.5°)、东北(22.5°, 67.5°)、东(67.5°, 112.5°)、东南(112.5°, 157.5°)、南(157.5°, 202.5°)、西南(202.5°, 247.5°)、西(247.5°, 292.5°)、西北(292.5°, 337.5°) 8个水平区间。

      对标准木进行叶生物量测定时,使用数显角度尺,以正北为0°,量测每个枝条的方位角,在各个区分段内,分别对8个水平区间所有枝条进行称质量。分别选取标准枝,将标准枝上的树叶全部剥离称质量,计算标准枝上树叶的所占比例,而后收集50 g左右的鲜叶样品,将鲜叶样本带回至实验室,置于烘箱中在105 ℃恒温下烘干2天左右至恒质量,称取记录每个叶样本的干质量即生物量,计算叶样本的含水量。根据各个区间的树枝总质量、树叶鲜质量占树枝鲜质量比例、树叶含水率,计算标准木各个方位区间的叶生物量。因为该项工作量较大,只对10株解析木进行了株内不同方位的叶生物量调查,基本信息如表2所示。

      方位区间
      Direction section
      平均值
      Mean
      最小值
      Minimum
      最大值
      Maximum
      标准差
      SD
      胸径
      DBH/cm
      20.4 11.9 28.2 4.1
      树高
      H/m
      20.1 10.2 26.4 4.1
      北区间叶生物量
      North section/kg
      0.567 0.172 1.323 0.404
      东北区间叶生物量
      Northeast section/kg
      0.503 0.225 1.170 0.209
      东区间叶生物量
      East section/kg
      0.718 0.266 1.545 0.453
      东南区间叶生物量
      Southeast section/kg
      0.650 0.245 1.768 0.498
      南区间叶生物量
      South section/kg
      0.854 0.394 2.417 0.735
      西南区间叶生物量
      Southwest section/kg
      0.676 0.119 1.361 0.409
      西区间叶生物量
      West section/kg
      0.708 0.093 1.962 0.629
      西北区间叶生物量
      Northwest section/kg
      0.509 0.138 1.230 0.335

      Table 2.  Descriptive statistics of sampled trees for leaf biomass in different direction

    • 将标准木伐倒后,截取胸高处和枝下高处的圆盘,并在工作面上表明正北方向,将圆盘带回实验室,使用角磨机和砂纸将圆盘工作面打磨抛光至年轮清晰可见,并在工作面上使用铅笔标明北、东北、东、东南、南、西南、西、西北8个方向,而后将圆盘放在扫描仪上使用1200dpi的分辨率扫描成jpg格式的栅格图像,利用WinDENDRO年轮分析系统测定圆盘上8个方向树干半径上的年轮宽度,测定精度为0.01 mm,以此获得圆盘上8个树干半径的长度和各个方向上的年轮宽度。

      分别以8个方向上的树干半径为半径计算1/8的圆面积,将8个树干半径计算的1/8圆面积的和视为该高度的树干断面积。与上述10株解析木不同方位区间叶生物量对应的不同方位区间树干半径、断面积和断面积生长量的基本信息如表3所示。

      高度
      Height
      指标
      Factor
      统计量
      Statistics
      方位区间 Direction interval
      NNEESESSWWNW
      胸高处 At DBH 树干半径 Stem radius/mm Mean 83.8 89.1 88.8 90.3 90.6 82.5 86.8 85.8
      SD 17.8 18.9 17.8 25.1 22.4 17.1 21.7 17.5
      断面积 Basal area/mm² Mean 2873.8 3243.3 3212.7 3426.4 3402.2 2778.7 3128.6 3000.3
      SD 1083.9 1226.9 1128.9 1960.6 1591.8 996.8 1556.5 1087.0
      BAI1/mm2 Mean 99.2 132.2 153.0 111.7 117.6 92.1 108.5 131.6
      SD 83.2 72.5 113.7 64.4 58.2 53.4 56.1 99.9
      BAI2/mm2 Mean 196.3 238.6 270.3 225.9 220.3 179.9 207.8 239.2
      SD 162.5 123.2 177.2 124.3 116.0 110.5 111.9 173.7
      BAI3/mm2 Mean 308.7 367.2 406.1 336.8 336.9 266.4 306.7 361.4
      SD 226.4 197.0 270.2 170.7 171.2 157.1 151.3 244.5
      BAI5/mm2 Mean 601.2 626.7 707.3 587.7 597.1 505.2 533.8 656.5
      SD 372.6 31.9 426.7 248.8 250.2 261.2 225.6 416.5
      枝下高处 At HCB 树干半径 Stem radius/mm Mean 60.9 60.8 59.8 61.2 61.2 59.2 59.4 60.3
      SD 12.3 11.7 10.9 10.8 11.2 10.4 10.1 11.9
      断面积 Basal area/mm2 Mean 1512.3 1500.6 1448.4 1514.6 1519.7 1415.3 1423.2 1479.6
      SD 584.0 555.2 493.8 486.6 519.9 462.7 441.2 551.5
      BAI1/mm2 Mean 93.3 96.9 96.2 109.9 89.7 93.9 93.5 94.2
      SD 49.0 38.1 38.5 43.3 31.4 38.2 40.6 45.0
      BAI2/mm2 Mean 179.9 175.5 181.1 207.1 180.0 175.0 174.0 181.4
      SD 92.5 68.3 71.4 84.0 74.3 68.4 66.8 86.1
      BAI3/mm2 Mean 269.3 261.5 273.1 302.7 281.5 263.4 258.1 272.7
      SD 127.5 100.1 115.7 117.1 108.8 102.6 94 128.8
      BAI5/mm2 Mean 529.5 474.2 487.0 527.4 501.9 492.9 479.1 517.3
      SD 239.9 159.4 184.8 192.1 176.5 176.8 157.1 227.0
        注:BAI1,BAI2,BAI3,BAI5分别为最近1年、2年、3年、5年断面积生长量。
        Note: BAI1, BAI2, BAI3, and BAI5 are the basal area increment in recent 1, 2, 3 and 5 years respectively.

      Table 3.  Basal area and increment of different directions within tree

      在胸高处圆盘上以颜色区分出心材和边材的界限,分别量测8个方向上的心材半径,使用上述计算树干断面积的方法,分别计算得出8个区间的心材面积,使用各个方向上对应的树干断面积减去心材面积,即得出各个方向上的边材面积,将8个方向上的边材面积相加即为胸高处边材面积,由于在枝下高处圆盘上心材和边材的颜色界限不明显,不能根据颜色进行辨别,故只对胸高处的边材面积进行了测量计算。

    • 结合管道模型理论,使用一元线性回归模型分析了胸高处和枝下高处的直径、断面积、胸高边材面积和近n年断面积生长量的关系;由于树木存在树冠偏冠和树干髓心偏心现象,为了探讨这两种现象是否存在关系,结合管道模型理论,分别以长白落叶松株内不同方位区间的叶生物量和对应方向区间的胸高处和枝下高处的树干半径、断面积和断面积近n年生长量进行相关分析。数据处理分析、图形绘制均在R 3.6.5中进行。

    2.   结果与分析
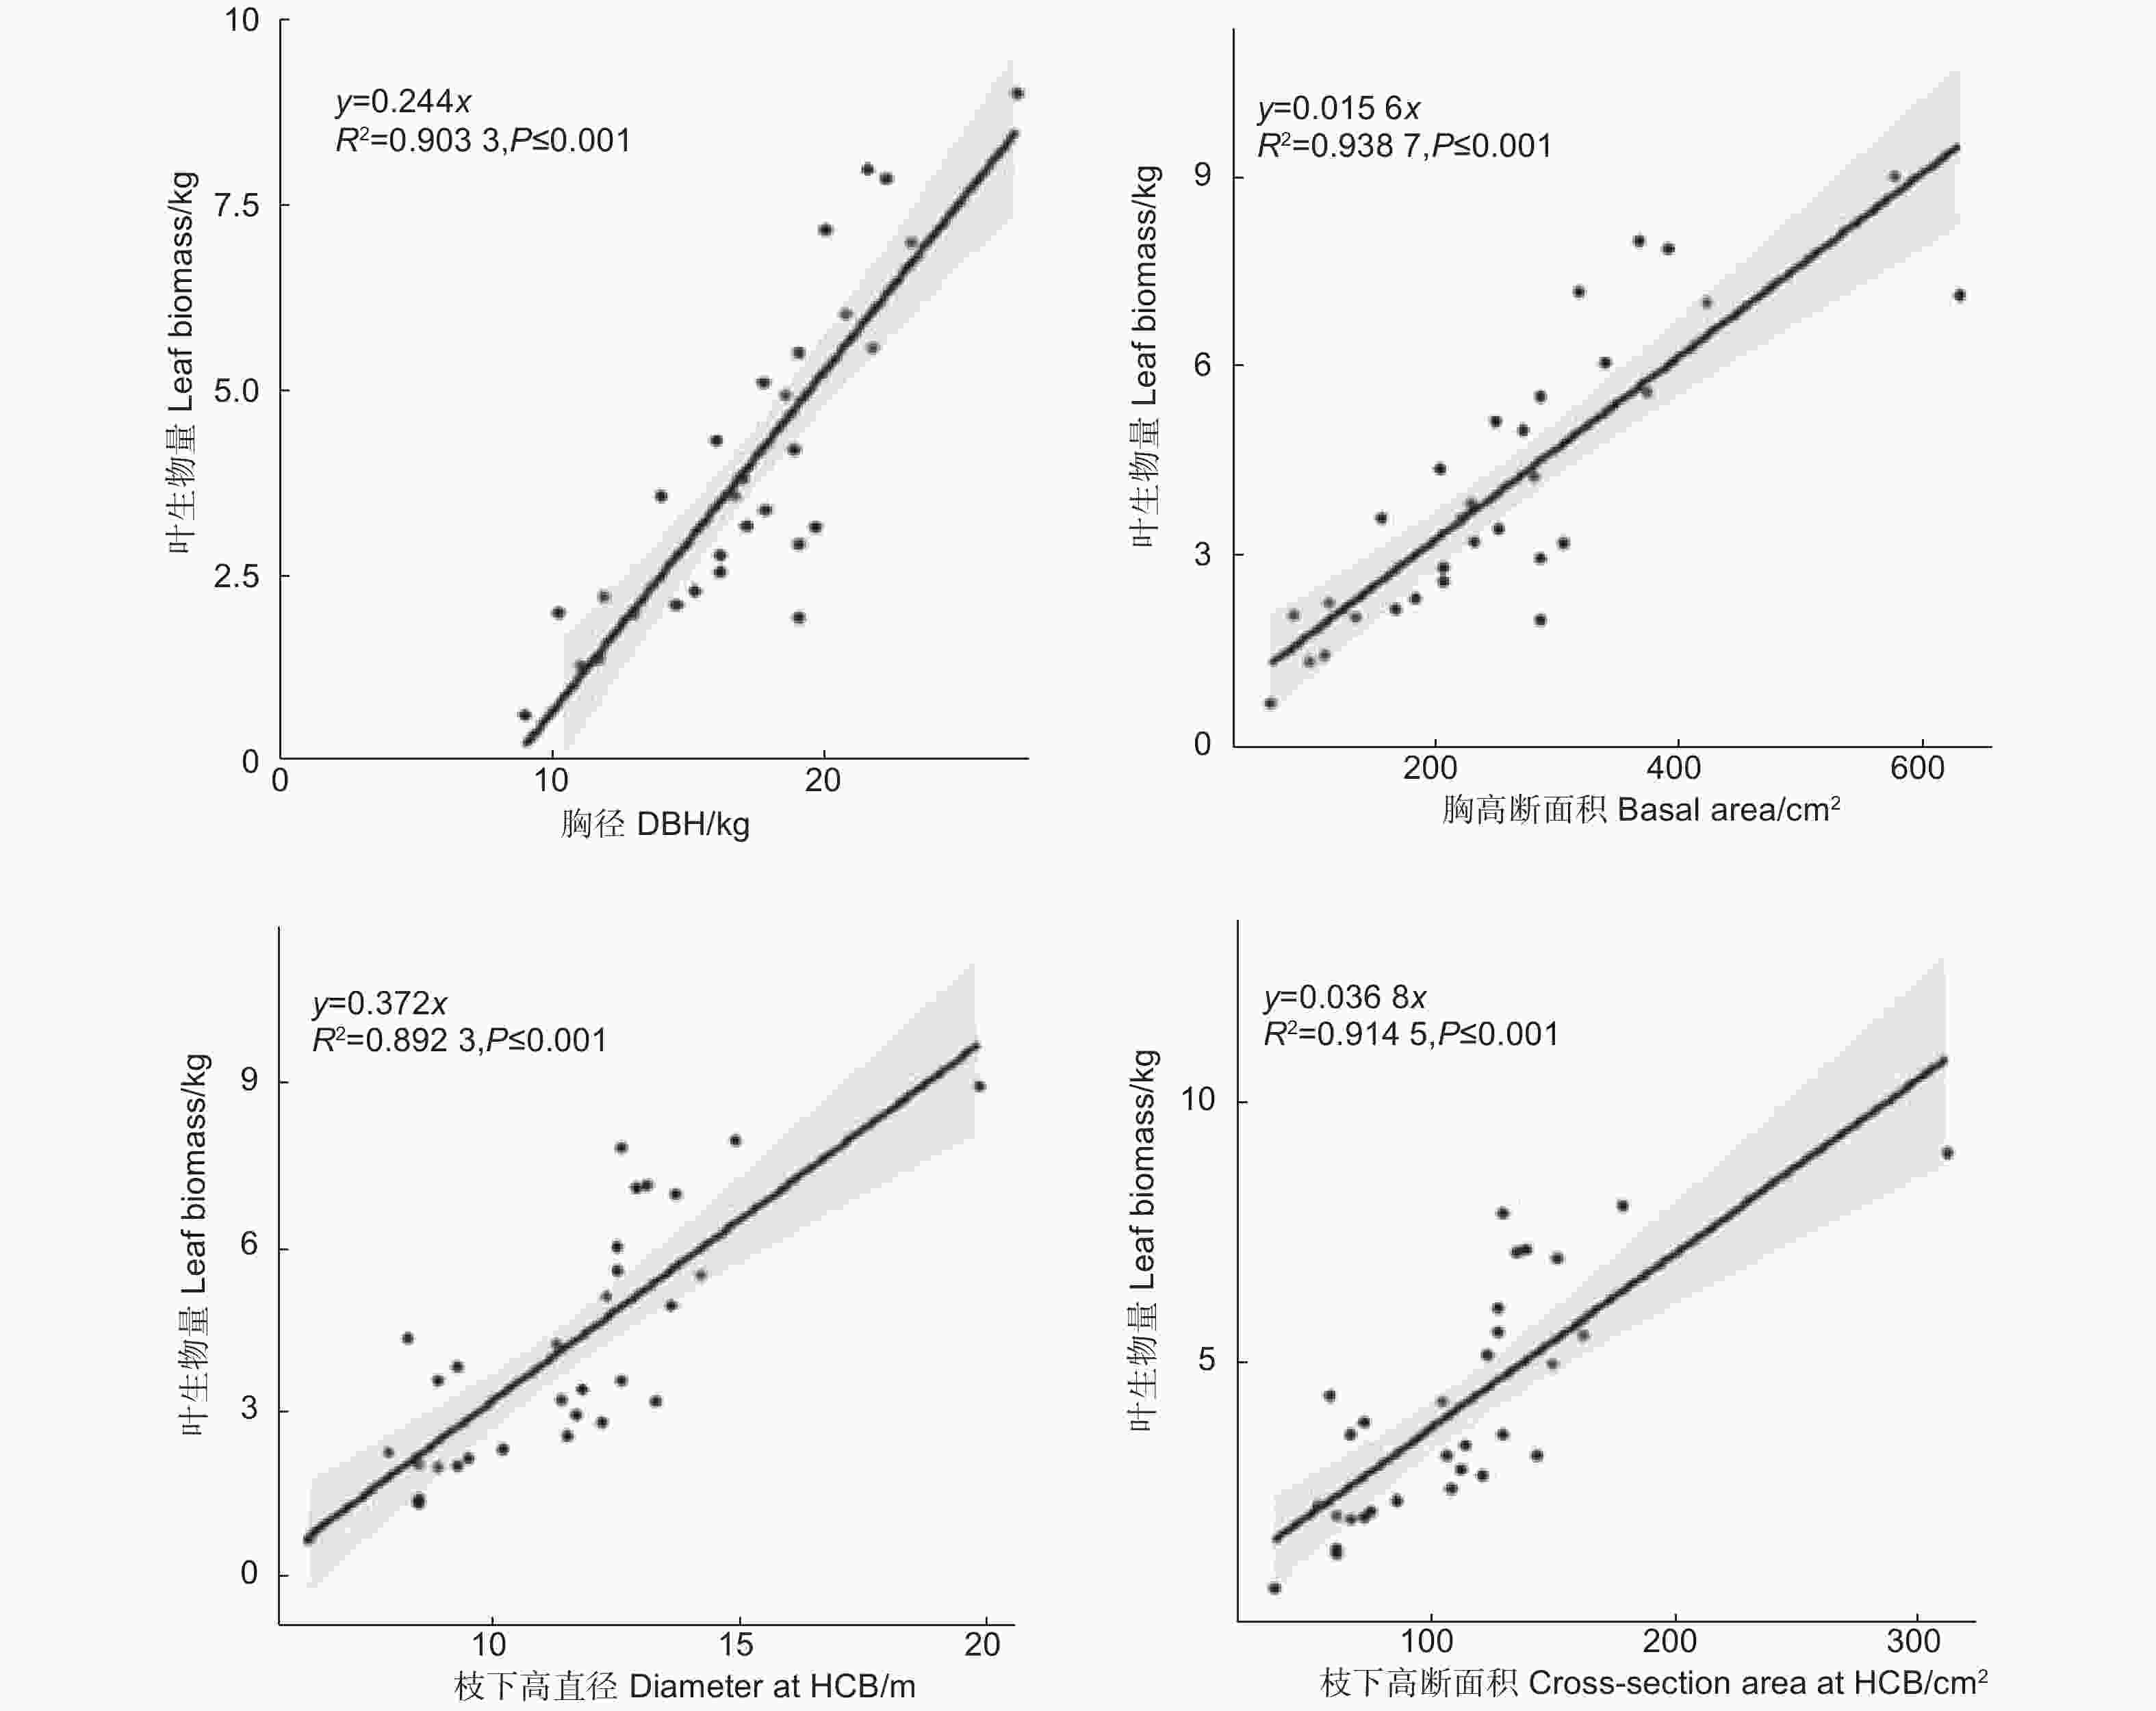
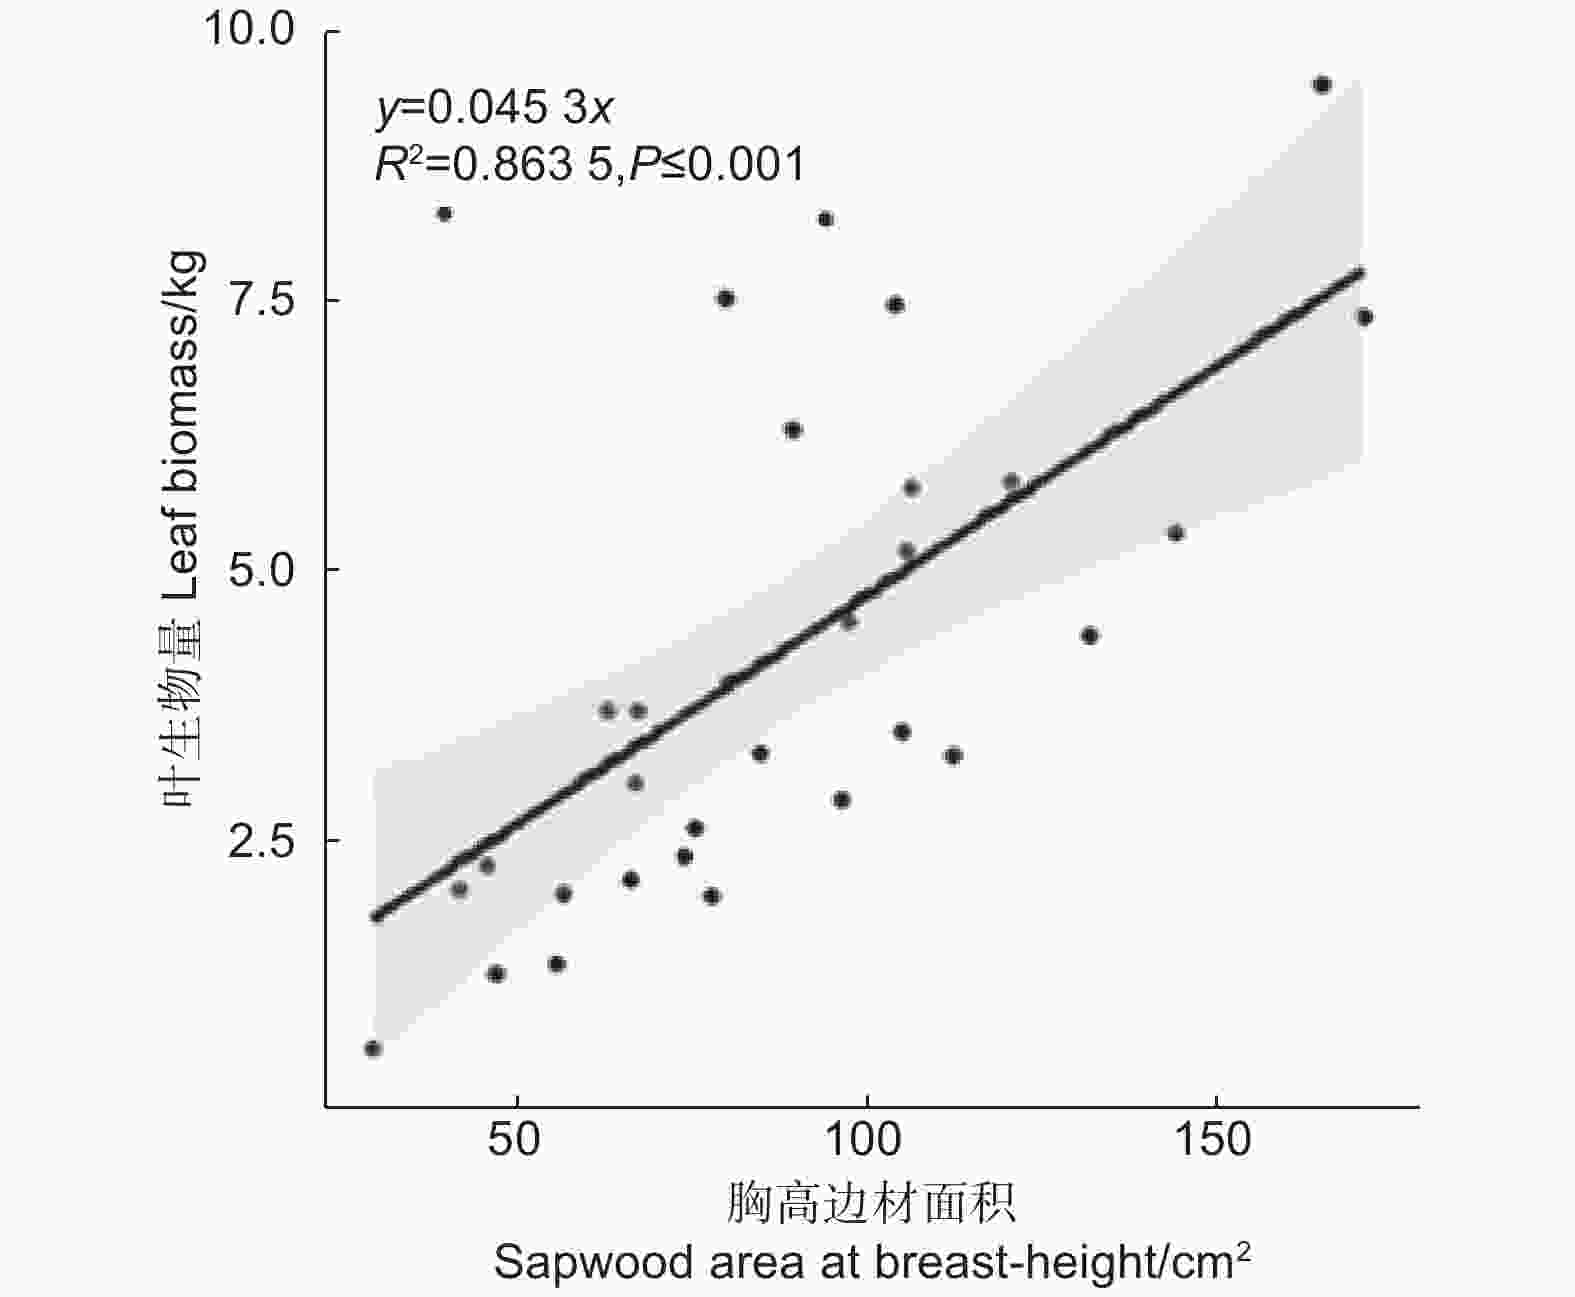
    • 根据管道模型理论的基本原理,单株树木的叶生物量与树干断面积成一定比例关系。本研究绘制了单木叶生物量与胸径、胸高断面积、枝下高直径、枝下高断面积的散点图,并根据散点分布趋势和生物量原理建立了y = ax 的线性关系(图1图2)。

      Figure 1.  The relationship between leaf biomass and diameter and basal area

      Figure 2.  The relationship between leaf biomass and sapwood basal area at breast height

      图1可知,单木胸径和胸高断面积与单木叶生物量均成明显的线性关系,两者的决定系数均达到了0.90以上,其中胸高断面积的决定系数略高于胸径的决定系数。单木枝下高直径和枝下高断面积与单木叶生物量同样均成明显的线性关系,两者的决定系数均达到了0.89以上,其中枝下高断面积的决定系数略高于枝下高直径的决定系数。

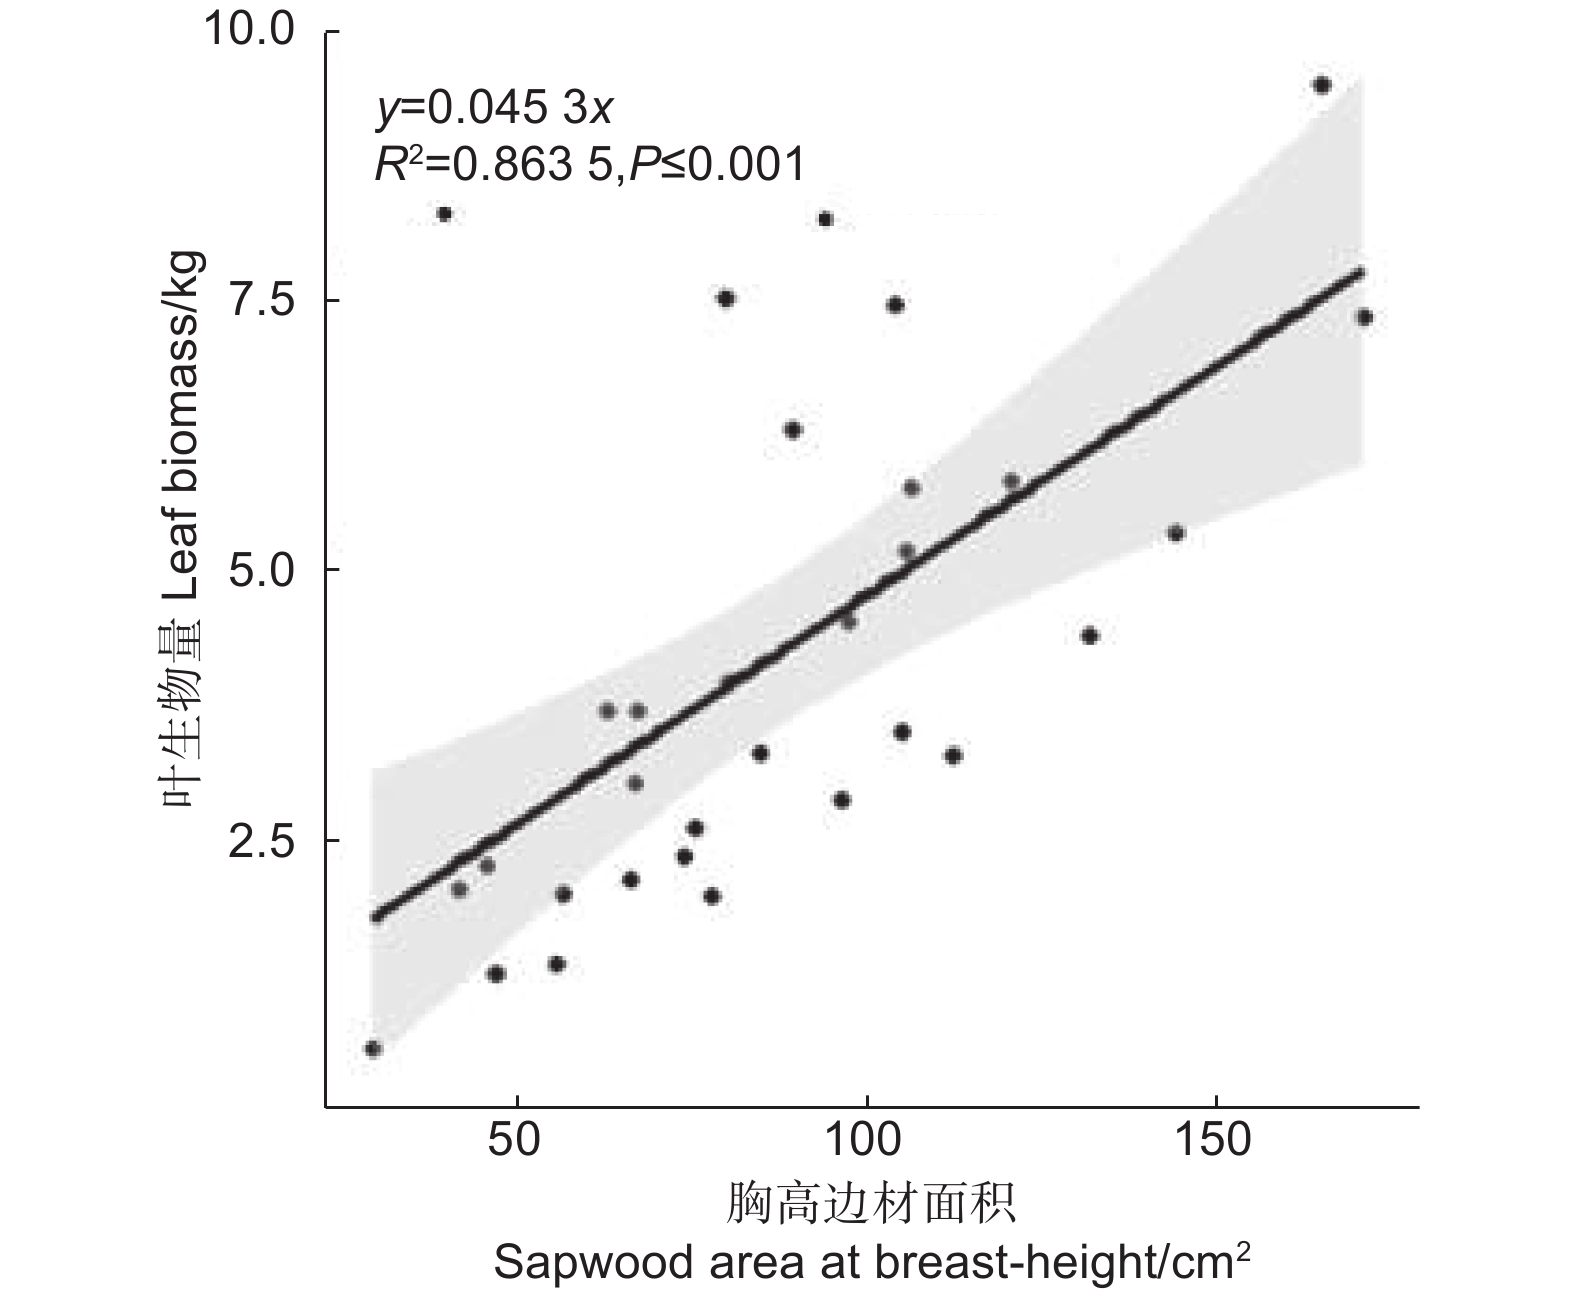
      图2可知,胸高边材面积与叶生物量也呈现明显的线性关系,其决定系数达到0.8635,说明胸高边材与叶生物量存在较好的相关性,不过略低于胸径、胸高断面积、枝下高直径、枝下高断面积的决定系数。本研究中边材是通过颜色差异和心材进行区别的,可能会存在测量误差。根据管道模型理论,树干中任何部位的边材均应与其上方的叶生物量具有良好的相关关系,该结果符合管道模型理论。

    • 对于单木而言,树叶与树干是相互依赖,相互制约的,叶量的多少受到树干运输水分和矿物质能力大小的制约,树干的生长快慢又受到树叶光合作用合成有机物多少的制约[19]。而在树干中,只有边材部分具有输导能力,然而边材与心材的分别一般以颜色来区分,在颜色不明显时,在边材与心材的交界处可能存在辨别误差,并且有学者表明,对于针叶树而言,边材部分靠近心材的部分年轮已不再具备输导能力,树干最外围的一两个年轮起到的输导作用最大[20]。为此,本研究建立了叶生物量与胸高处、枝下高处最近1,2,3,5年断面积生长量之间y = a + bx的线性关系(如图3)。
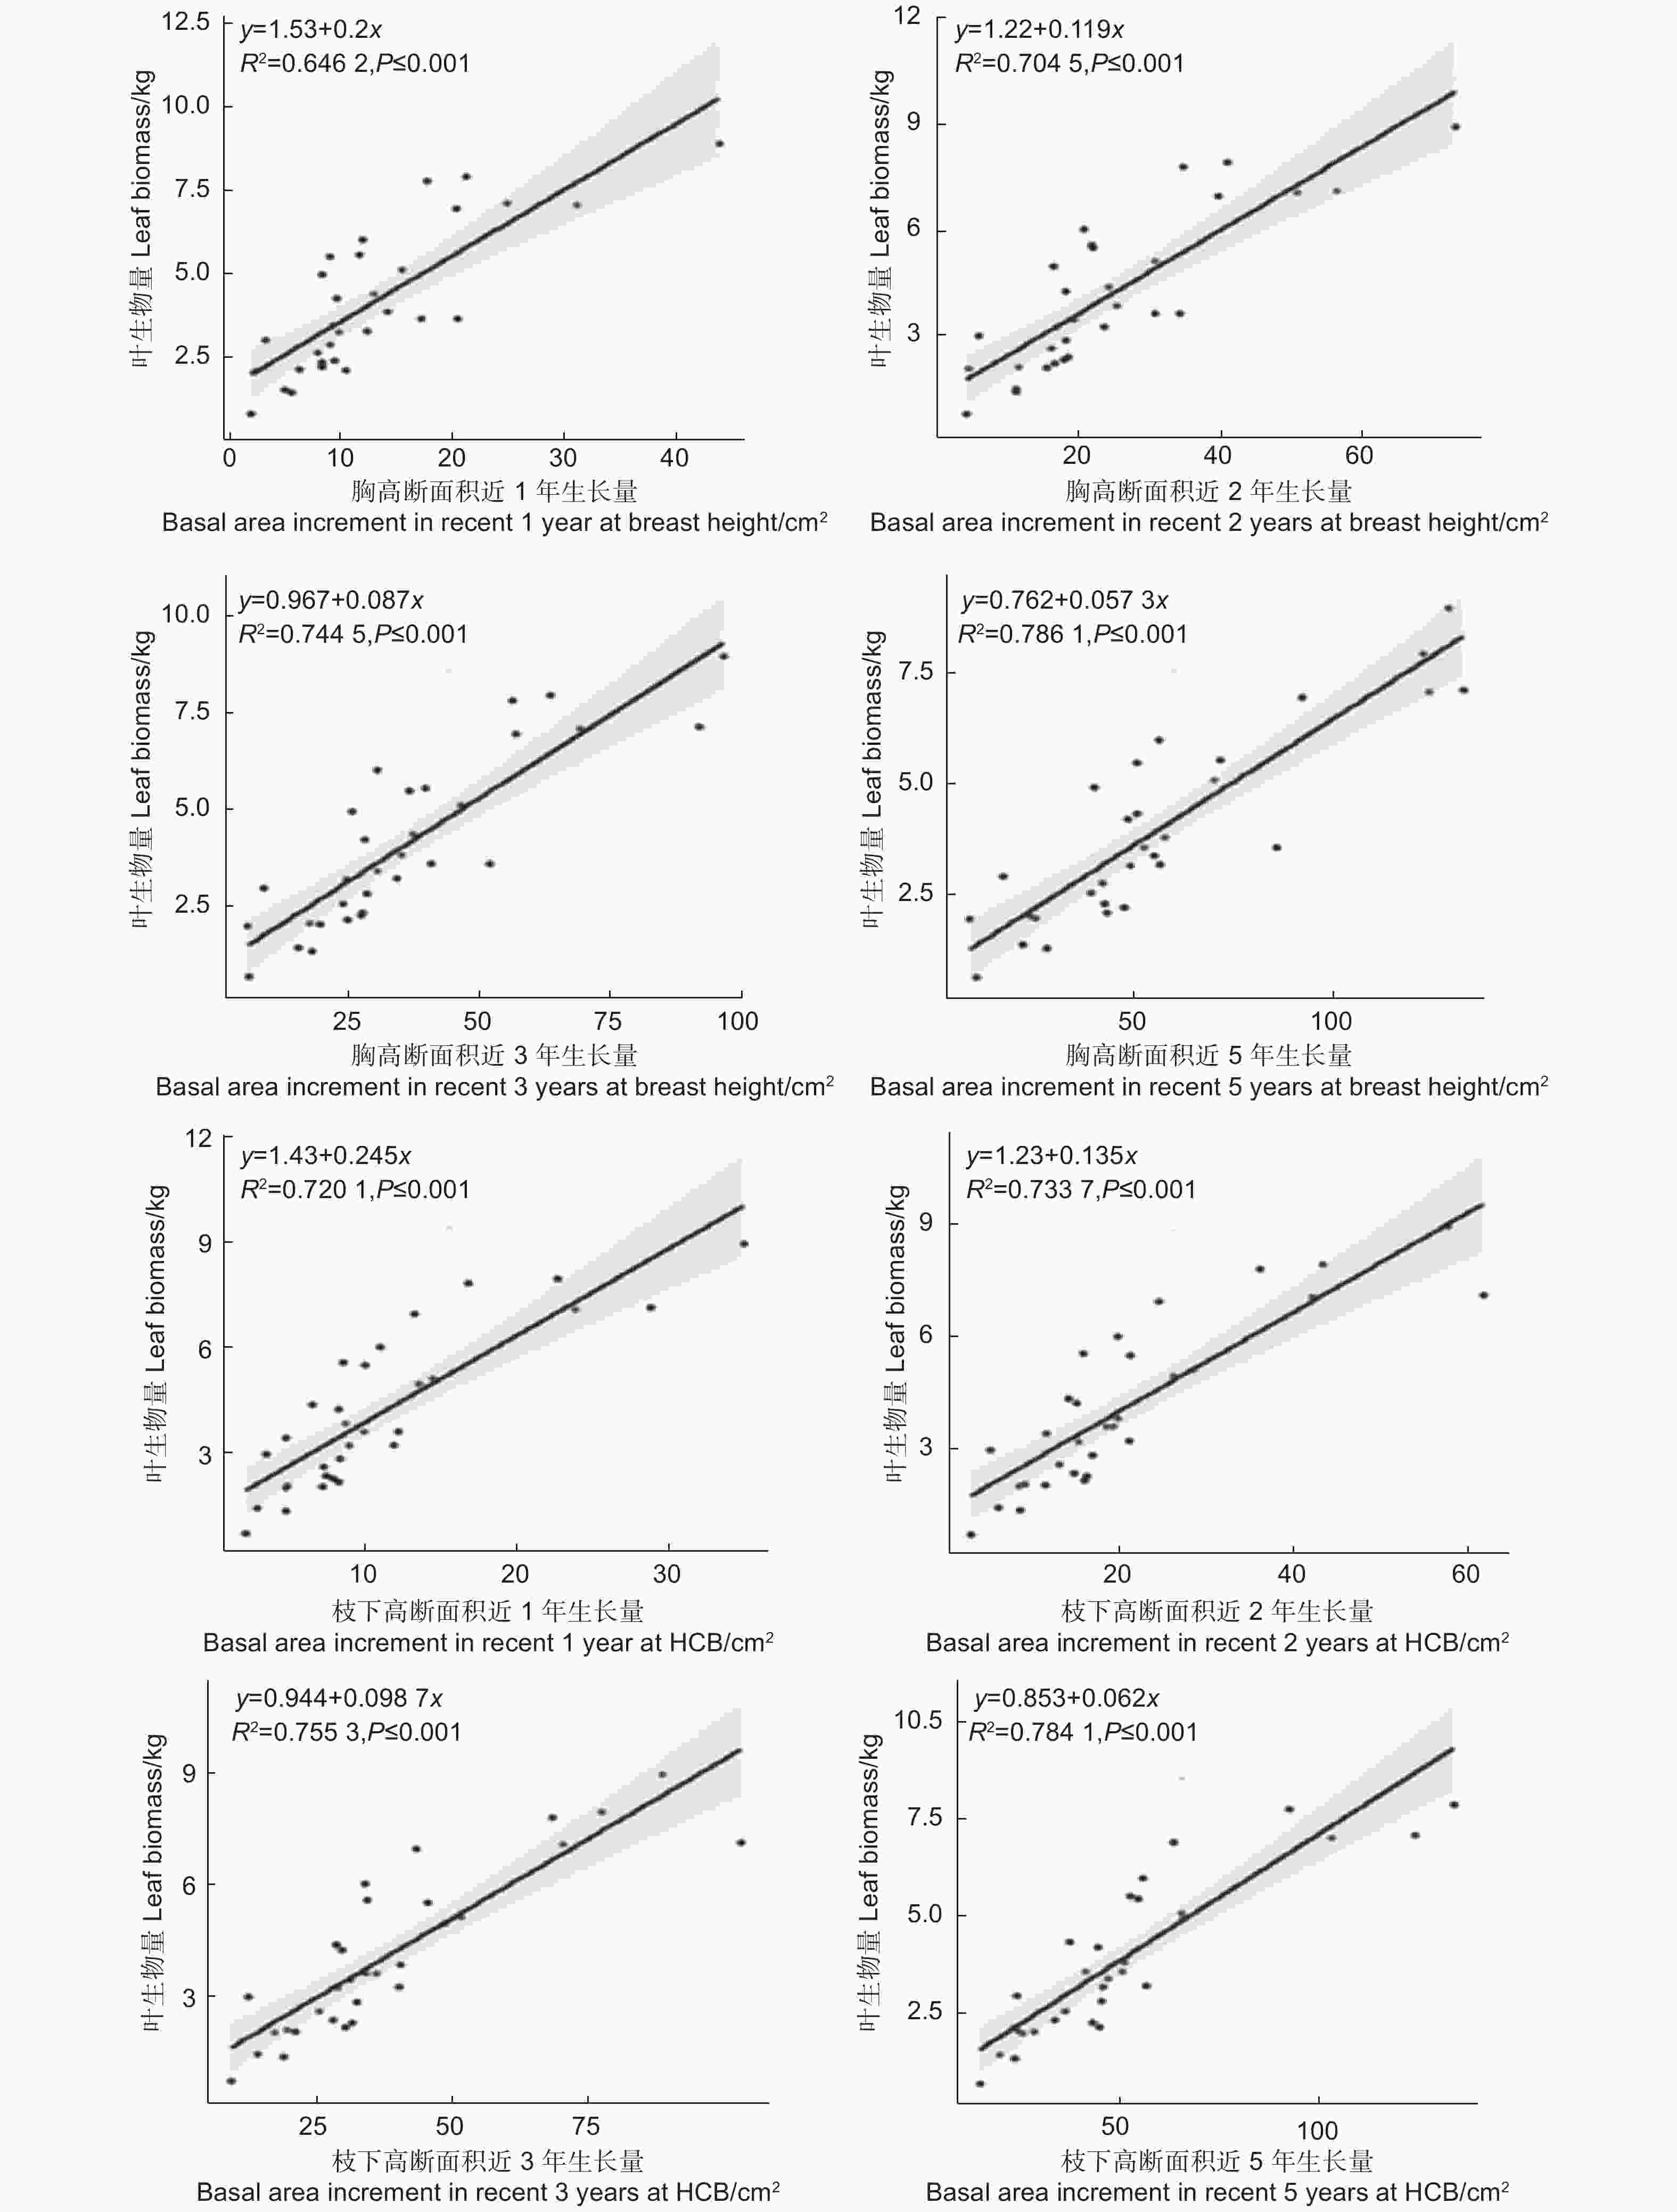
      Figure 3.  The relationship between leaf biomass and basal area increment in recent 1, 2, 3, 5 years at breast height and height to crown base

      图3可知,胸高断面积近1、2、3、5年生长量均与叶生物量呈显著正相关,决定系数在0.64和0.79之间,其中近5年生长量的决定系数最大为0.786 1,然后依次是近3年生长量(0.744 5),近2年生长量(0.704 5),近1年生长量(0.646 2)。枝下高断面积近1、2、3、5年生长量也均与叶生物量呈显著正相关,决定系数在0.72和0.78之间,其中近5年生长量的决定系数最大为0.784 1,然后依次是近3年生长量(0.755 3),近2年生长量(0.733 7),近1年生长量(0.720 1),略高于胸高处断面积生长量的决定系数。

    • 表4可知,株内不同方位叶生物量与胸高处和枝下高处的半径、断面积和近1、2、3、5年断面积生长量均呈显著正相关。总体而言,对应方位树干半径、断面积的相关系数要高于近1、2、3、5年断面积生长量的相关系数。枝下高处树干半径、断面积的相关系数要高于胸高处的,而对于断面积生长量而言,胸高处的相关系数均高于枝下高处的相关系数。

      树干因子  
      Stem factor  
      胸高处
      At DBH
      枝下高处
      at HCB
      半径 Radius 0.543*** 0.573***
      断面积 Basal area 0.533*** 0.577***
      近1年断面积生长量 BAI1 0.607*** 0.523***
      近2年断面积生长量 BAI2 0.656*** 0.565***
      近3年断面积生长量 BAI3 0.676*** 0.568***
      近5年断面积生长量 BAI5 0.725*** 0.580***
        注:***代表在0.001水平上具有统计意义的显著相关性
        Note: *** represents a statistically significant correlation at the level of 0.001

      Table 4.  Correlation coefficients between leaf biomass in different directions and stem radius, basal area and basal area increment in corresponding directions

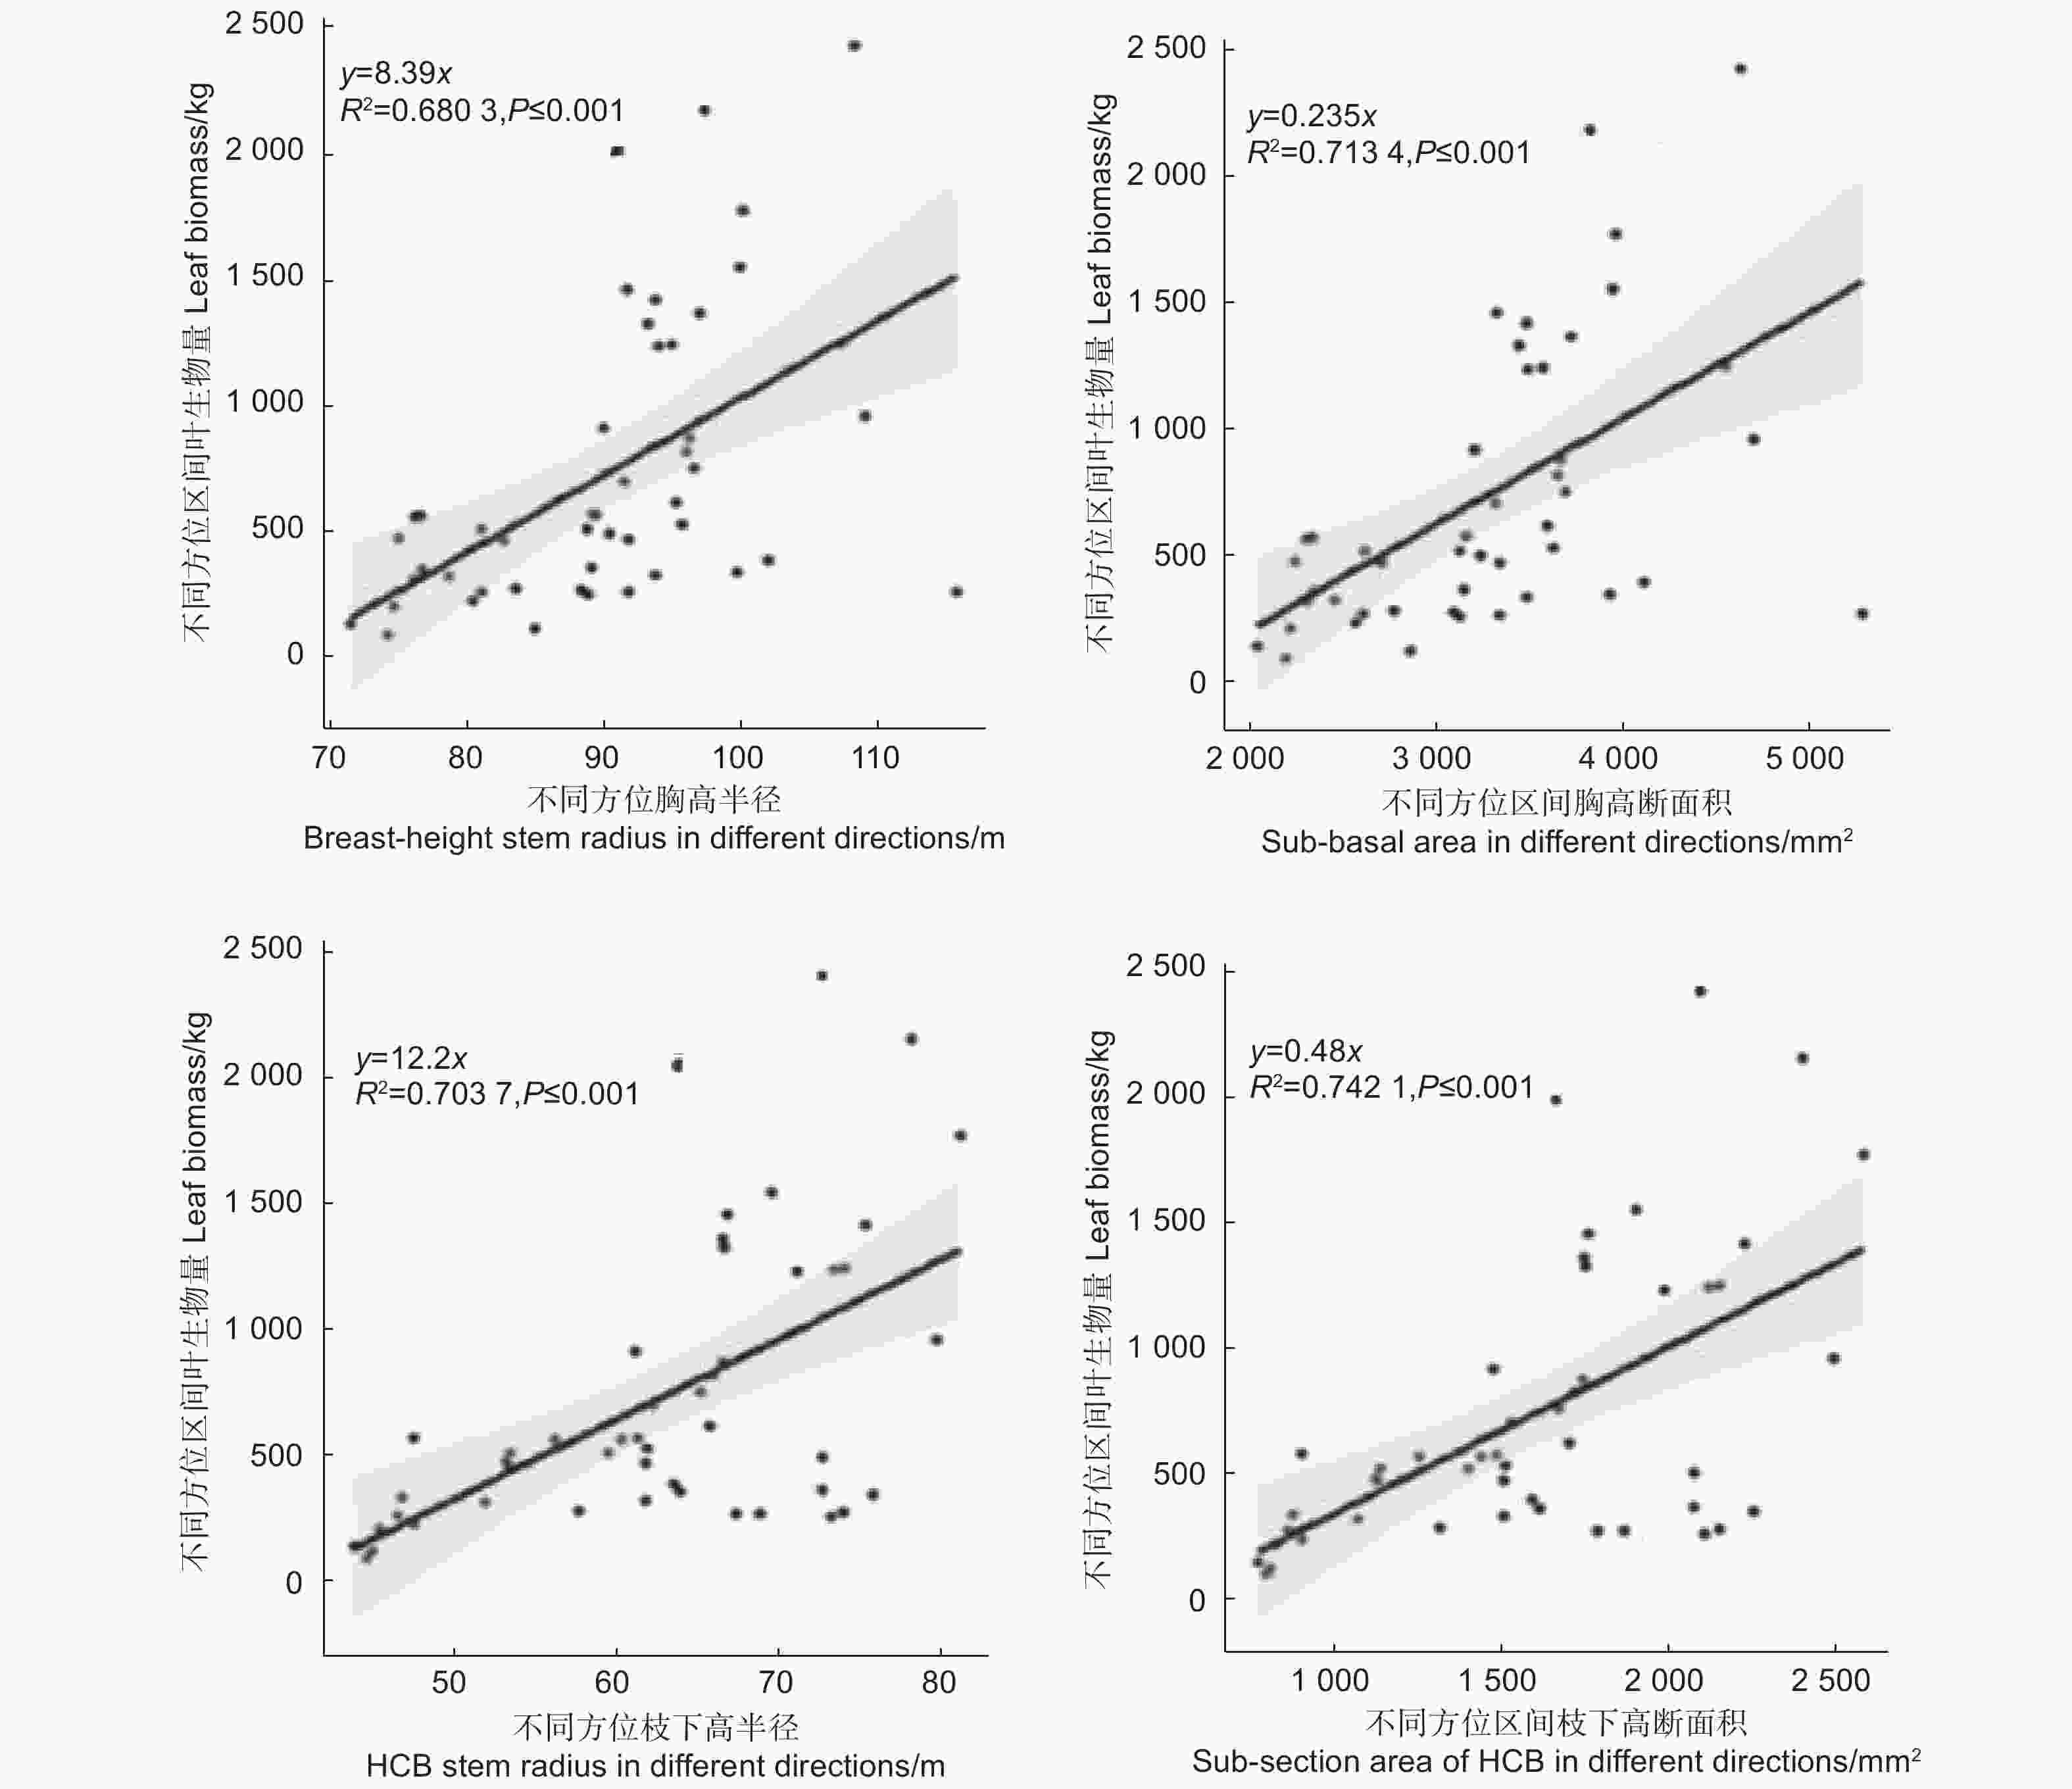
    • 根据管道模型理论的基本原理,单株树木的叶生物量与树干断面积成一定比例关系,本研究将该原理拓展到单木株内不同方位区间上,绘制了不同方位区间叶生物量与对应方位胸高半径、胸高断面积、枝下高半径、枝下高断面积的散点图,并根据散点分布趋势和生物量原理建立了y = ax 的线性关系(图4)。

      Figure 4.  The relationship between leaf biomass and radius and basal area of different orientations

      图4可知,不同方位区间胸高半径和胸高断面积与对应方位区间的叶生物量均成明显的线性关系,两者的决定系数均达到了0.70左右,其中胸高断面积的决定系数略高于胸径的决定系数。不同方位区间枝下高半径径和枝下高断面积与对应方位区间叶生物量同样均成明显的线性关系,两者的决定系数均达到了0.70以上,其中枝下高断面积的决定系数略高于枝下高半径的决定系数。

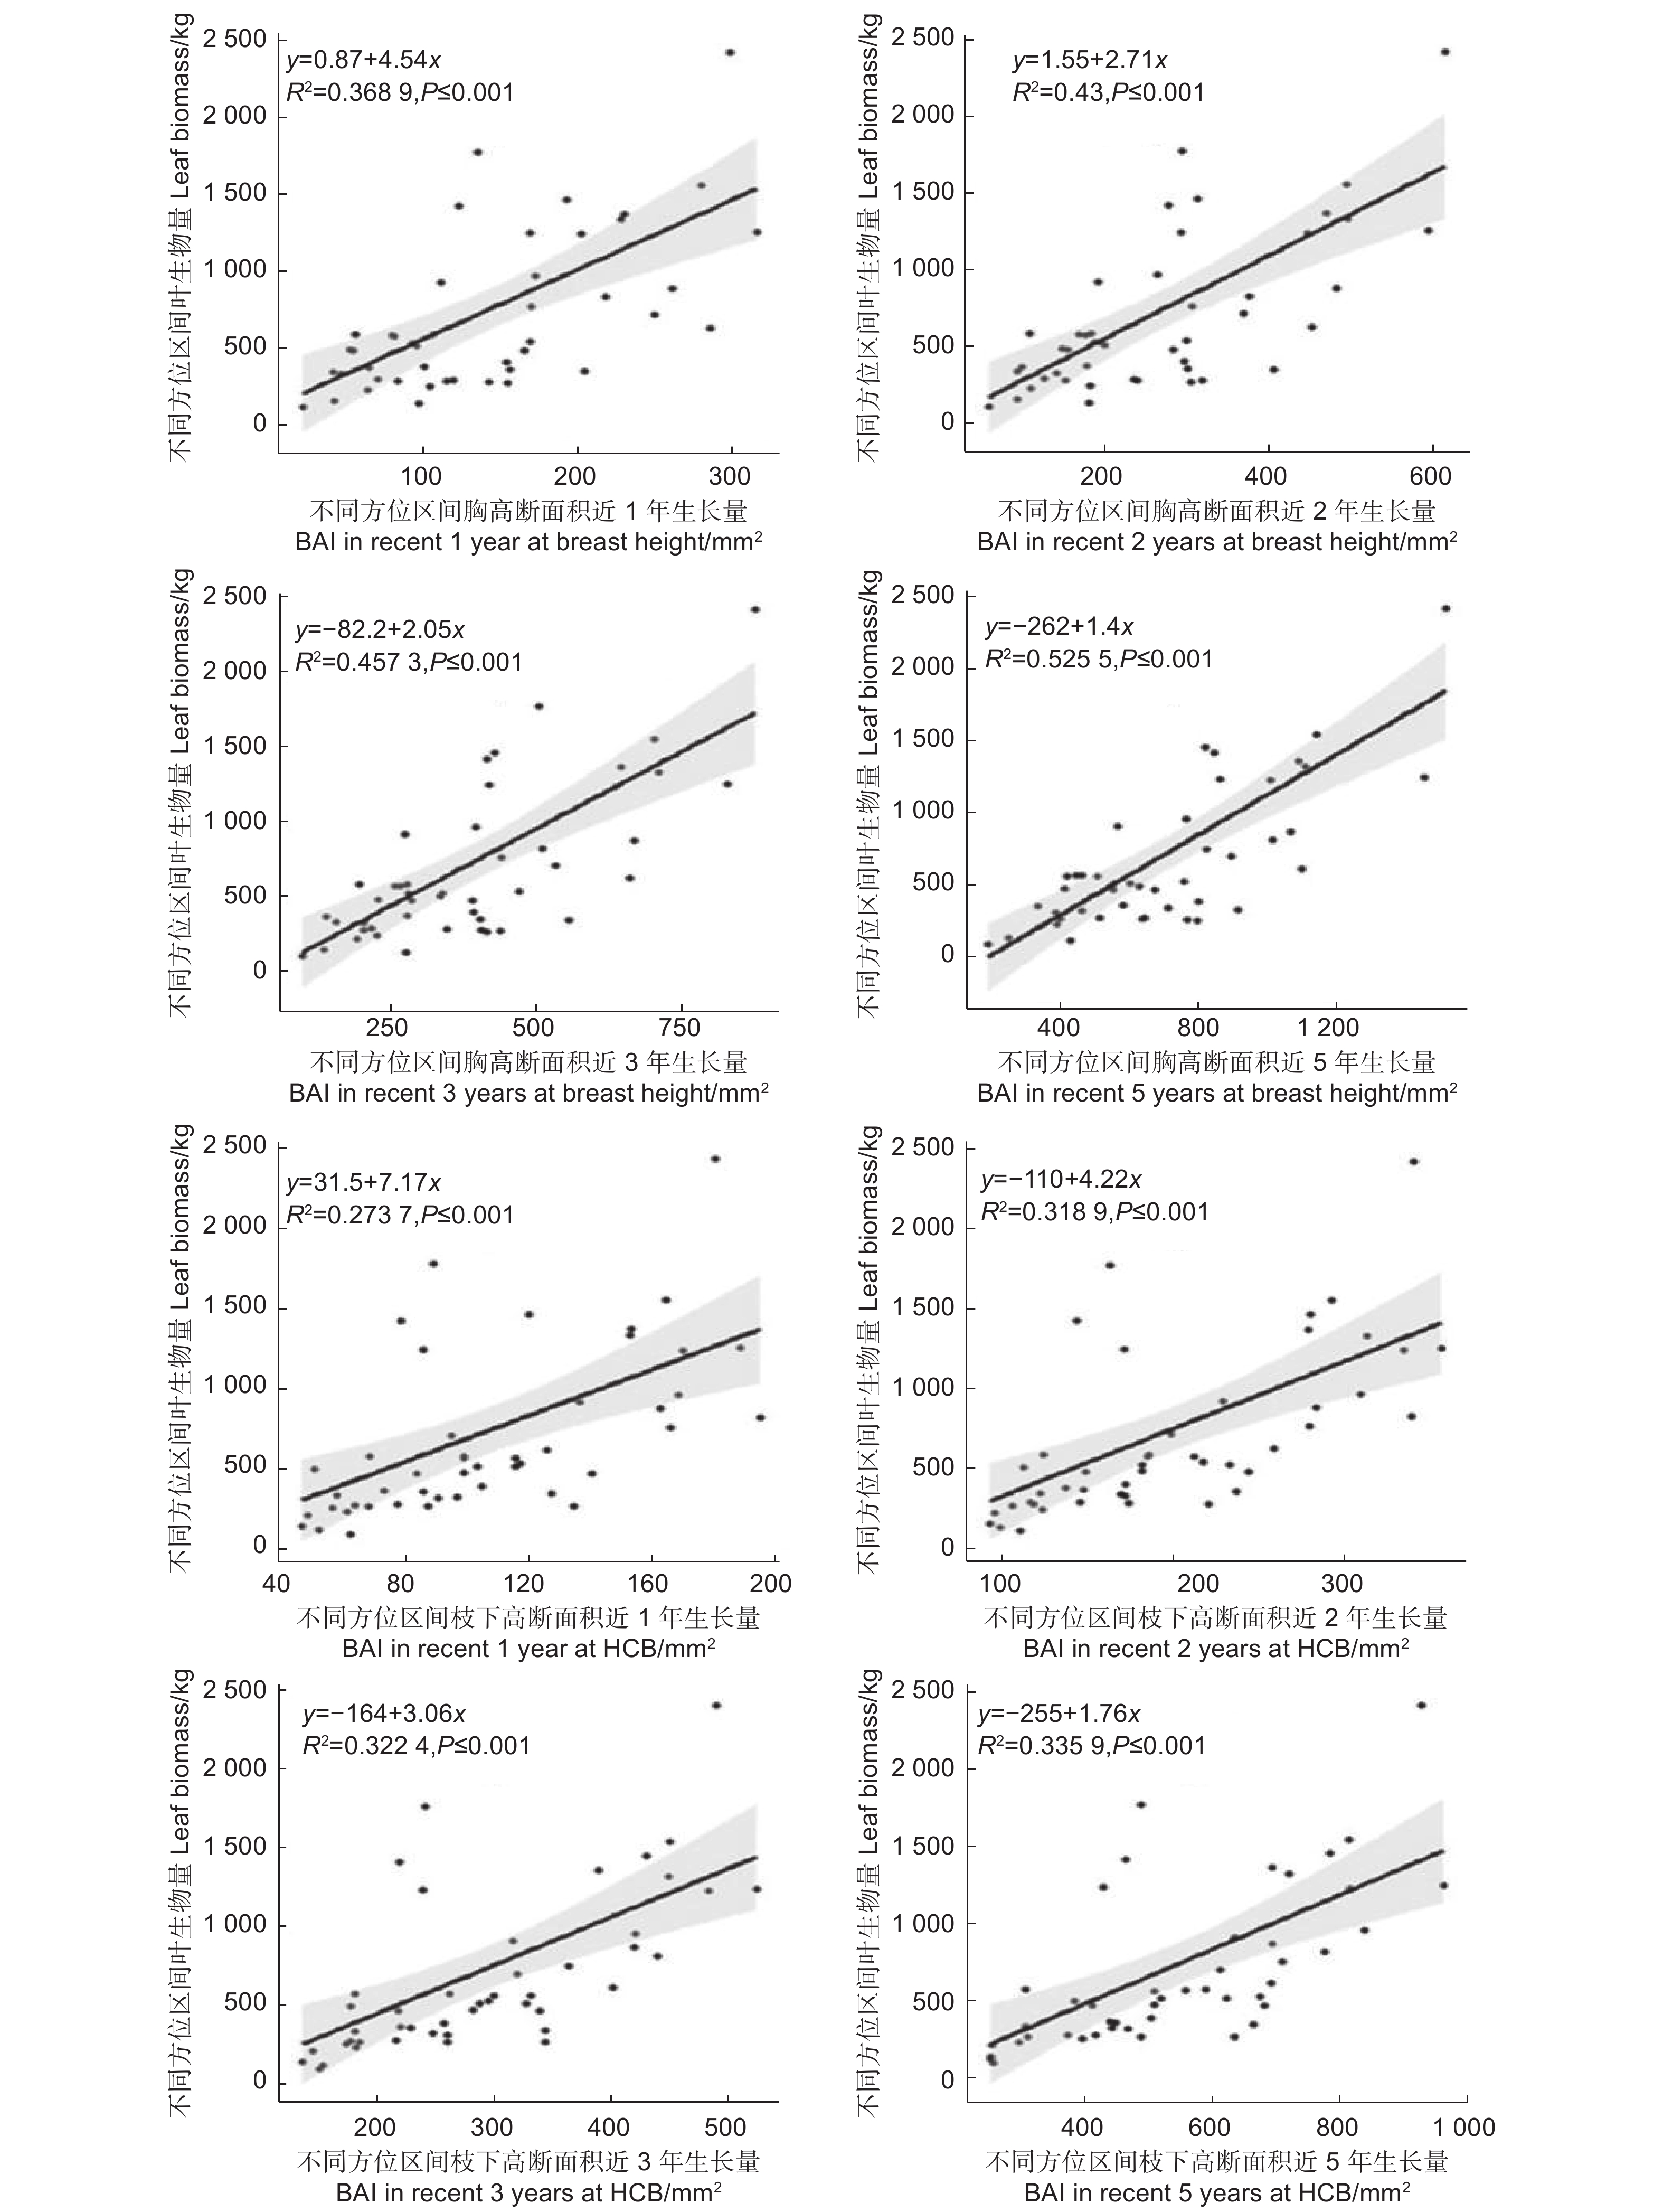
    • 为了探究树冠的叶生物量分布与径向生长量的关系,建立了不同方位区间叶生物量与对应方位区间胸高处、枝下高处最近1,2,3,5年断面积生长量之间y = a + bx的线性关系(图5)。
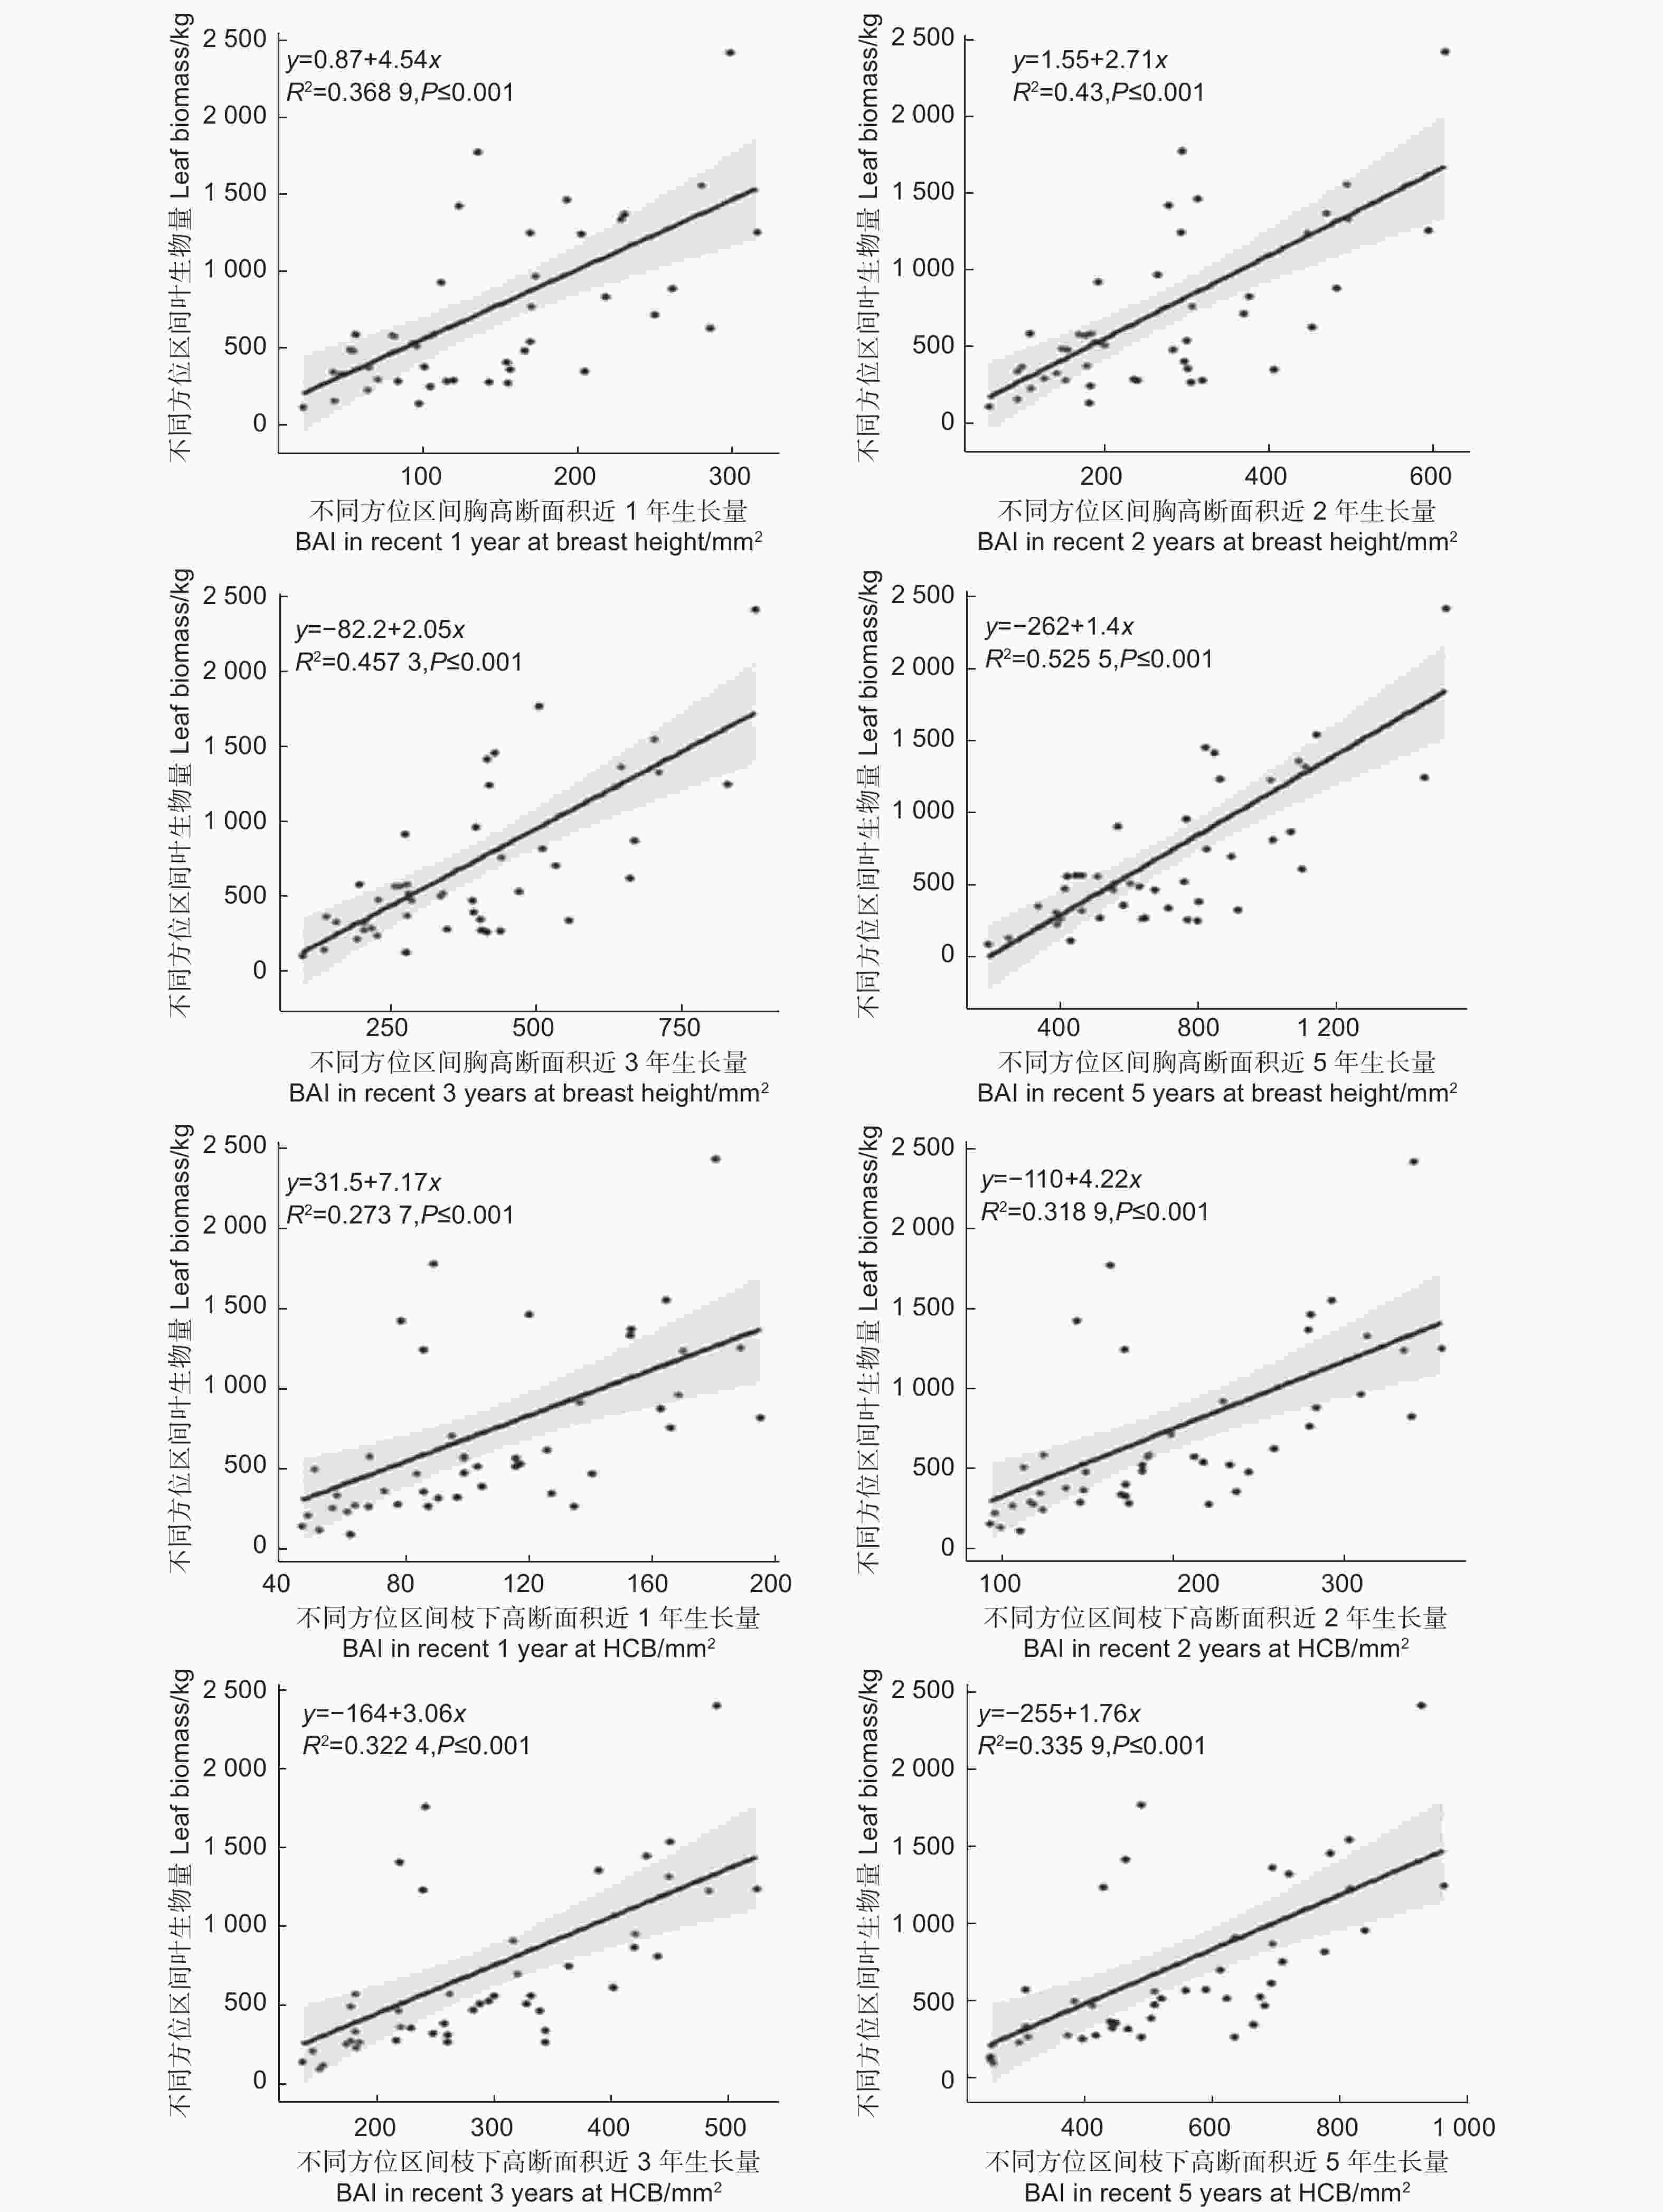
      Figure 5.  The relationship between leaf biomass and basal area increment in recent 1, 2, 3, 5 years at breast height and height to crown base

      图5可知,不同方位区间胸高断面积近1、2、3、5年生长量均与对应区间叶生物量呈显著正相关,决定系数在0.36和0.52之间,其中近5年生长量的决定系数最大为0.525 5,然后依次是近3年,近2年,近1年生长量。不同方位区间枝下高断面积近1、2、3、5年生长量也均与对应方位区间叶生物量呈显著正相关,决定系数在0.27和0.34之间,其中近5年生长量的决定系数最大为0.335 9,然后依次是近3年,近2年,近1年生长量,低于不同方位区间胸高处断面积生长量与叶生物量的相关关系。

    3.   讨论
    • 刘盛等[21]使用生物染色剂对长白落叶松的水分输导模式进行了研究,结果表明长白落叶松枝干中的水分输导模式符合管道模型理论,水分在枝干的不同年轮间没有明显的横向输导现象,在同一年轮内,水分的向上传输呈现较好的定向传输性,并不是均衡向上传输,说明某一枝条上的树叶仅与某些导管相连接,从树叶基部通过树干中的导管贯通至根系。

      Shinozaki等[22]在他们关于管道模型理论的第二篇论文中使用实验数据进一步验证了该理论,并得出结论“作为该理论在森林生态学中的应用,根据叶生物量和枝下高树干横截面积之间的比例关系,可以估算树木和林分的叶生物量”,尽管该方法比Joseph[23]提出的使用胸径的方法更精确,但是并未得到广泛使用,有以下几个原因,首先,该比例不仅取决于树种,还取决于生长条件和林木发育阶段,其次,次生生长是一个不可逆的累积过程,树干直径可以增长或停滞,但是不会减少,而树木的叶生物量或叶面积可能会增加或减少,可能会出现季节性波动[24],或因为竞争、衰老、机械损伤而减少[25]。最后,基于管道模型理论的叶生物量估计需要测量到枝下高处,并在不同方向获取样芯,以推测计算枝下高处的边材面积,而这些测量工作都比只测量胸径要繁琐复杂。一些研究者调查了胸高处边材面积和枝下高处边材面积与胸径和枝下高直径在估测叶生物量上的相关程度,并对结果进行了对比。以胸径范围在13~43 cm,年龄在15~55 a之间的火炬松为例,使用胸径估测叶生物量的效果等于或优于胸高处边材面积和枝下高处边材面积[26]。Snell and Brown[27]对7个针叶树种的研究表明,对于其中3个树种,边材面积对于叶生物量和枝生物量的估测效果要优于胸径,而对于其他4个树种,边材面积和胸径对于叶生物量的估测效果没有显著差异。因此,可能为了便于野外测量,在大多数研究工作中,树干直径仍然是用来估计叶生物量的首选方法。

      树冠形状和叶生物量分布与树干的径向生长紧密相关,并且会影响光合产物在树干中的分布[28-29],由于叶生物量在周向上的不均匀分布,树干上常常会伴随产生与木材力学性能相关的偏心径向生长[30]

      导致树冠偏冠和叶生物量不均匀分布的一个外因是邻近竞争。在本研究中,长白落叶松不仅存在不同程度的树冠偏冠,在树干中也存在着一定程度的偏心径向生长。通过分析长白落叶松株内不同方位叶生物量与对应方位胸高处和枝下高处半径和径向生长量的关系,结果表明,株内不同方位叶生物量分布与对应方位径向生长量呈显著正相关,也就意味着上方树冠的分布越多,下方树干的径向生长也就越快。较大的冠形意味着更大的树冠生物量和叶生物量,这可能是对应径向生长相较更快的原因[31-32]

    4.   结论
    • 本研究基于管道模型理论,使用树冠的叶生物量和树干直径、断面积、断面积生长量等实测数据,在单木水平上拟合了叶生物量估测模型,对比了使用胸高处和枝下高处树干直径、断面积、边材面积和近1、2、3、5年断面积生长量估测单木叶生物量的效果,结果表明胸高断面积作为预测因子的拟合效果最好。由于树冠偏冠现象和树干髓心偏心现象的存在,基于管道模型理论的扩展,本研究将单木根据方位分为8个均等区域,分别调查了各区域的叶生物量和对应的胸高处和枝下高处的树干半径、断面积和近1、2、3、5年断面积生长量,通过与叶生物量的相关分析表明,单木株内不同方位区域的叶生物量与对应的胸径处和枝下高处的树干半径、断面积和近1、2、3、5年断面积生长量均呈显著正相关。本研究以长白落叶松叶生物量和径向生长相关因子为研究对象,结合管道模型理论,初步分析了长白落叶松偏冠现象与树干髓心偏心现象之间的关系,不过本研究只是进行了初步的统计分析,而未更深层次的结合树木生理学进行研究分析,对树冠偏冠和髓心偏心关系的确定还需今后进一步的研究。

Reference (32)

Catalog

    /

    DownLoad:  Full-Size Img  PowerPoint
    Return
    Return