• 中国中文核心期刊
  • 中国科学引文数据库(CSCD)核心库来源期刊
  • 中国科技论文统计源期刊(CJCR)
  • 第二届国家期刊奖提名奖
Volume 35 Issue 5
Oct.  2022
Article Contents
Turn off MathJax

Citation:

The Relationship Between Height-to-diameter Ratio and DBH and Tree Height in Typical Natural Broad-leaved Forests in Mid-subtropical Zone

  • Corresponding author: HUANG Qing-lin, huangql@caf.ac.cn
  • Received Date: 2022-01-14
    Accepted Date: 2022-02-17
  • Objective To provide a typical reference in the aspect of height-to-diameter ratio of broad-leaved trees for the sustainable management of artificial broad-leaved forest, semi-natural broad-leaved forest and natural broad-leaved forest in mid-subtropical zone, the relationship between tree height-to-diameter ratio and DBH and tree height were revealed in each stratum of typical natural broad-leaved forests. Method In Jian’ou Wanmulin Provincial Nature Reserve, 50 m × 50 m plots were set up in 5 most typical natural broad-leaved forest in mid-subtropical zone respectively. Spearman rank correlation coefficient was used to analyze the correlation between tree height-to-diameter ratio and DBH and tree height in each stratum, and exponential function and hyperbola equation were chosen to fit the relationship between height-to-diameter ratio and DBH in each stratum. Results The variation range of the average value of the height-to-diameter ratio in each stratum was not large. The average height-to-diameter ratio of the stand in the 5 sample plots was 103.1. The mean height-to-diameter ratio in stratum Ⅲ(112.7) was the largest, followed by stratum Ⅱ (89.0) and stratum Ⅰ(66.9), as well as in the minimum and maximum values. The height-to-diameter ratio of each stratum showed a significant negative correlation with DHB and the correlation coefficient was high. The absolute value of correlation coefficient was the highest in stratum Ⅰ(0.896~0.961) and stratum Ⅱ(0.912~0.971), the middle in the stand(0.613~0.749), and the lowest in stratum Ⅲ(0.415~0.596).The relationship between tree height-to-diameter ratio and tree height in each stratum was complex and the absolute value of correlation coefficient was low (< 0.480). The stand showed extremely negative correlation, but the absolute value of correlation coefficient was low (0.283~0.458). The R2 of the tree height-to-diameter ratio and DBH in stratum Ⅰ and stratum Ⅱ fitted by exponential function were 0.852~0.906 and 0.830~0.914, respectively, while the R2 of the stand and stratum Ⅲ were 0.465~0.575 and 0.202~0.399, respectively. The R2 of the height-to-diameter ratio and DBH in stratum Ⅰ and stratum Ⅱ fitted by hyperbolic curve were 0.874~0.937 and 0.856~0.968, respectively, while the R2 of the stand and stratum Ⅲ were 0.387~0.536 and 0.186~0.350, respectively. Exponential function fitting stand and stratum Ⅰ relationship of DBH than height-to-diameter ratio of R2 was relatively high, and RMSE and AMR was relatively small. hyperbola from fitting relationship of DBH than height-to-diameter ratio stratum Ⅰ and stratum Ⅱ fitted by hyperbola equation had relatively high R2 and small RMSE and AMR was values. Conclusion The tree height/diameter ratio of typical natural broad-leaved forest in mid-subtropical zone varies with the stratum. The tree height/diameter ratio in the same stratum also varies with DBH. The height-to-diameter ratio and DBH in each stratum shows a very significant negative correlation and the correlation coefficient is high, and the curve fitting of the relationship is significant. Hyperbolic function can well describe the relationship between height-to-diameter ratio and DBH in the stratum Ⅰ and stratum Ⅱ, while exponential function is more suitable to describe the relationship between height-to-diameter ratio and DBH in the stand and the stratum Ⅲ. The relationship between tree height-to-diameter ratio and tree height in each stratum is complex and the correlation coefficient is low. In the typical natural broad-leaved forest of the mid-subtropical zone, the characteristics of tree height/diameter ratio can be expressed by the relationship curve between tree height to diameter and DBH of each stratum.
  • 加载中
  • [1] 林学名词审定委员会. 林学名词(第二版)[M]. 北京: 科学出版社, 2016.

    [2] 丁良忱, 别 克. 天山云杉人工幼林生长规律的初步研究[J]. 八一农学院学报, 1988(2):38-45.

    [3]

    Sharma R P, Vacek Z, Vacek S, et al. A nonlinear mixed-effects height-to-diameter ratio model for several tree species based on Czech National Forest Inventory Data[J]. Forests, 2019, 10(1): 70. doi: 10.3390/f10010070
    [4]

    Oyebade B A, Eguakun F S, Egberibin A. Tree slenderness coefficient (TSC) and tree growth characteristics (TGCS) for Pinuscaribaea in Omo Forest Reserve, Nigeria[J]. Journal of Environmental Science, 2015, 9(3): 56-62.
    [5]

    Hess A F, Minatti M, Costa E A, et al. Height-to-diameter ratios with temporal and dendro/morphometric variables for Brazilian pine in south Brazil[J]. Journal of Forestry Research, 2021, 32(1): 191-202. doi: 10.1007/s11676-019-01084-8
    [6]

    Opio C, Jacob N, Coopersmith D. Height to diameter ratio as a competition index for young conifer plantations in northern British Columbia, Canada[J]. Forest Ecology and Management, 2000, 137(1-3): 245-252. doi: 10.1016/S0378-1127(99)00312-6
    [7]

    Adeyemi A A, Adesoye P O. Tree slenderness coefficientand percent canopy cover in Oban Group Forest, Nigeria[J]. Journal of Natural Sciences Research, 2016, 6(4): 9-17.
    [8]

    Adeyemi A A, Ugo-Mbonu N A. Tree slenderness coefficients and crown ratio models for Gmelina arborea (ROXB) stand in afi river forest reserve, cross river state, Nigeria[J]. Nigerian Journal of Agriculture, Food and Environment, 2017, 13(1): 226-233.
    [9]

    Yang Y, Huang S. Effects of competition and climate variables on modelling height to live crown for three boreal tree species in Alberta, Canada[J]. European Journal of Forest Research, 2018, 137: 153-167. doi: 10.1007/s10342-017-1095-7
    [10] 黄旺志, 赵剑平, 王昌薇, 等. 不同造林密度对杉木生长的影响[J]. 河南农业大学学报, 1997, 31(4):379-385. doi: 10.16445/j.cnki.1000-2340.1997.04.018

    [11] 蔡 坚, 潘 文, 王保华, 等. 林分密度对湿地松林木干形影响的研究[J]. 广东林业科技, 2006, 22(2):6-10.

    [12] 丁贵杰, 周政贤, 严仁发, 等. 造林密度对杉木生长进程及经济效果影响的研究[J]. 林业科学, 1997, 33(A1):67-75.

    [13] 王彩云, 陆洪灿. 云南松天然林立木高径比的研究[J]. 林业资源管理, 1987(2):28-31.

    [14]

    Vospernik S, Monserud R A, Sterba H. Do individual-tree growth models correctly represent height: diameter ratios of Norway spruce and Scots pine?[J]. Forest Ecology and Management, 2010, 260(10): 1735-1753. doi: 10.1016/j.foreco.2010.07.055
    [15]

    Zhang X, Wang H, Chhin S, et al. Effects of competition, age and climate on tree slenderness of Chinese fir plantations in southern China[J]. Forest Ecology and Management, 2020, 458: 117815. doi: 10.1016/j.foreco.2019.117815
    [16]

    Sharma R P, Vacek Z, Vacek S. Modeling individual tree height to diameter ratio for Norway spruce and European beech in Czech Republic[J]. Trees, 2016, 30(6): 1969-1982. doi: 10.1007/s00468-016-1425-2
    [17]

    Wang Y, Titus S J, LeMay V M. Relationships between tree slenderness coefficients and tree or stand characteristics for major species in boreal mixedwood forests[J]. Canadian Journal of Forest Research, 1998, 28(8): 1171-1183. doi: 10.1139/x98-092
    [18] 许慕农. 林分密度研究概述[J]. 山东林业科技, 1982, (3):22-30.

    [19] 马存世. 舟曲林区落叶松人工林生长特性研究[J]. 甘肃林业科技, 1999, 24(3):24-27.

    [20] 庄崇洋, 黄清麟, 马志波, 等. 典型中亚热带天然阔叶林林层特征及蓄积估计研究[J]. 林业科学研究, 2017, 30(4):559-565. doi: 10.13275/j.cnki.lykxyj.2017.04.004

    [21] 庄崇洋, 黄清麟, 马志波, 等. 典型中亚热带天然阔叶林各林层树高胸径关系研究[J]. 林业科学研究, 2017, 30(3):479-485. doi: 10.13275/j.cnki.lykxyj.2017.03.017

    [22] 庄崇洋. 中亚热带天然阔叶林林层特征研究[D]. 北京: 中国林业科学研究院, 2016.

    [23] 庄崇洋, 黄清麟, 马志波, 等. 中亚热带天然阔叶林林层划分新方法——最大受光面法[J]. 林业科学, 2017, 53(3):1-11. doi: 10.11707/j.1001-7488.20170301

    [24] 黄清麟, 庄崇洋, 马志波. 中亚热带天然阔叶林林层特征研究[M]. 北京: 中国林业出版社, 2019.

    [25] 马志波, 黄清麟, 庄崇洋, 等. 基于林层的典型中亚热带天然阔叶林树种组成[J]. 林业科学, 2017, 53(10):13-21. doi: 10.11707/j.1001-7488.20171002

    [26] 马志波, 黄清麟, 庄崇洋, 等. 基于分层的典型中亚热带天然阔叶林林木竞争关系研究[J]. 林业科学研究, 2018, 31(2):1-10. doi: 10.13275/j.cnki.lykxyj.2018.02.001

    [27] 何友钊. 建瓯县万木林保护区史事考[J]. 林史文集, 1989, 1(1):139-140.

    [28] 黄清麟, 李志明, 郑群瑞. 福建中亚热带天然阔叶林理想结构探讨[J]. 山地学报, 2003, 21(1):116-120. doi: 10.3969/j.issn.1008-2786.2003.01.019

  • 加载中
通讯作者: 陈斌, bchen63@163.com
  • 1. 

    沈阳化工大学材料科学与工程学院 沈阳 110142

  1. 本站搜索
  2. 百度学术搜索
  3. 万方数据库搜索
  4. CNKI搜索

Figures(2) / Tables(4)

Article views(3712) PDF downloads(92) Cited by()

Proportional views

The Relationship Between Height-to-diameter Ratio and DBH and Tree Height in Typical Natural Broad-leaved Forests in Mid-subtropical Zone

    Corresponding author: HUANG Qing-lin, huangql@caf.ac.cn
  • 1. Research Institute of Forest Resource Information Techniques, Chinese Academy of Forestry, Beijing 100091, China
  • 2. Key Laboratory of Forest Management and Growth Modelling, National Forestry and Grassland Administration, Beijing 100091, China
  • 3. Forestry College of Fujian Agriculture and Forestry University, Fuzhou 350002, Fu jian, China
  • 4. Administrative Office of Jian’ou Wanmulin Provincial Nature Reserve, Jian’ou 353105, Fu jian, China

Abstract:  Objective To provide a typical reference in the aspect of height-to-diameter ratio of broad-leaved trees for the sustainable management of artificial broad-leaved forest, semi-natural broad-leaved forest and natural broad-leaved forest in mid-subtropical zone, the relationship between tree height-to-diameter ratio and DBH and tree height were revealed in each stratum of typical natural broad-leaved forests. Method In Jian’ou Wanmulin Provincial Nature Reserve, 50 m × 50 m plots were set up in 5 most typical natural broad-leaved forest in mid-subtropical zone respectively. Spearman rank correlation coefficient was used to analyze the correlation between tree height-to-diameter ratio and DBH and tree height in each stratum, and exponential function and hyperbola equation were chosen to fit the relationship between height-to-diameter ratio and DBH in each stratum. Results The variation range of the average value of the height-to-diameter ratio in each stratum was not large. The average height-to-diameter ratio of the stand in the 5 sample plots was 103.1. The mean height-to-diameter ratio in stratum Ⅲ(112.7) was the largest, followed by stratum Ⅱ (89.0) and stratum Ⅰ(66.9), as well as in the minimum and maximum values. The height-to-diameter ratio of each stratum showed a significant negative correlation with DHB and the correlation coefficient was high. The absolute value of correlation coefficient was the highest in stratum Ⅰ(0.896~0.961) and stratum Ⅱ(0.912~0.971), the middle in the stand(0.613~0.749), and the lowest in stratum Ⅲ(0.415~0.596).The relationship between tree height-to-diameter ratio and tree height in each stratum was complex and the absolute value of correlation coefficient was low (< 0.480). The stand showed extremely negative correlation, but the absolute value of correlation coefficient was low (0.283~0.458). The R2 of the tree height-to-diameter ratio and DBH in stratum Ⅰ and stratum Ⅱ fitted by exponential function were 0.852~0.906 and 0.830~0.914, respectively, while the R2 of the stand and stratum Ⅲ were 0.465~0.575 and 0.202~0.399, respectively. The R2 of the height-to-diameter ratio and DBH in stratum Ⅰ and stratum Ⅱ fitted by hyperbolic curve were 0.874~0.937 and 0.856~0.968, respectively, while the R2 of the stand and stratum Ⅲ were 0.387~0.536 and 0.186~0.350, respectively. Exponential function fitting stand and stratum Ⅰ relationship of DBH than height-to-diameter ratio of R2 was relatively high, and RMSE and AMR was relatively small. hyperbola from fitting relationship of DBH than height-to-diameter ratio stratum Ⅰ and stratum Ⅱ fitted by hyperbola equation had relatively high R2 and small RMSE and AMR was values. Conclusion The tree height/diameter ratio of typical natural broad-leaved forest in mid-subtropical zone varies with the stratum. The tree height/diameter ratio in the same stratum also varies with DBH. The height-to-diameter ratio and DBH in each stratum shows a very significant negative correlation and the correlation coefficient is high, and the curve fitting of the relationship is significant. Hyperbolic function can well describe the relationship between height-to-diameter ratio and DBH in the stratum Ⅰ and stratum Ⅱ, while exponential function is more suitable to describe the relationship between height-to-diameter ratio and DBH in the stand and the stratum Ⅲ. The relationship between tree height-to-diameter ratio and tree height in each stratum is complex and the correlation coefficient is low. In the typical natural broad-leaved forest of the mid-subtropical zone, the characteristics of tree height/diameter ratio can be expressed by the relationship curve between tree height to diameter and DBH of each stratum.

  • 高径比是衡量林分稳定性、密度和竞争的重要指标[1-5],可用于评估林木活力和健康状况[5-8],也可用于编制立木材积表以及确定立木生长率,还可在各种森林模型中作为描述竞争效应的显著预测因子[9]。高径比还是反映林木干形和林木生长的指标[10-12],它的大小直接影响木材的质量和经济价值[12]。高径比因林木大小、林木年龄、生长资源的可得性、林分密度和物种组成而异[5],研究高径比对于提升森林质量和木材产品价值有重要意义[5-8,12],同时对于更好地理解森林生态过程至关重要[3]

    为了更好地表征林木高径比特征,林木高径比与胸径及树高的关系引起了国内外一些学者的重视[13-15],林木高径比与胸径密切相关,其随林木胸径的增大而减小[15-17],其关系可用指数函数和双曲线函数来拟合[17-19],而林木高径比与树高的相关性通常不高,有时呈负相关[17],有时呈正相关[4]。但目前对林木高径比与胸径及树高关系的研究多是针对整个乔木层,很少基于各亚层 [3,16],且多是集中在结构简单、单层同龄的人工纯林,很少研究天然针阔混交林[17],未见针对结构复杂、复层异龄多树种混交的天然阔叶林的相关研究。对于中亚热带天然阔叶林的林层划分,目前已有科学的、在野外操作简单易行的和具有一定的生物学意义的林层定量划分新方法可供选用 [20-26]。因此,本研究以典型中亚热带天然阔叶林为对象,研究各林层(包括乔木层和各乔木亚层)林木高径比与胸径及树高的关系,旨在揭示典型中亚热带天然阔叶林各林层林木高径比与胸径及树高的关系特征,为中亚热带人工阔叶林、半天然林和天然阔叶林可持续经营提供阔叶林木高径比方面的参照。

    • 建瓯万木林省级自然保护区是1957年划定的全国首批19个天然森林禁伐区(自然保护区)之一,是继鼎湖山之后我国建立的第二个自然保护区[27]。保护区位于闽北建瓯市境内,属武夷山南坡低山丘陵,海拔230~556 m,地理坐标为27°02′28″ ~ 27°03′32″ N,118°08′22″~118°09′23″ E,气候属中亚热带海洋性季风气候,年平均气温18.7 ℃,极端最低气温−5.9 ℃,极端最高气温40.7 ℃。年平均降水量1 700 mm,6月最多,雨日年平均166 d。土壤为中生代燕山运动侵入的花岗岩为主要成土母岩的红壤,立地类型以Ⅱ类地为主。

    2.   材料与方法
    • 在建瓯万木林省级自然保护区内选择5个最典型中亚热带天然阔叶林[22-23,28],在5个试验林分内分别设置50 m × 50 m的样地,对样地内胸径≥5.0 cm的林木进行每木调查,准确调查测定并记录每株林木的位置、树种、胸径、树高、枝下高、冠长、冠幅和冠形等因子,采用最大受光面法进行林层划分[22-23]。各样地概况见表1,5个样地各林层的相关信息详见《中亚热带天然阔叶林林层特征》[24]、《基于林层的典型中亚热带天然阔叶林树种组成与多样性》[25]

      样地号
      Sample plot
      群落类型
      Community type
      种丰富度
      Species
      brichness
      平均胸径
      Mean
      DBH/cm
      平均树高
      Mean
      height/m
      密度
      Density/
      (individual·hm−2)
      蓄积量
      Volume/
      (m3·hm−2)
      1 木荷 + 光叶山矾
      Schima superba + Symplocos lancifolia
      36 21.0 26.8 1 164 481.7
      2 猴欢喜 + 木荷
      Sloanea sinensis + Schima superbar
      50 25.7 27.9 952 591.5
      3 木荷 + 新木姜子
      Schima superba + Neolitsea aurata
      49 22.0 23.9 1 076 435.4
      4 木荷 + 浙江桂
      Schima superba + Cinnamomum chekiangense
      45 23.6 24.1 1 056 493.3
      5 浙江桂 + 木荷
      Cinnamomum chekiangense + Schima superba
      45 21.9 25.2 1 056 443.0

      Table 1.  General situation of sample plots

    • 采用Spearman秩相关系数分析高径比与胸径及树高的相关性,运用指数函数和双曲线函数拟合林木高径比与胸径关系,参考前人的研究[17-19],选择以下2种模型对各林层(包括全林分和各亚层)林木高径比与胸径关系曲线进行拟合。具体表达式如下:

      式中:y表示高径比的大小,x表示胸径大小,ab是该模型的参数,(1)式中b表示林木高径比在连续的径阶中减小的速率;(2)式中a表示双曲线函数的上下限(b > 0时,a为下限;b < 0时,a为上限)。

      选用均方根误差(RMSE)、决定系数(R2)和平均绝对误差(AMR)等作为模型评价指标。

    3.   结果分析
    • 各林层林木高径比平均值及其分布范围如表2,5个样地全林林木高径比平均值为103.1,分布范围为97.2~108.0,数值变动范围小(10.8);各亚层林木高径比平均值的数值变动范围也都不大,其中第Ⅲ亚层的数值变动范围最小(8.8);各亚层高径比平均值排序为:第Ⅲ亚层(112.7) < 第Ⅱ亚层(89.0) < 第Ⅰ亚层(66.9)。综合5个样地各林层林木高径比分布范围,全林为27.5~242.5,第Ⅰ亚层为27.5~135.0,第Ⅱ亚层为32.2~181.1,第Ⅲ亚层为43.5~242.5,各亚层最小值与最大值排序与其平均值排序一致。以上结果反映出:典型中亚热带天然阔叶林林木高径比会因所属亚层的不同而变化,因此有必要分亚层来探讨林木高径比与胸径及树高关系。

      样地号
      Sample plot
      平均林木高径比 Mean tree height-to-diameter ratio林木高径比分布范围 Treeheight-to-diameter ratio range
      SS
      1 108.0 78.2 101.4 116.2 42.5~175.9 42.5~135.0 56.4~157.3 55.7~175.9
      2 97.2 58.1 82.2 107.4 27.5~242.5 27.5~109.2 37.2~138.2 43.5~242.5
      3 103.8 62.8 77.7 114.0 34.5~202.9 36.8~108.2 34.5~140.5 47.8~202.9
      4 102.2 69.4 97.8 112.0 32.2~209.0 35.9~123.2 32.2~181.1 47.3~209.0
      5 104.1 66.1 85.9 114.0 32.5~198.8 38.4~94.0 32.5~148.4 54.2~198.8
        注:S表示全林分;Ⅰ表示第Ⅰ亚层;Ⅱ表示第Ⅱ亚层;Ⅲ表示第Ⅲ亚层。下同。
        Note: S means stand, Ⅰ mean stratum Ⅰ, Ⅱ mean stratum Ⅱ, Ⅲ mean stratum Ⅲ. The same below.

      Table 2.  Mean tree height-to-diameter ratio and distribution range of tree height-to-diameter ratio in each stratum
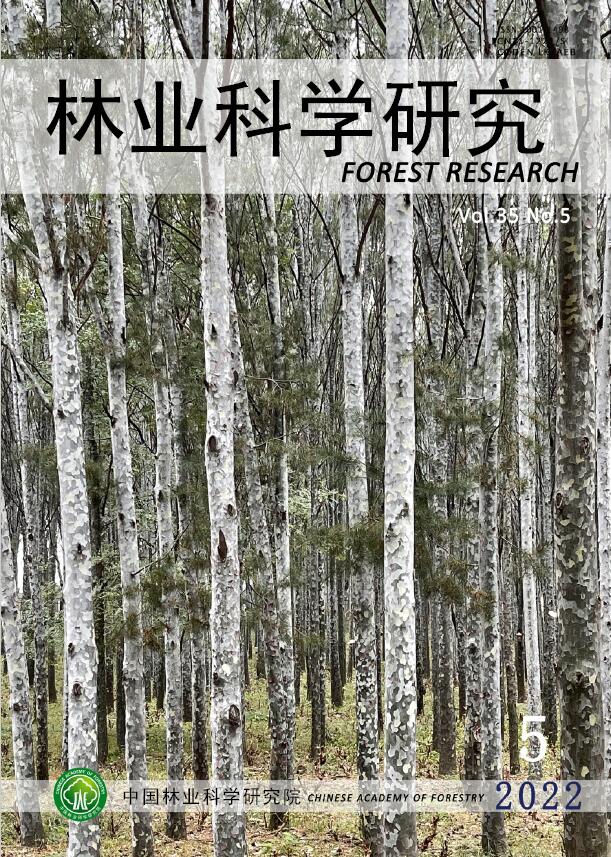
    • 各样地各林层林木高径比与胸径及树高关系的散点图如图1图2所示,从散点图可以直观看出:各样地各林层林木高径比与胸径都呈现明显的负相关;各样地各林层林木高径比与树高的关系较为复杂,全林的关系呈现较为明显的负相关,但各亚层的关系较难以判断。进一步的相关性分析结果(见表3)表明:各样地各林层林木高径比与胸径均呈现极显著负相关且相关系数都较高,相关系数绝对值第Ⅰ亚层(0.896~0.961)和第Ⅱ亚层(0.912~0.971)最高,全林(0.613~0.749)居中,第Ⅲ亚层(0.415~0.596)最低;各样地各林层林木高径比与树高的关系较为复杂且相关系数绝对值都较低(0.020~0.480),全林呈现极显著负相关,第Ⅰ亚层4个样地呈现无显著负相关、1个样地呈现显著负相关,第Ⅱ亚层2个样地呈现极显著负相关、2个样地呈现无显著负相关、1个样地呈现无显著正相关,第Ⅲ亚层2个样地呈现极显著正相关、3个样地呈现无显著负相关。以上研究结果表明,同一亚层的林木高径比也会因胸径不同而变化;各林层林木高径比与胸径关系曲线拟合是有意义且必要的,但各林层林木高径比与树高关系曲线拟合是没有意义的;典型中亚热带天然阔叶林林木高径比特征可以采用各林层林木高径比与胸径的关系曲线来表达。

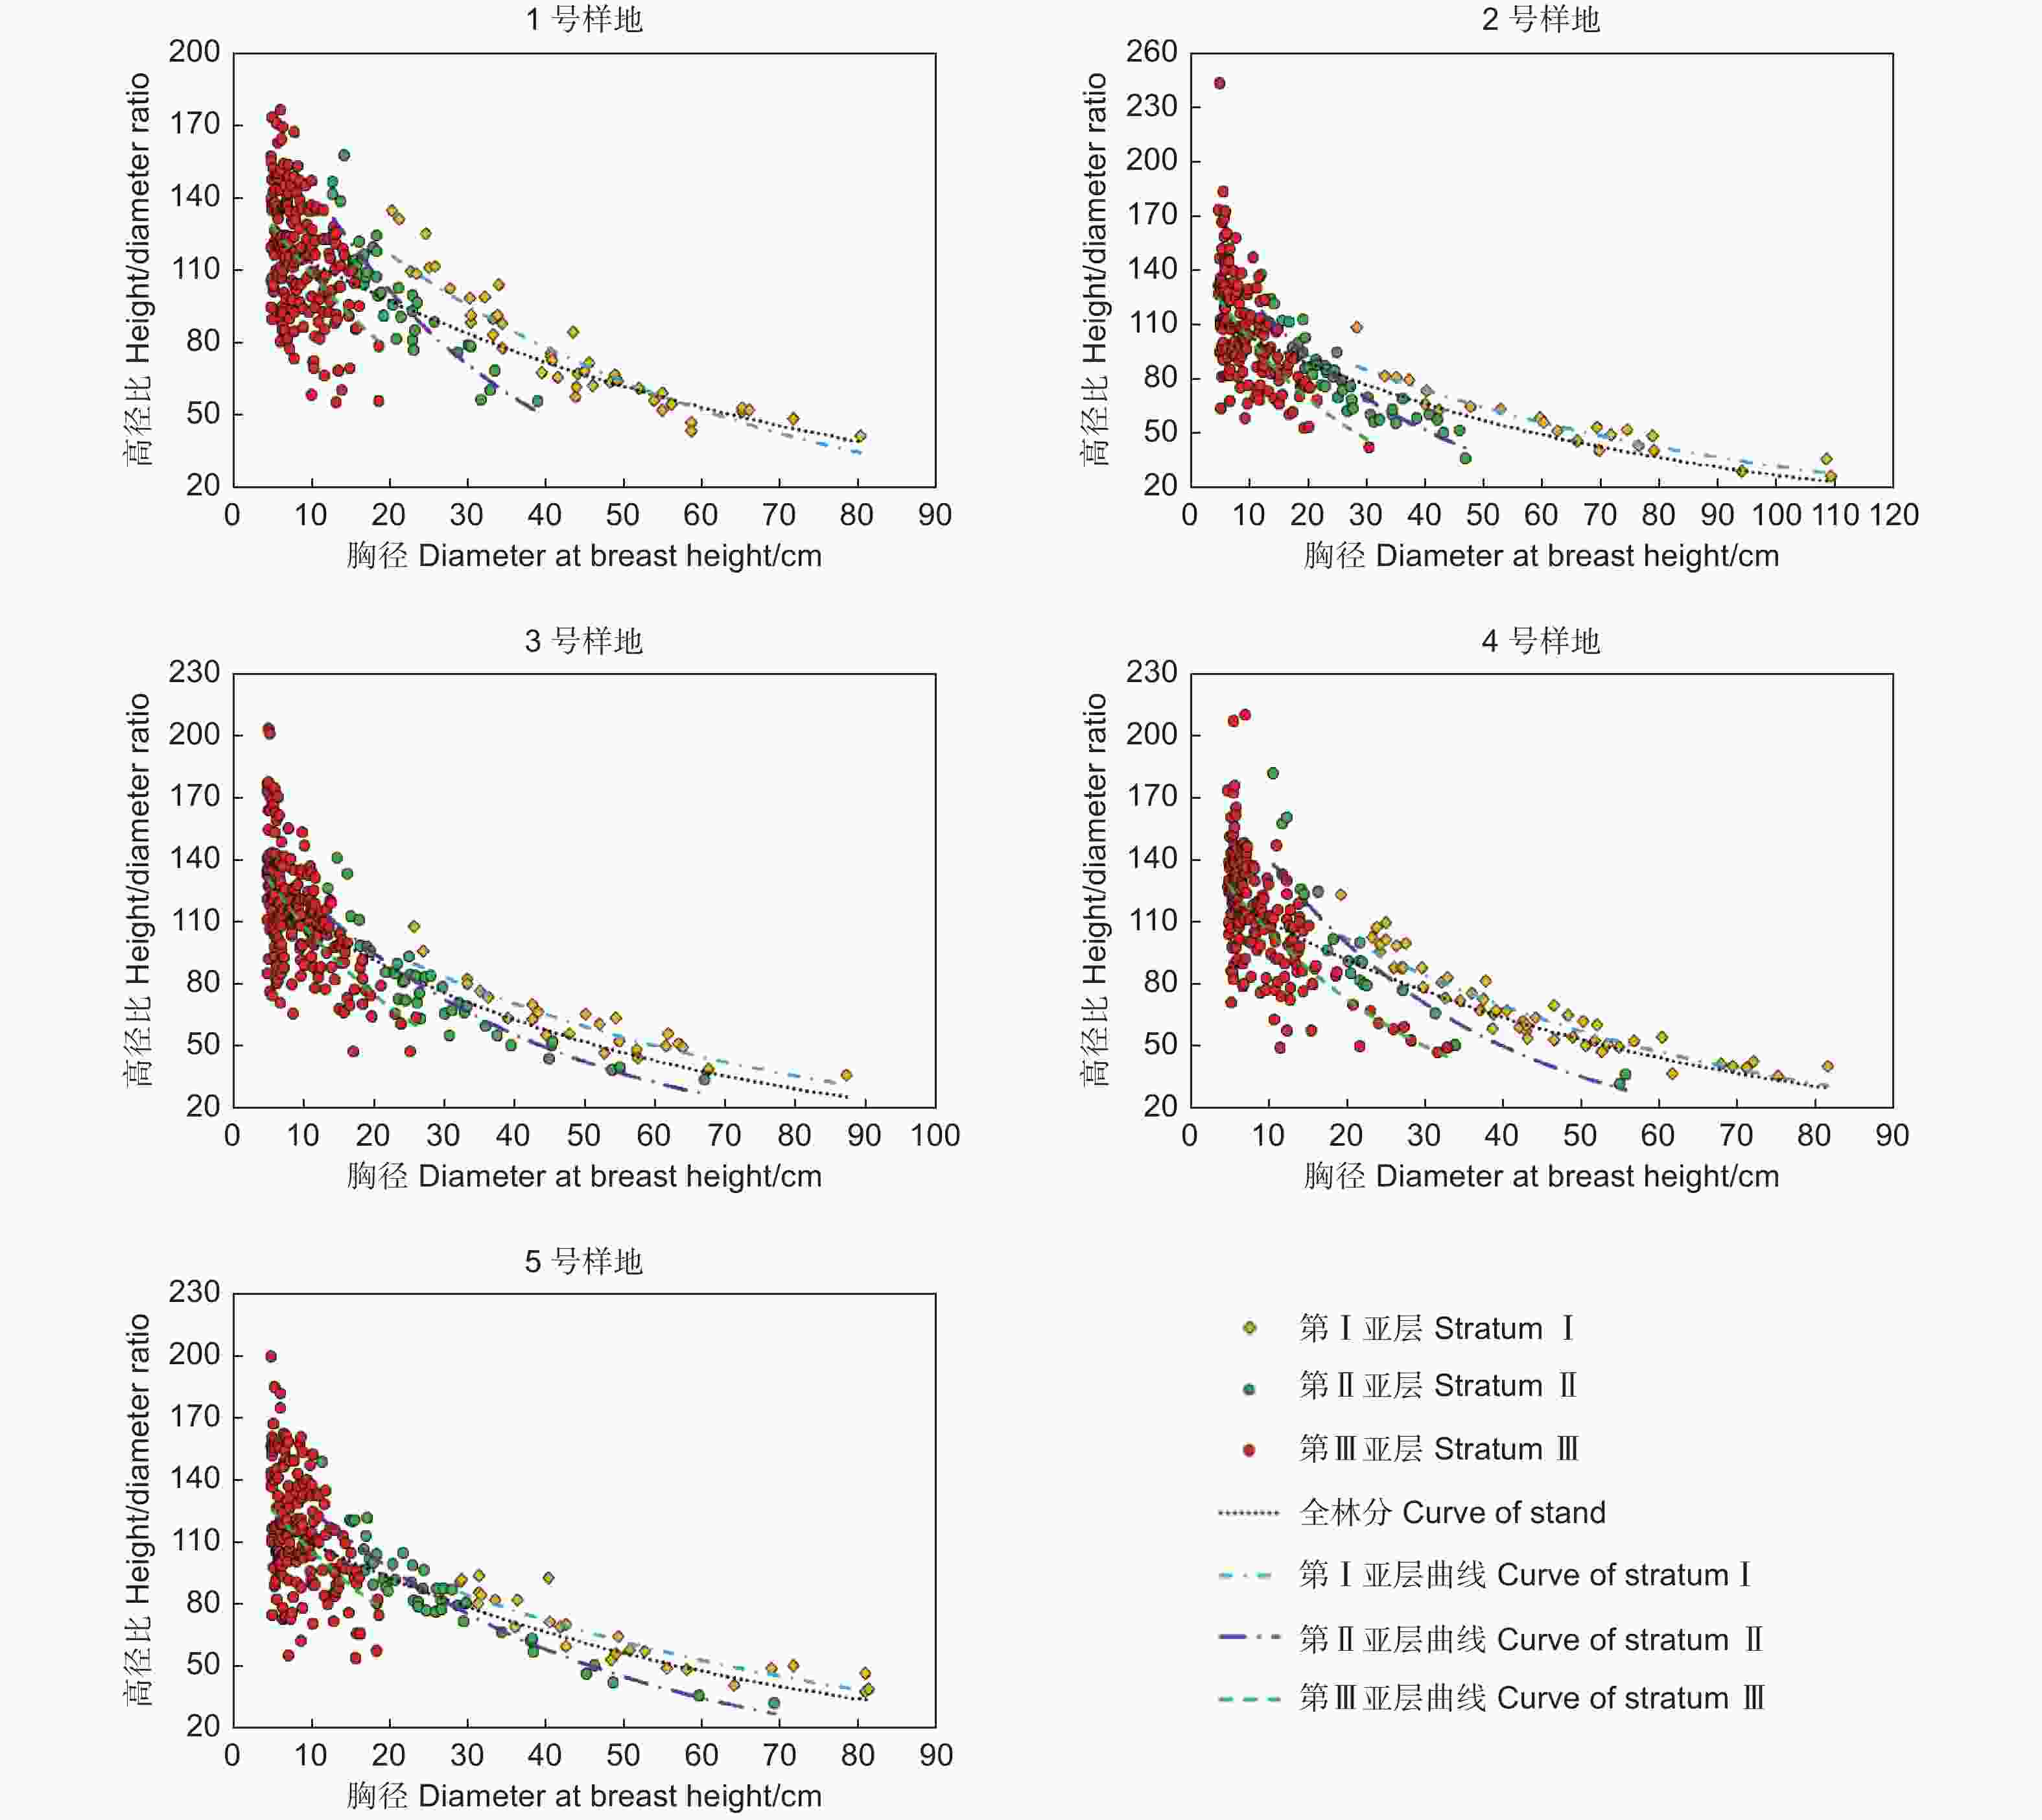
      Figure 1.  Scatter diagram and fitting curve of tree height-to-diameter ratio and DBH in each stratum

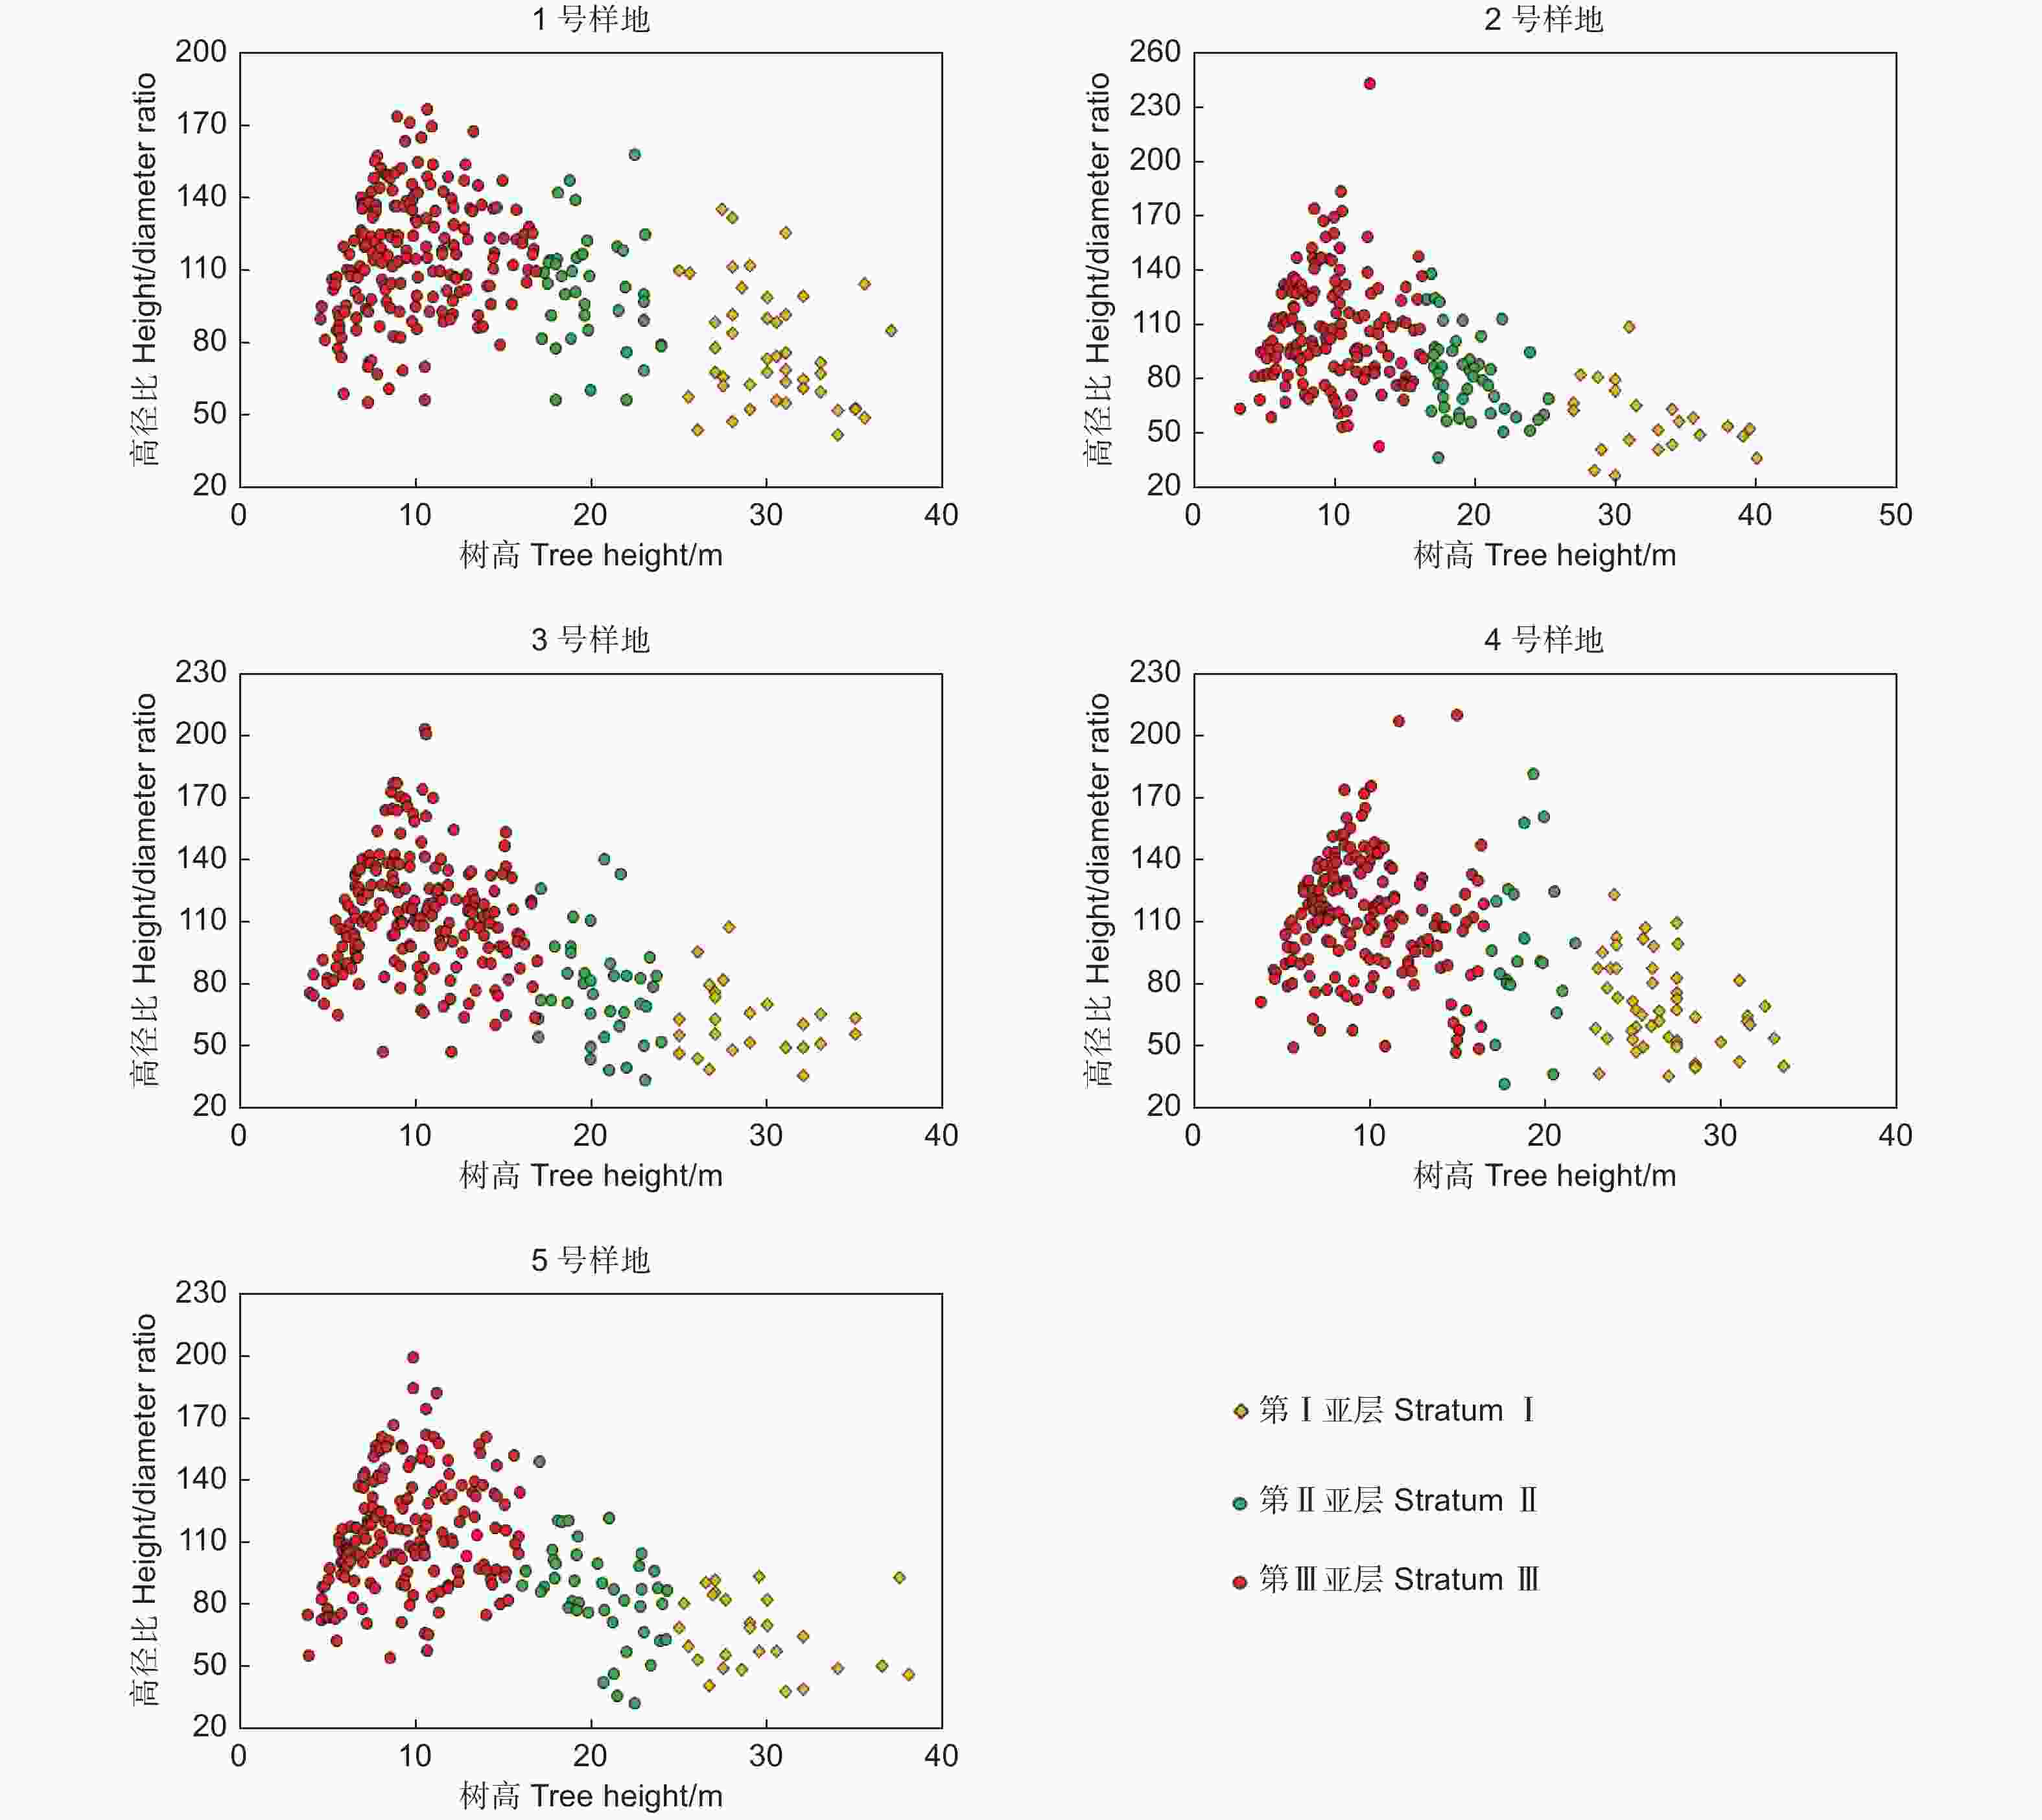
      Figure 2.  Scatter diagram of tree height-to-diameter ratio and tree height in each stratum

      样地号
      Sample plot
      高径比与胸径的相关系数
      Correlation coefficient between
      height-to-diameter ratio and DHB
      高径比与树高的相关系数
      Correlation coefficient between
      height-to-diameter ratio and tree height
      SS
      1 −0.613** −0.961** −0.912** −0.436** −0.283** −0.286 −0.169 0.208*
      2 −0.749** −0.958** −0.953** −0.596** −0.456** −0.311 −0.408** −0.020
      3 −0.742** −0.896** −0.942** −0.560** −0.458** −0.051 −0.211 −0.046
      4 −0.729** −0.957** −0.971** −0.560** −0.431** −0.310* 0.119 −0.022
      5 −0.657** −0.928** −0.923** −0.415** −0.330** −0.262 −0.480** 0.233**
        注:*表示高径比与树高或与胸径有显著相关;**表示高径比与树高或与胸径有极显著相关。
        Note: *means that the height-to-diameter ratio is significantly correlated with tree height or with DBH;** means that the height-to-diameter ratio is extremely significantly correlated with tree height or with DBH.

      Table 3.  Correlation of tree height-to-diameter ratio in each stratum with DBH and tree height

    • 采用式(1)和式(2)拟合各样地各林层林木高径比与胸径关系曲线,具体参数值和评价指标结果如表4所示,采用指数函数能很好地描述第Ⅰ亚层、第Ⅱ亚层林木高径比与胸径关系曲线,R2分别为0.852~0.906和0.830~0.914;而拟合全林分和第Ⅲ亚层的R2明显偏小,其中全林分(0.465~0.575)高于第Ⅲ亚层(0.202~0.399)。采用双曲线函数拟合第Ⅰ亚层、第Ⅱ亚层林木高径比与胸径关系曲线的效果也很好,R2分别为0.874~0.937和0.856~0.968;而拟合全林分和第Ⅲ亚层的R2也明显偏小,其中全林分(0.387~0.536)高于第Ⅲ亚层(0.186~0.350)。采用上述2个模型拟合第Ⅰ亚层、第Ⅱ亚层林木高径比与胸径关系曲线时的R2均明显高于第Ⅲ亚层,其原因是林木高径比在第Ⅲ亚层时比在第Ⅰ、Ⅱ亚层时受到更多因素的影响,比如竞争因素对第Ⅲ亚层林木高径比可能有较大影响(相对于第Ⅰ、Ⅱ亚层)。

      样地号
      Sample plot
      层属
      Stratum
      指数函数 Exponential function 双曲线函数 Hyperbolic curve
      参数 Parameters 评价指标 Evaluation indicators参数 Parameters 评价指标 Evaluation indicators
      abR2RMSEAMRabR2RMSEAMR
      1 S 135.6 −0.015 55 0.465 20.60 16.08 75.42 326.7 0.387 22.06 18.07
      196.1 −0.022 83 0.906 7.48 5.91 12.11 2 508.7 0.930 6.46 4.68
      221.6 −0.038 50 0.830 9.79 8.06 18.15 1 622.2 0.856 9.01 7.12
      154.9 −0.033 07 0.217 21.95 17.94 81.27 276.1 0.201 22.17 18.07
      2 S 132.8 −0.019 68 0.514 22.24 16.94 58.81 411.2 0.511 22.30 17.04
      139.0 −0.014 82 0.893 6.38 4.33 11.27 2 553.8 0.924 5.35 4.31
      185.0 −0.032 70 0.878 7.90 6.39 18.61 1 484.1 0.914 6.62 5.11
      157.1 −0.039 64 0.356 23.75 17.84 62.37 377.2 0.341 24.04 18.26
      3 S 142.4 −0.022 14 0.575 21.02 15.80 61.48 418.6 0.536 21.97 17.45
      155.0 −0.019 05 0.862 6.45 5.23 10.83 2 354.9 0.909 5.25 4.18
      193.0 −0.032 93 0.875 8.95 6.82 10.11 1 760.3 0.916 7.34 5.77
      160.0 −0.036 57 0.359 22.23 16.99 71.59 344.4 0.326 22.79 17.94
      4 S 138.3 −0.019 87 0.568 21.41 15.83 61.83 406.5 0.504 22.93 17.75
      167.8 −0.021 87 0.905 6.63 5.48 11.20 2 203.9 0.937 5.39 4.38
      280.4 −0.051 90 0.914 11.35 9.40 0.51 1 879.3 0.968 6.88 5.63
      158.1 −0.037 91 0.399 21.83 16.35 65.24 372.4 0.350 22.72 17.68
      5 S 135.3 −0.018 33 0.488 22.21 17.05 66.58 363.9 0.428 23.46 18.57
      145.7 −0.017 10 0.852 7.00 5.12 12.28 2 351.2 0.874 6.46 4.46
      175.9 −0.028 64 0.890 7.99 6.31 21.07 1 502.1 0.897 7.75 6.20
      152.7 −0.034 07 0.202 24.70 19.72 77.25 284.6 0.186 24.94 19.93

      Table 4.  Parameters and evaluation indicators of each equation

      对比2个模型的拟合效果可知,指数函数在拟合全林分和第Ⅲ亚层时的R2相对较高,RMSEAMR相对较小,而双曲线函数在拟合第Ⅰ亚层和第Ⅱ亚层时的R2相对较高,RMSEAMR相对较小。因此,选用指数函数描述全林分和第Ⅲ亚层林木高径比-胸径关系,选用双曲线函数描述第Ⅰ亚层和第Ⅱ亚层林木高径比-胸径关系,关系曲线拟合结果如图1

    4.   讨论
    • 在研究各亚层高径比与胸径关系曲线时,由于第Ⅰ、Ⅱ亚层林木相对较少,可能会对研究结果产生影响,本研究尝试将相对位置较近、树种组成类似的2和3号样地、4和5号样地合成2个新的样地,用以分析第Ⅰ、Ⅱ亚层高径比与胸径关系,结果表明,新样地第Ⅰ、Ⅱ亚层高径比与胸径关系特征与原样地的一致。

      本研究结果表明,中亚热带典型天然阔叶林各林层林木高径比与胸径均呈现极显著负相关,这与其他学者对人工针叶林全林林木高径比 [4,15]和天然针叶林全林林木高径比[13]的研究结论基本一致,也与其他学者对天然针阔混交林主要树种的林木高径比研究结论基本一致[17]。典型中亚热带天然阔叶林各林层林木高径比与树高的关系较为复杂且相关系数绝对值都较低(即相关性不高),这与其他学者对人工针叶林林木高径比[4]的研究结论基本一致,也与其他学者对天然针阔混交林主要树种的林木高径比研究结论基本一致[17]。目前对人工针叶林全林林木高径比与树高关系的研究有正相关 [4],对天然针阔混交林主要树种的林木高径比与树高关系的研究有负相关[17],而本研究各亚层林木高径比与树高的关系较为复杂,有负相关、也有正相关,有不显著相关、显著相关、也有极显著相关,这种林木高径比与树高关系的复杂性是否正是典型天然阔叶林所特有的特征有待进一步深入研究。

    5.   结论
    • 典型中亚热带天然阔叶林林木高径比会因所属亚层的不同而变化,因此有必要分亚层来探讨林木高径比与胸径及树高关系;同一亚层的林木高径比也会因胸径不同而变化,各林层林木高径比与胸径均呈现极显著负相关且相关系数都较高,其关系曲线拟合是有意义且必要的,双曲线函数能很好地描述第Ⅰ亚层和第Ⅱ亚层的关系曲线,指数函数更适合描述全林分和第Ⅲ亚层的关系曲线;各林层林木高径比与树高的关系较为复杂且相关系数都较低,其关系曲线拟合是没有意义的;典型中亚热带天然阔叶林林木高径比特征需要且可以采用各林层林木高径比与胸径的关系曲线来表达。

Reference (28)

Catalog

    /

    DownLoad:  Full-Size Img  PowerPoint
    Return
    Return