• 中国中文核心期刊
  • 中国科学引文数据库(CSCD)核心库来源期刊
  • 中国科技论文统计源期刊(CJCR)
  • 第二届国家期刊奖提名奖
Volume 35 Issue 5
Oct.  2022
Article Contents
Turn off MathJax

Citation:

Response of the suitable distribution areas of Prunus pedunculata to Climate Change

  • Objective To reveal the response of suitable distribution of Prunus pedunculata to climate change. Method Based on the field investigation, MaxEnt and ArcGIS software were used to predict the change of suitable distribution area of Prunus pedunculata in the future climate scenario. Results The suitable distribution region of Prunus pedunculata was mainly concentrated in China, Mongolia and Russia, and the distribution area located in 97.23°-122.62° E and 35.49°-54.91° N. Under the reference climate (1970−2000) scenario, the medium and high suitable distribution area are mainly located in China. Seasonality Precipitation (bio15, Coefficient of Variation) was the climate variable with the highest score in the prediction process. Under the four future (2021−2100) climate scenarios (SSP1-2.6, SSP2-4.5, SSP3-7.0 and SSP5-8.5) , the geometric center of the suitable distribution area would move to the northwest. In the scenario of increased emissions, the average migration rate of geometric centers increased. Conclusion Seasonality Precipitation (bio15) is the most critical variable to limit the distribution of Prunus pedunculata. The suitable distribution area of Prunus pedunculata trends to migrate to the northwest. Under the high emission scenario, the change of the suitable distribution region is more active than the low emission scenario.
  • 加载中
  • [1]

    Acevedo M A, Beaudrot L, Meléndez-Ackerman E J, et al. Local extinction risk under climate change in a neotropical asymmetrically dispersed epiphyte[J]. Journal of Ecology, 2020, 108(4): 1553-1564. doi: 10.1111/1365-2745.13361
    [2]

    Lenoir J, Gégout J C, Marquet P A, et al. A significant upward shift in plant species optimum elevation during the 20th century[J]. Science, 2008, 320(5884): 1768-1771. doi: 10.1126/science.1156831
    [3] 黄来明, 邵明安, 裴艳武, 等. 沙地濒危植物长柄扁桃生物学特性与抗逆性及应用综述[J]. 土壤, 2019, 51(2):217-223.

    [4] 孙树臣, 邵明安, 翟 胜, 等. 沙地长柄扁桃研究进展[J]. 林业科技通讯, 2020, 30(4):20-26.

    [5]

    Elith J, Graham C H. Do they? How do they? Why do they differ? On finding reasons for differing performances of species distribution models[J]. Ecography, 2009, 32(1): 66-77. doi: 10.1111/j.1600-0587.2008.05505.x
    [6]

    Phillips S J, Anderson R P, Schapire R E. Maximum entropy modeling of species geographic distributions[J]. Ecological Modelling, 2006, 190(3-4): 231-259. doi: 10.1016/j.ecolmodel.2005.03.026
    [7]

    Phillips S J, Miroslav D. Modeling of species distributions with maxent: new extensions and a comprehensive evaluation[J]. Ecography, 2008, 31(2): 161-175. doi: 10.1111/j.0906-7590.2008.5203.x
    [8]

    Saatchi S, Buermann W, Steege H, et al. Modeling distribution of Amazonian tree species and diversity using remote sensing measurements[J]. Remote Sensing of Environment, 2008, 112(5): 2000-2017. doi: 10.1016/j.rse.2008.01.008
    [9]

    Yi Y J, Cheng X, Yang Z F, et al. Evaluating the ecological influence of hydraulic projects: A review of aquatic habitat suitability models[J]. Renewable and Sustainable Energy Reviews, 2017, 68: 748-762. doi: 10.1016/j.rser.2016.09.138
    [10]

    Li J J, Fan G, He Y. Predicting the current and future distribution of three Coptis herbs in China under climate change conditions, using the MaxEnt model and chemical analysis[J]. Science of the Total Environment, 2020, 698: 134141. doi: 10.1016/j.scitotenv.2019.134141
    [11]

    Yang X Q, Kushwaha S P S, Saran S, et al. Maxent modeling for predicting the potential distribution of medicinal plant, Justicia adhatoda L. in Lesser Himalayan foothills[J]. Ecological Engineering, 2013, 51: 83-87. doi: 10.1016/j.ecoleng.2012.12.004
    [12]

    Zhang K L, Zhang Y, Zhou C, et al. Impact of climate factors on future distributions of Paeonia ostii across China estimated by MaxEnt[J]. Ecological Informatics, 2019, 50: 62-57. doi: 10.1016/j.ecoinf.2019.01.004
    [13] 王 伟, 田荣荣, 那立妍, 等. 基于MaxEnt生态软件划分澳洲坚果的潜在地理适生区[J]. 林业科学研究, 2017, 30(3):444-449.

    [14]

    Wang W, Li Z J, Zhang Y L, et al. Current situation, global potential distribution and evolution of six almond species in China[J]. Frontiers in Plant Science, 2021, 12: 619883. doi: 10.3389/fpls.2021.619883
    [15]

    Zhang J M, Song M L, Li Z J, et al. Effects of climate change on the distribution of Akebia quinata[J]. Frontiers in Ecology and Evolution, 2021, 9: 752682. doi: 10.3389/fevo.2021.752682
    [16]

    Zhang J M, Peng X Y, Song M L, et al. Effects of climate change on the distribution of wild Akebia trifoliata[J]. Ecology and Evolution, 2022, 12: e8714.
    [17]

    Fick S E, Hijmans R J. WorldClim 2: new 1-km spatial resolution climate surfaces for global land areas[J]. International Journal of Climatology, 2017, 37(12): 4302-4315. doi: 10.1002/joc.5086
    [18]

    Li Y C, Li M Y, Li C, et al. Optimized maxent model predictions of climate change impacts on the suitable distribution of Cunninghamia lanceolata in China[J]. Forests, 2020, 11(3): 302. doi: 10.3390/f11030302
    [19]

    Sillero N, Barbosa A M. Common mistakes in ecological niche models[J]. International Journal of Geographical Information Science, 2021, 35(2): 213-226. doi: 10.1080/13658816.2020.1798968
    [20] 潘浪波, 段 伟, 黄有军. 基于MaxEnt模型预测薄壳山核桃在中国的种植区[J]. 浙江农业大学学报, 2022, 39(1):76-83.

    [21] 王小军, 刘广旭, 肖 彤. 气候变化情景下油茶生长的适宜性特征[J]. 热带地理, 2020, 40(5):868-880.

    [22]

    Zhang K L, Yao L J, Meng J S, et al. Maxent modeling for predicting the potential geographical distribution of two peony species under climate change[J]. Science of the Total Environment, 2018, 634(1): 1326-1334.
    [23]

    Soilhi Z, Sayari N, Benalouache N, et al. Predicting current and future distributions of Mentha pulegium L. in Tunisia under climate change conditions, using the MaxEnt model[J]. Ecological Informatics, 2022, 68: 101533. doi: 10.1016/j.ecoinf.2021.101533
    [24]

    Gou Y L, Li X, Zhao Z F, et al. Modeling the distribution of Zanthoxylum armatum in China with MaxEnt modeling[J]. Global Ecology and Conservation, 2019, 9: e00691.
    [25]

    Gou Y L, Li X, Zhao Z F, et al. Prediction of the potential geographic distribution of the ectomycorrhizal mushroom Tricholoma matsutake under multiple climate change scenarios[J]. Scientific reports, 2017, 7: 46221. doi: 10.1038/srep46221
    [26]

    Hampe A, Petit R J. Conserving biodiversity under climate change: the rear edge matters[J]. Ecology letters, 2005, 8(5): 461-467. doi: 10.1111/j.1461-0248.2005.00739.x
    [27]

    Ramírez-Preciado R P, Gasca-Pineda J, Arteaga M C. Effects of global warming on the potential distribution ranges of six Quercus species (Fagaceae)[J]. Flora, 2019, 251: 32-38. doi: 10.1016/j.flora.2018.12.006
    [28]

    Thuiller W, Albert C, Araújo M B, et al. Predicting global change impacts on plant species' distributions: Future challenges[J]. Perspectives in Plant Ecology, Evolution and Systematics, 2008, 9(3-4): 137-152. doi: 10.1016/j.ppees.2007.09.004
  • 加载中
通讯作者: 陈斌, bchen63@163.com
  • 1. 

    沈阳化工大学材料科学与工程学院 沈阳 110142

  1. 本站搜索
  2. 百度学术搜索
  3. 万方数据库搜索
  4. CNKI搜索

Figures(4) / Tables(1)

Article views(3785) PDF downloads(69) Cited by()

Proportional views

Response of the suitable distribution areas of Prunus pedunculata to Climate Change

    Corresponding author: SONG Min-li, minlisong@126.com
    Corresponding author: XU Xin-qiao, xuxinqiao210@126.com
  • 1. Department of Biology, Taiyuan Normal University, Jinzhong 030619, Shanxi, China
  • 2. Research Institute of Forestry, Chinese Academy of Forestry, Beijing 100091, China
  • 3. Yuyang District Forest and Grass Ecological Restoration Center, Yulin 719000, Shaanxi, China
  • 4. Shaanxi Academy of Forestry, Xi’an 710082, Shaanxi, China
  • 5. Technology Research Center of Amygdalus Pedunculata of State Forestry and Grassland Administration, Yulin 719000, Shaanxi, China

Abstract:  Objective To reveal the response of suitable distribution of Prunus pedunculata to climate change. Method Based on the field investigation, MaxEnt and ArcGIS software were used to predict the change of suitable distribution area of Prunus pedunculata in the future climate scenario. Results The suitable distribution region of Prunus pedunculata was mainly concentrated in China, Mongolia and Russia, and the distribution area located in 97.23°-122.62° E and 35.49°-54.91° N. Under the reference climate (1970−2000) scenario, the medium and high suitable distribution area are mainly located in China. Seasonality Precipitation (bio15, Coefficient of Variation) was the climate variable with the highest score in the prediction process. Under the four future (2021−2100) climate scenarios (SSP1-2.6, SSP2-4.5, SSP3-7.0 and SSP5-8.5) , the geometric center of the suitable distribution area would move to the northwest. In the scenario of increased emissions, the average migration rate of geometric centers increased. Conclusion Seasonality Precipitation (bio15) is the most critical variable to limit the distribution of Prunus pedunculata. The suitable distribution area of Prunus pedunculata trends to migrate to the northwest. Under the high emission scenario, the change of the suitable distribution region is more active than the low emission scenario.

  • 气候变化对物种的地理分布、物候及其他生命特征和进展有相当大的影响,这些影响导致了物种的加速繁荣或灭绝[1-2]。了解物种如何应对气候变化对于物种的持续保护和监管非常重要。

    长柄扁桃(Prunus pedunculata Pall.)作为我国乡土树种,是珍贵的野生果树种质资源;其拥有耐干旱、耐瘠薄的特性,可在干旱、半干旱的沙区或土石山区生长,具有良好的生态效益。同时,长柄扁桃作为一种新型木本油料作物,具有良好的经济价值[3-4]。2020年11月18日,国家发展和改革委员会、国家林业和草原局等十部委联合下发《关于科学利用林地资源 促进木本粮油和林下经济高质量发展的意见》(发改农经〔2020〕1753号),该文件明确提出,要在北方干旱区适当发展长柄扁桃产业。了解长柄扁桃的适宜分布区及其对气候变化的响应,对于长柄扁桃产业的发展至关重要。

    生态位模型是预测物种的潜在地理分布(即适宜分布区)和生境适宜性评估的有效手段,其中,最大熵模型(MaxEnt),利用现有的物种分布信息结合环境数据,可准确地预测物种的潜在地理分布[5-7]。利用MaxEnt开展预测,即使物种分布信息不足,也具有良好的准确性[8-9]。模型以现有物种分布点的气候变量为约束条件,假设该物种将出现在气候条件适宜的所有区域,但不出现在任何气候条件不适宜的区域,从而获得物种的适宜分布区[6]。目前,MaxEnt已被广泛用于预测物种分布以及物种分布与气候变化之间的响应关系[10-14]

    目前,尚缺乏有关长柄扁桃适宜分布区响应气候变化的研究。本研究利用生态位模型,初步探讨了长柄扁桃在未来不同气候情景下的分布情况,以期揭示其适宜分布区应对气候变化的响应。

    • 本研究中459个长柄扁桃的地理数据来自实地调查(2013—2019)和网络数据平台。实地调查时利用GPS采集分布点地理数据(实地调查获得433个地理数据,全部分布在中国)。网络平台的数据(共26个,19个位于蒙古,7个位于俄罗斯)来源于全球生物多样性信息平台 (GBIF)(http://www.Gbif.org/)。

    • 本研究采用19个生物气候变量来预测物种的适宜分布,生物气候变量分别为:年均温(bio1)、平均气温日较差(bio2)、等温性(bio3)、温度季节性(bio4)、最温暖月份的最高温度(bio5)、最冷月份的最低温度(bio6)、温度年变化范围(bio7)、最潮湿季度的平均温度(bio8)、最干燥季度的平均温度(bio9)、最温暖季度的平均温度(bio10)、最冷季度的平均温度(bio11)、年降水量(bio12)、最潮湿月份的降水量(bio13)、最干燥月份的降水量(bio14)、降水季节性变化(bio15)、最潮湿季度的降水量(bio16)、最干燥季度的降水量(bio17)、最温暖季度的降水量(bio18)、最冷季度的降水量(bio19)。所用的气候情景包括基准气候情景和未来气候情景,所有情景均包含有19个生物气候变量。基准气候情景的时间跨度为1970—2000年,每个生物气候变量取值为31年间的平均值。未来气候情景有4个,依据CO2排放体量分为低排放情景(SSP1-2.6),中等排放情景(SSP2-4.5),中高排放情景(SSP3-7.0)和高排放情景(SSP5-8.5)[15-16],时间跨度为未来80 a(2021—2100),有4个分段2021—2040、2041—2060、2061—2080和2081—2100,每个情景均包括4个时间分段,每个时间分段内生物气候变量取值为20 a间的平均值。以上所有情景数据精度为2.5弧分(2.5 km),均来自世界气候数据库(http://www.worldclim.org/[17]。为了便于记录,未来气候情景中每20 a的时间尺度仅用起始年份标记,例:2021—2040 仅标记为 2021。

    • 用MaxEnt(版本3.4.4)预测长柄扁桃的适宜分布区,将分布数据以25%的占比作为检验集,75%的占比作为训练集输入MaxEnt模型中,将模型运行10次以计算平均值,其他参数是软件默认值。模型输出数据包括预测结果、受试者工作特征(ROC)曲线、刀切法(Jackknife)检验结果和变量贡献率统计表等。

      为避免变量间的高相关性导致模型过度拟合,在运行全变量预测后对气候变量进行筛选[18-19]。使用筛选后剩余变量,重新编译MaxEnt模型,模型的计算效率和预测精度都将得到提高。筛选过程如下:

      (1)在SPSS(版本26.0)软件中用皮尔逊相关系数(Pearson correlation coefficient)计算19个气候变量两两之间的相关性。

      (2)删除预测过程中贡献率百分比过小的变量(贡献率百分比<1%)。在剩余具有高相关性的变量中(相关系数绝对值大于0.8),留下贡献率最高的变量。将筛选后的变量用于重新编译模型。

    • 使用 ArcGIS (版本10.2)中的To Raster工具将 MaxEnt 导出的 ASCII 文件转换为栅格图层(长柄扁桃适宜分布区被包含在该图层中)。模型预测的适宜度值(也称物种存在概率“P”)为连续栅格数据,数值范围为 0~1。使用ArcGIS中的Reclassify工具和人工分级方法,将适宜度值分为4个等级:不适宜(0 ≤ P < 0.15)、低适宜(0.15 ≤ P < 0.33)、中等适宜(0.33 ≤ P < 0.66)和高适宜(P > 0.66),以地图形式导出。

    • 由于适宜分布区域的边缘不规则,用适宜分布区几何中心的运动来表示其变化更为合适,也更具代表性。对长柄扁桃适宜分布区几何中心的提取涉及ArcGIS中的3个工具:Raster Calculator工具、Raster Domain工具和Mean Center工具。首先,使用Raster Calculator工具来切取栅格图层,只保留适宜分布区这部分栅格数据。然后,使用Raster Domain工具将适宜分布区域栅格数据转换为平面图形。最后,使用Mean Center工具提取出平面图形的几何中心,即长柄扁桃适宜分布区的几何中心。

    2.   结果和分析
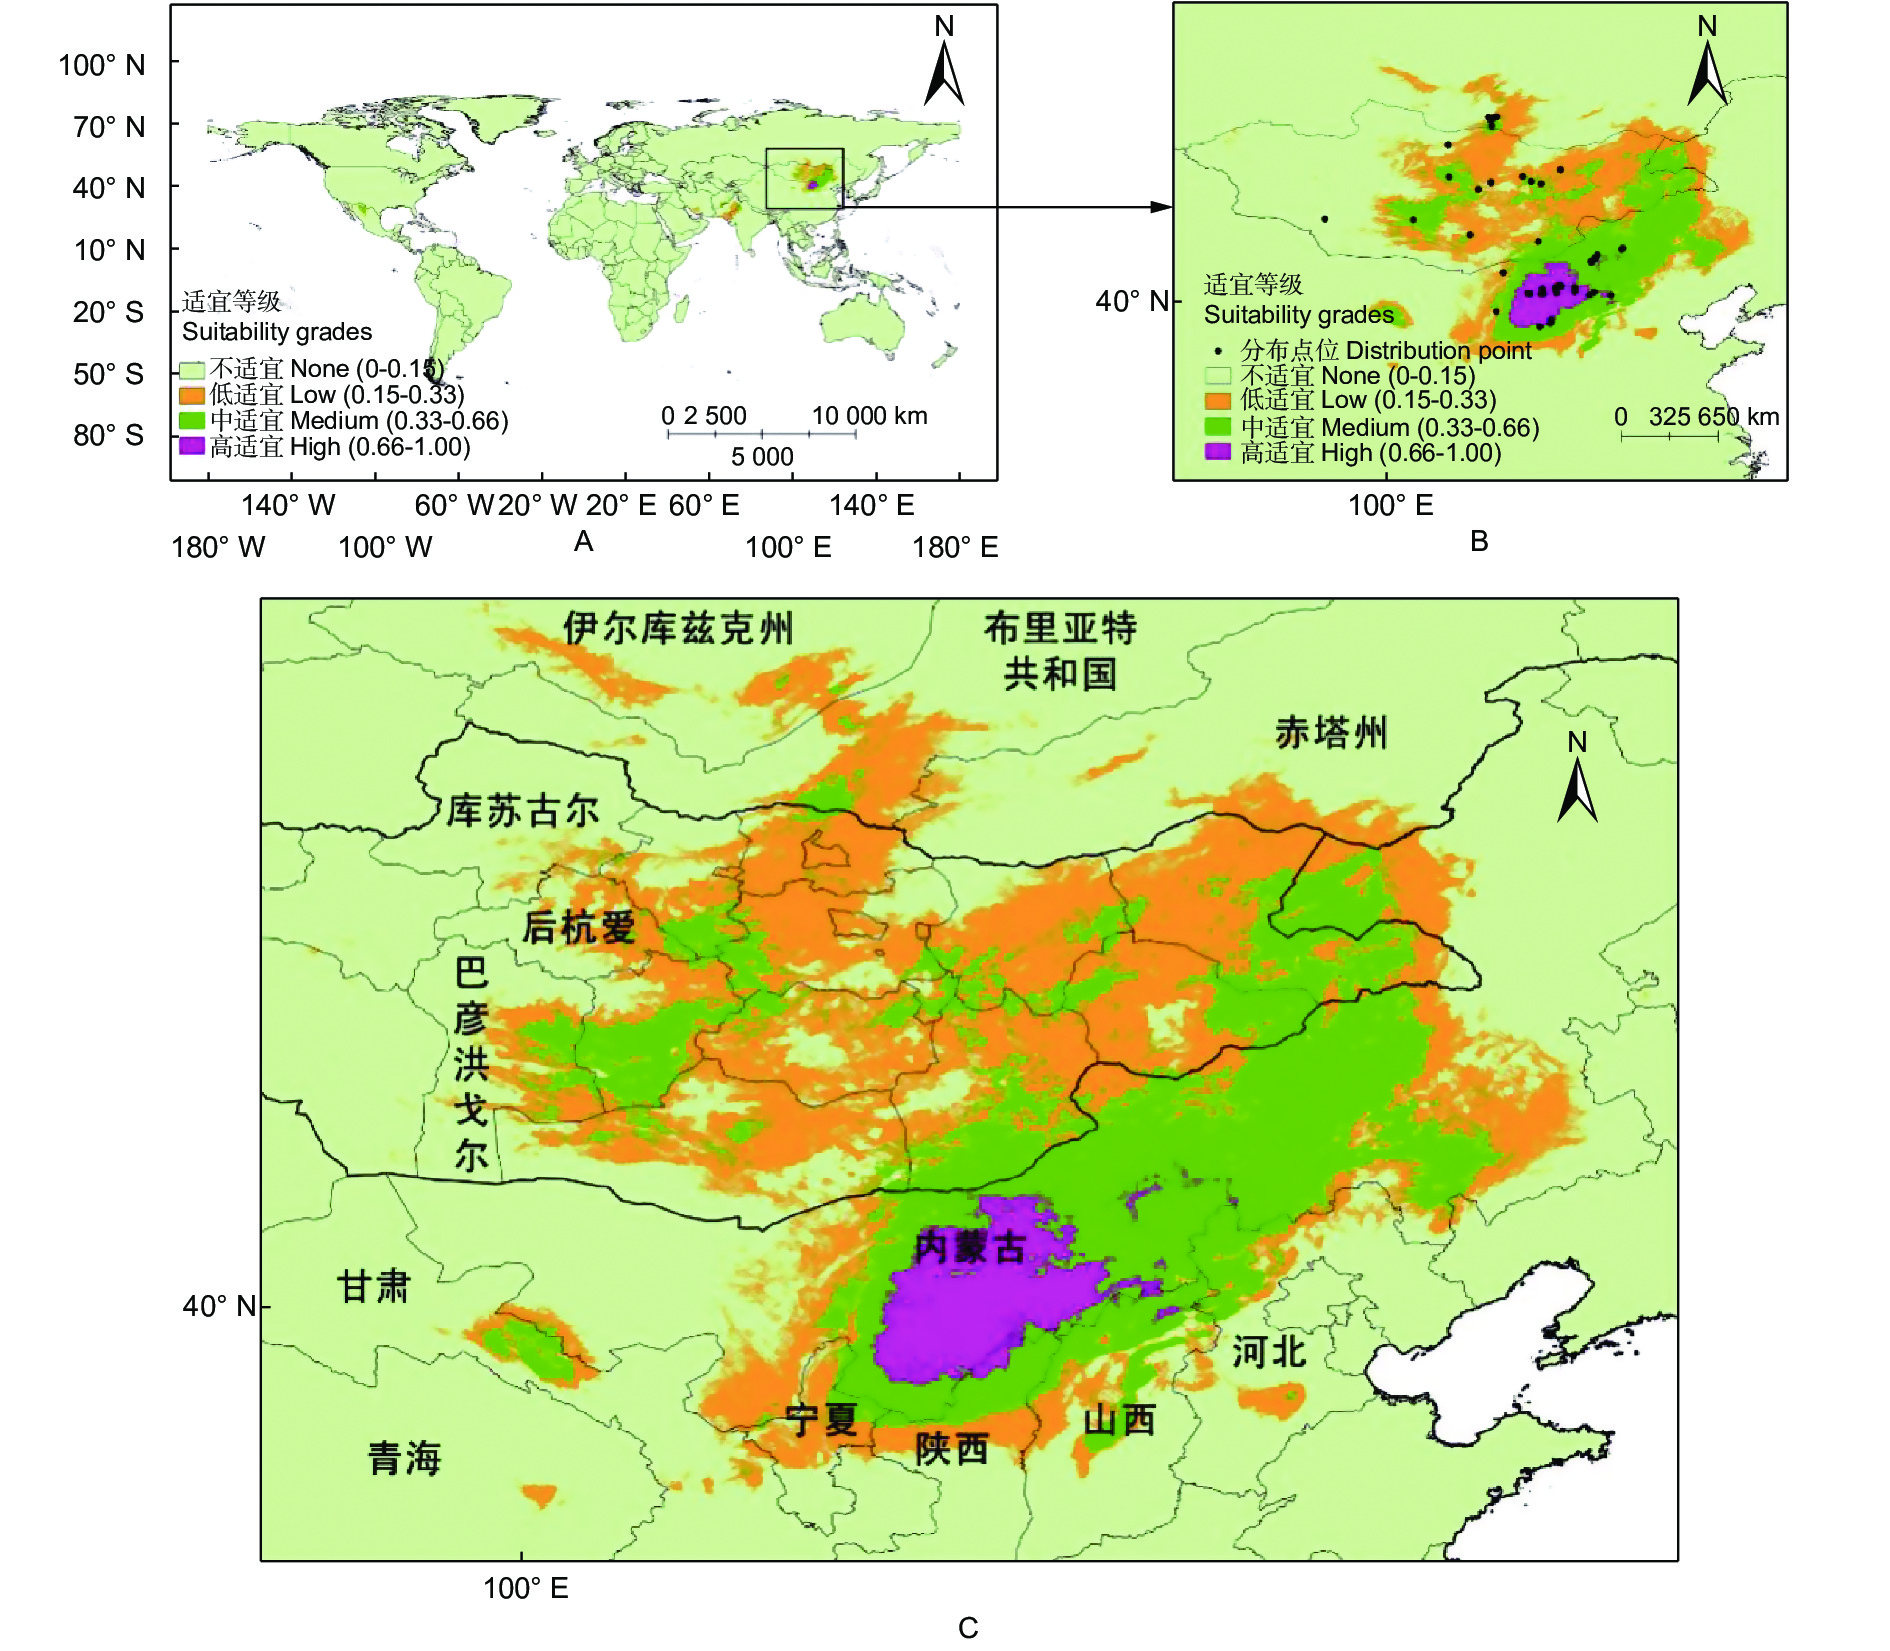
    • 预测结果表明:基准气候情景(1970—2000)下,长柄扁桃的适宜分布区集中在中国、蒙古和俄罗斯三国境内(图1,即长柄扁桃集中适宜分布区,分布范围为97.23°~122.62° E和35.49°~54.91° N)。在我国,长柄扁桃总适宜面积为94.54 × 10⁴ km2,主要分布在甘肃、青海、宁夏、内蒙古、陕西、山西和河北等地,中、高适宜分布区主要分布在内蒙古,陕西和山西北部有少量高适宜分布区。长柄扁桃在蒙古国的总适宜面积为88.35 × 10⁴ km2,适宜分布区主要分布在库苏古尔、后杭爱和巴彦洪戈尔往东的地区。在俄罗斯,长柄扁桃的总适宜面积为13.33 × 10⁴ km2,集中在伊尔库兹克州、布里亚特共和国和赤塔州南部。

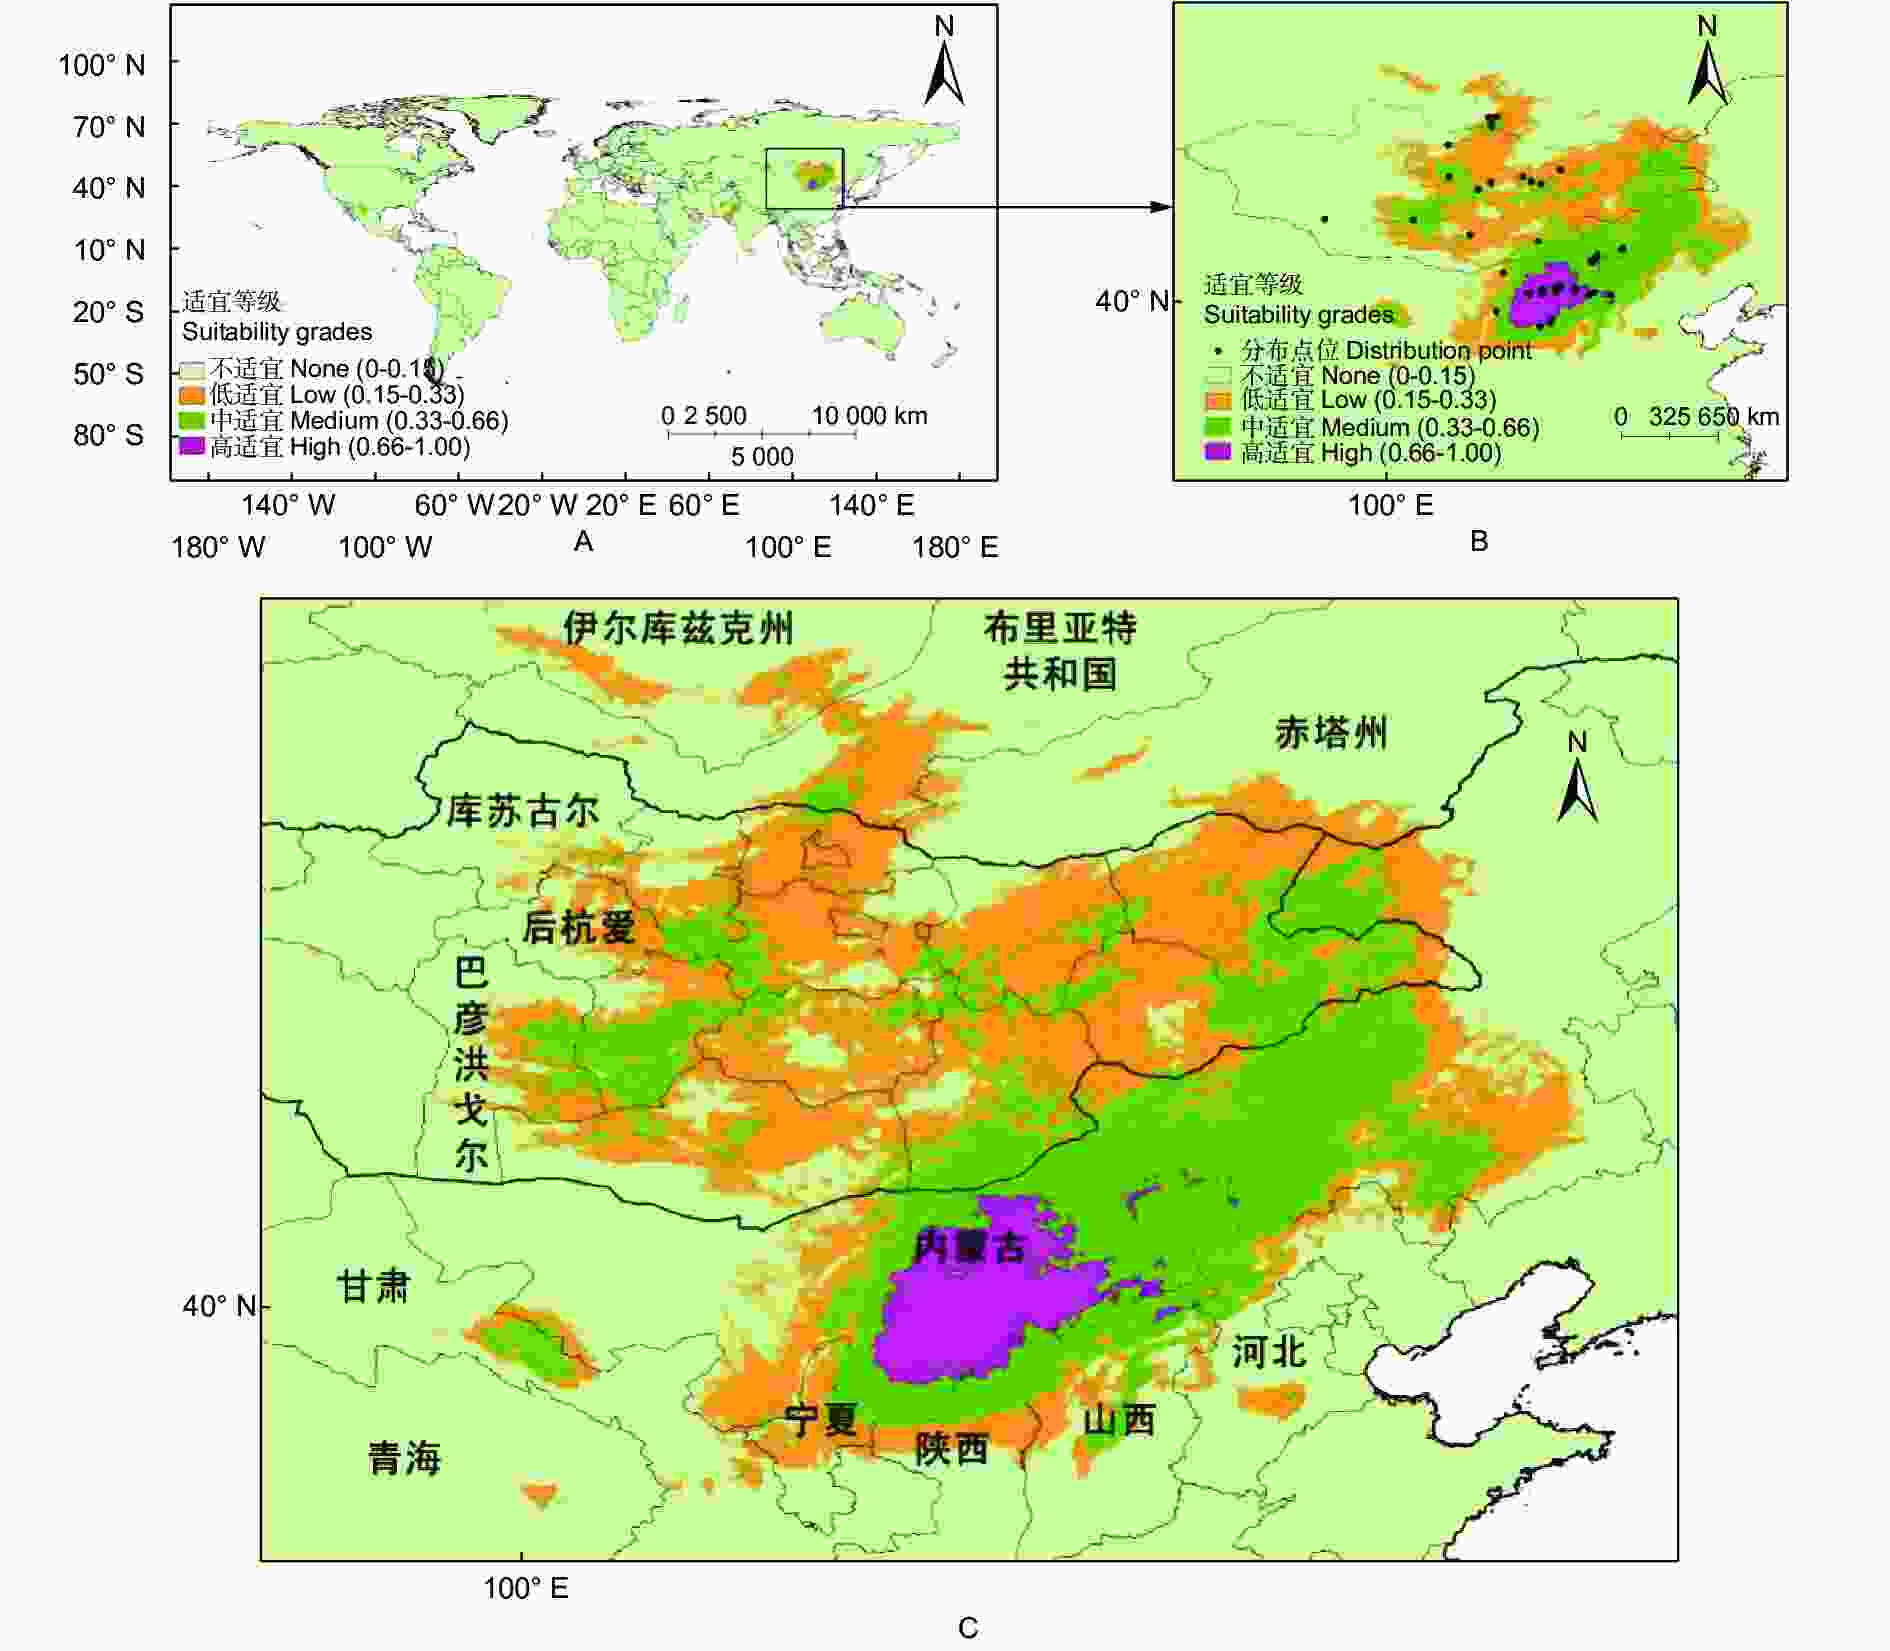
      Figure 1.  Global suitable distribution (A) and concentrated suitable distribution region (B, C) of Prunus pedunculata under the reference climate scenario

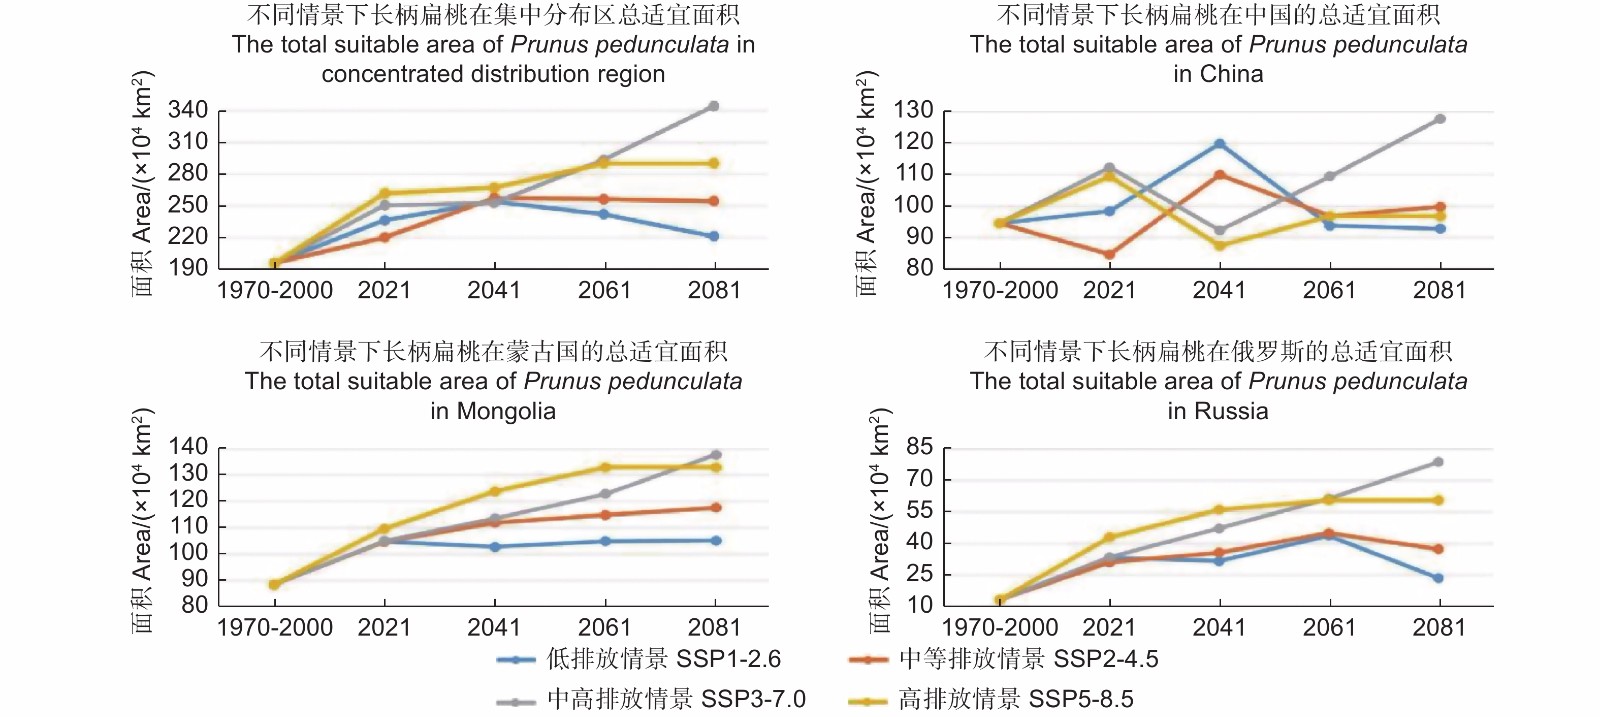
      图2为未来气候情景中(2021—2100)长柄扁桃的适宜分布区面积的变化。2041年前,长柄扁桃集中适宜分布区面积在未来4个气候情景中都呈现增加趋势;2041年后,情景SSP1-2.6中的适宜面积开始减少,情景SSP2-4.5中适宜面积基本保持稳定,情景SSP3-7.0和SSP5-8.5中适宜面积持续增加,并且情景SSP3-7.0中的适宜面积在2061年前超过情景SSP5-8.5,随后持续增加。

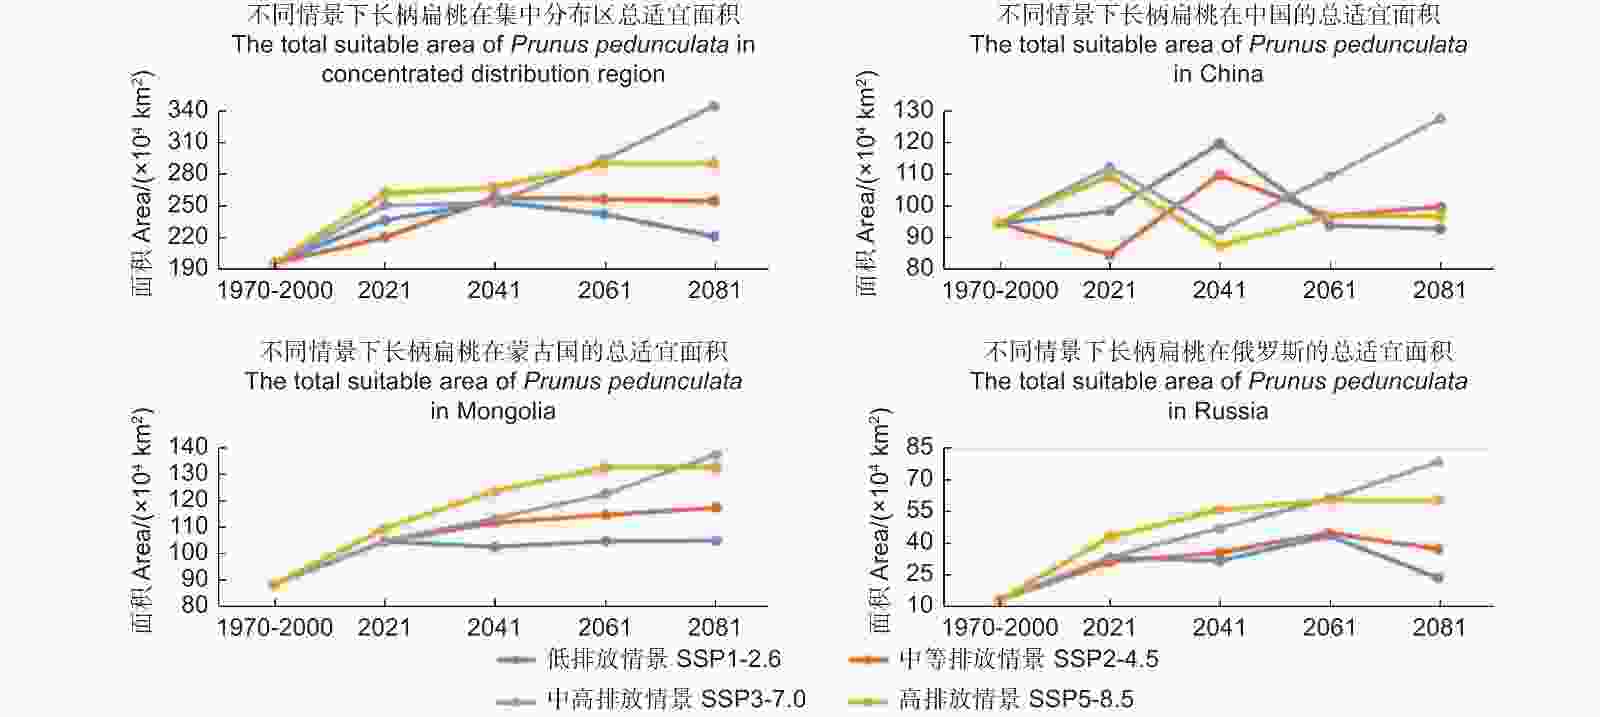
      Figure 2.  Changes of the concentrated suitable distribution area of Prunus pedunculata under different climate scenarios

      在我国境内,4个情景中长柄扁桃适宜面积皆呈波浪状,这表明长柄扁桃适宜面积在我国并不是单一的增加或者减少,应对气候的变化表现出多样性。

      在蒙古境内,2021年前,情景SSP1-2.6中长柄扁桃的适宜面积呈增加趋势,2021年后基本保持稳定,变化较小;其它情景中,适宜面积表现为增长趋势,在2061年前,排放量越大的情景适宜面积增加量也越高,而在2061年后,情景SSP3-7.0中的适宜面积反超情景SSP5-8.5。

      在俄罗斯,情景SSP2-4.5、SSP3-7.0和SSP5-8.5中,长柄扁桃适宜面积在2061年前,都呈增加趋势;2061年后,情景SSP3-7.0中的适宜面积超过情景SSP5-8.5,而情景SSP2-4.5中适宜面积开始减少。与其他情景不同,SSP1-2.6中,适宜面积于2021年前呈增加趋势,随后减少,2041年前后,先减少后增加,而2061年前后类似于2021年,是另外一个峰值点。

    • 19个气候变量经过两两之间的相关性筛选,最终确定5个气候变量(bio1、bio7、bio13、bio15和bio17)用于编译MaxEnt模型的运行。

      刀切法(Jackknife)测试用于分析气候变量对预测结果的影响,以确定每个气候因素的重要性。当单独使用气候变量时,增益最大变量是降水季节性变化(bio15)(图3),表明该变量是预测过程中限制长柄扁桃分布的最关键变量。

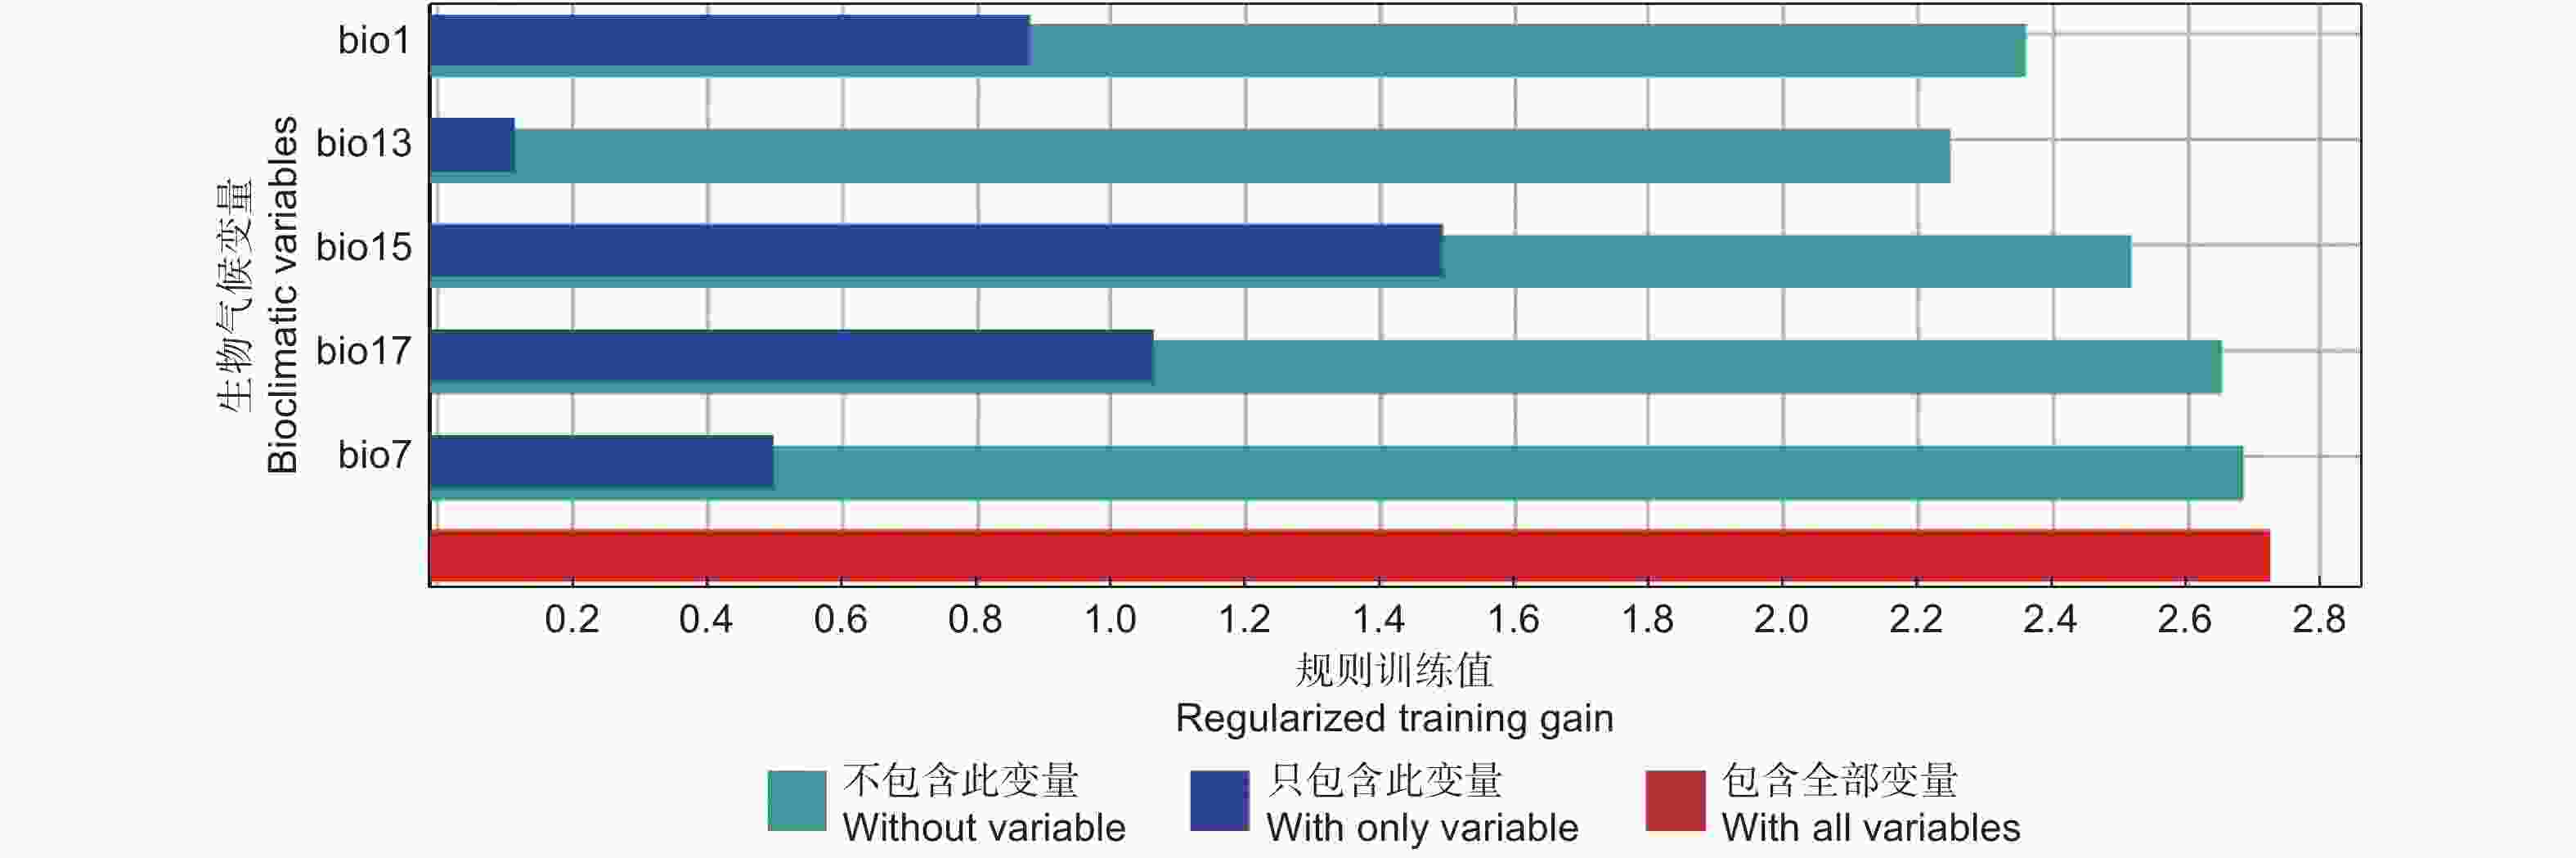
      Figure 3.  Jackknife test for evaluating the relative importance of bioclimatic variables

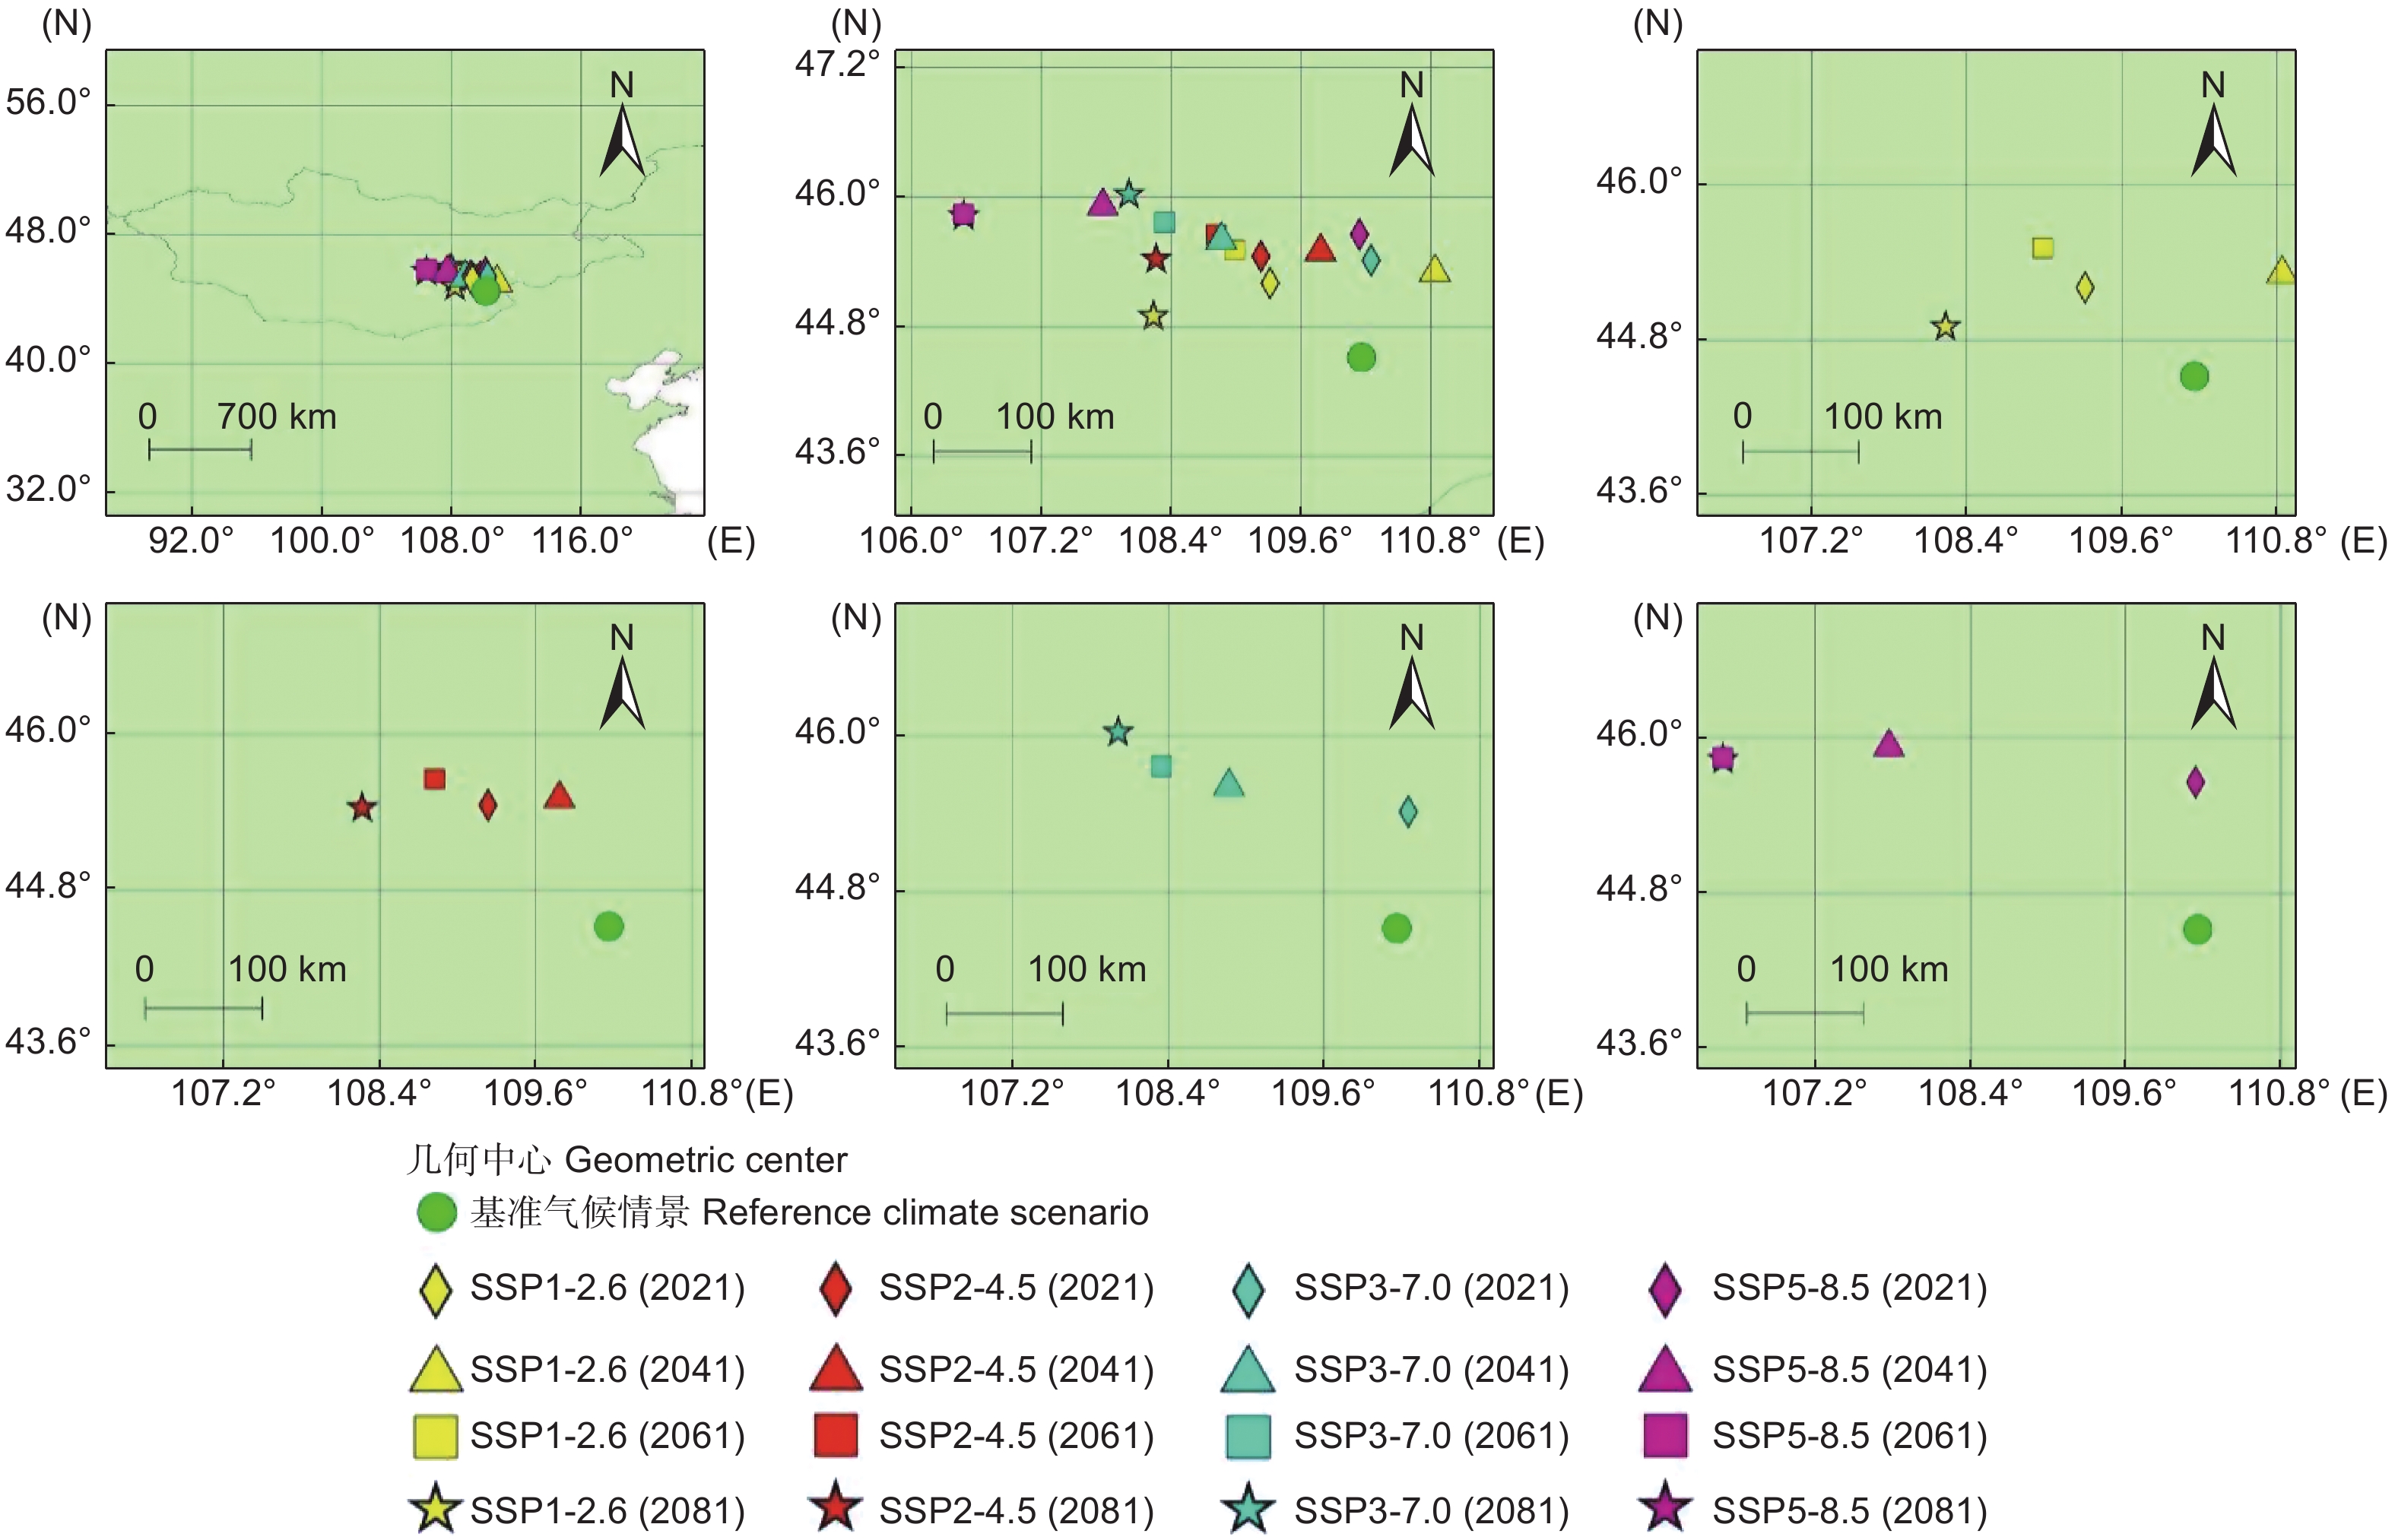
    • 图4显示了基准气候情景和未来4种气候情景下长柄扁桃集中适宜分布区的几何中心。在情景SSP1-2.6中,2021年、2061年和2081年的几何中心位于基准气候情景几何中心的西北方,2041年几何中心位于基准气候情景几何中心的东北方。在情景SSP3-7.0中,2021年几何中心位于基准气候情景几何中心的东北方,其余时间段的几何中心都位于基准气候情景几何中心的西北方。在情景SSP2-4.5和SSP5-8.5中,所有时间段的几何中心全部位于基准气候情景几何中心的西北方。结果表明,未来长柄扁桃集中适宜分区的几何中心整体有往西北方移动的趋势。

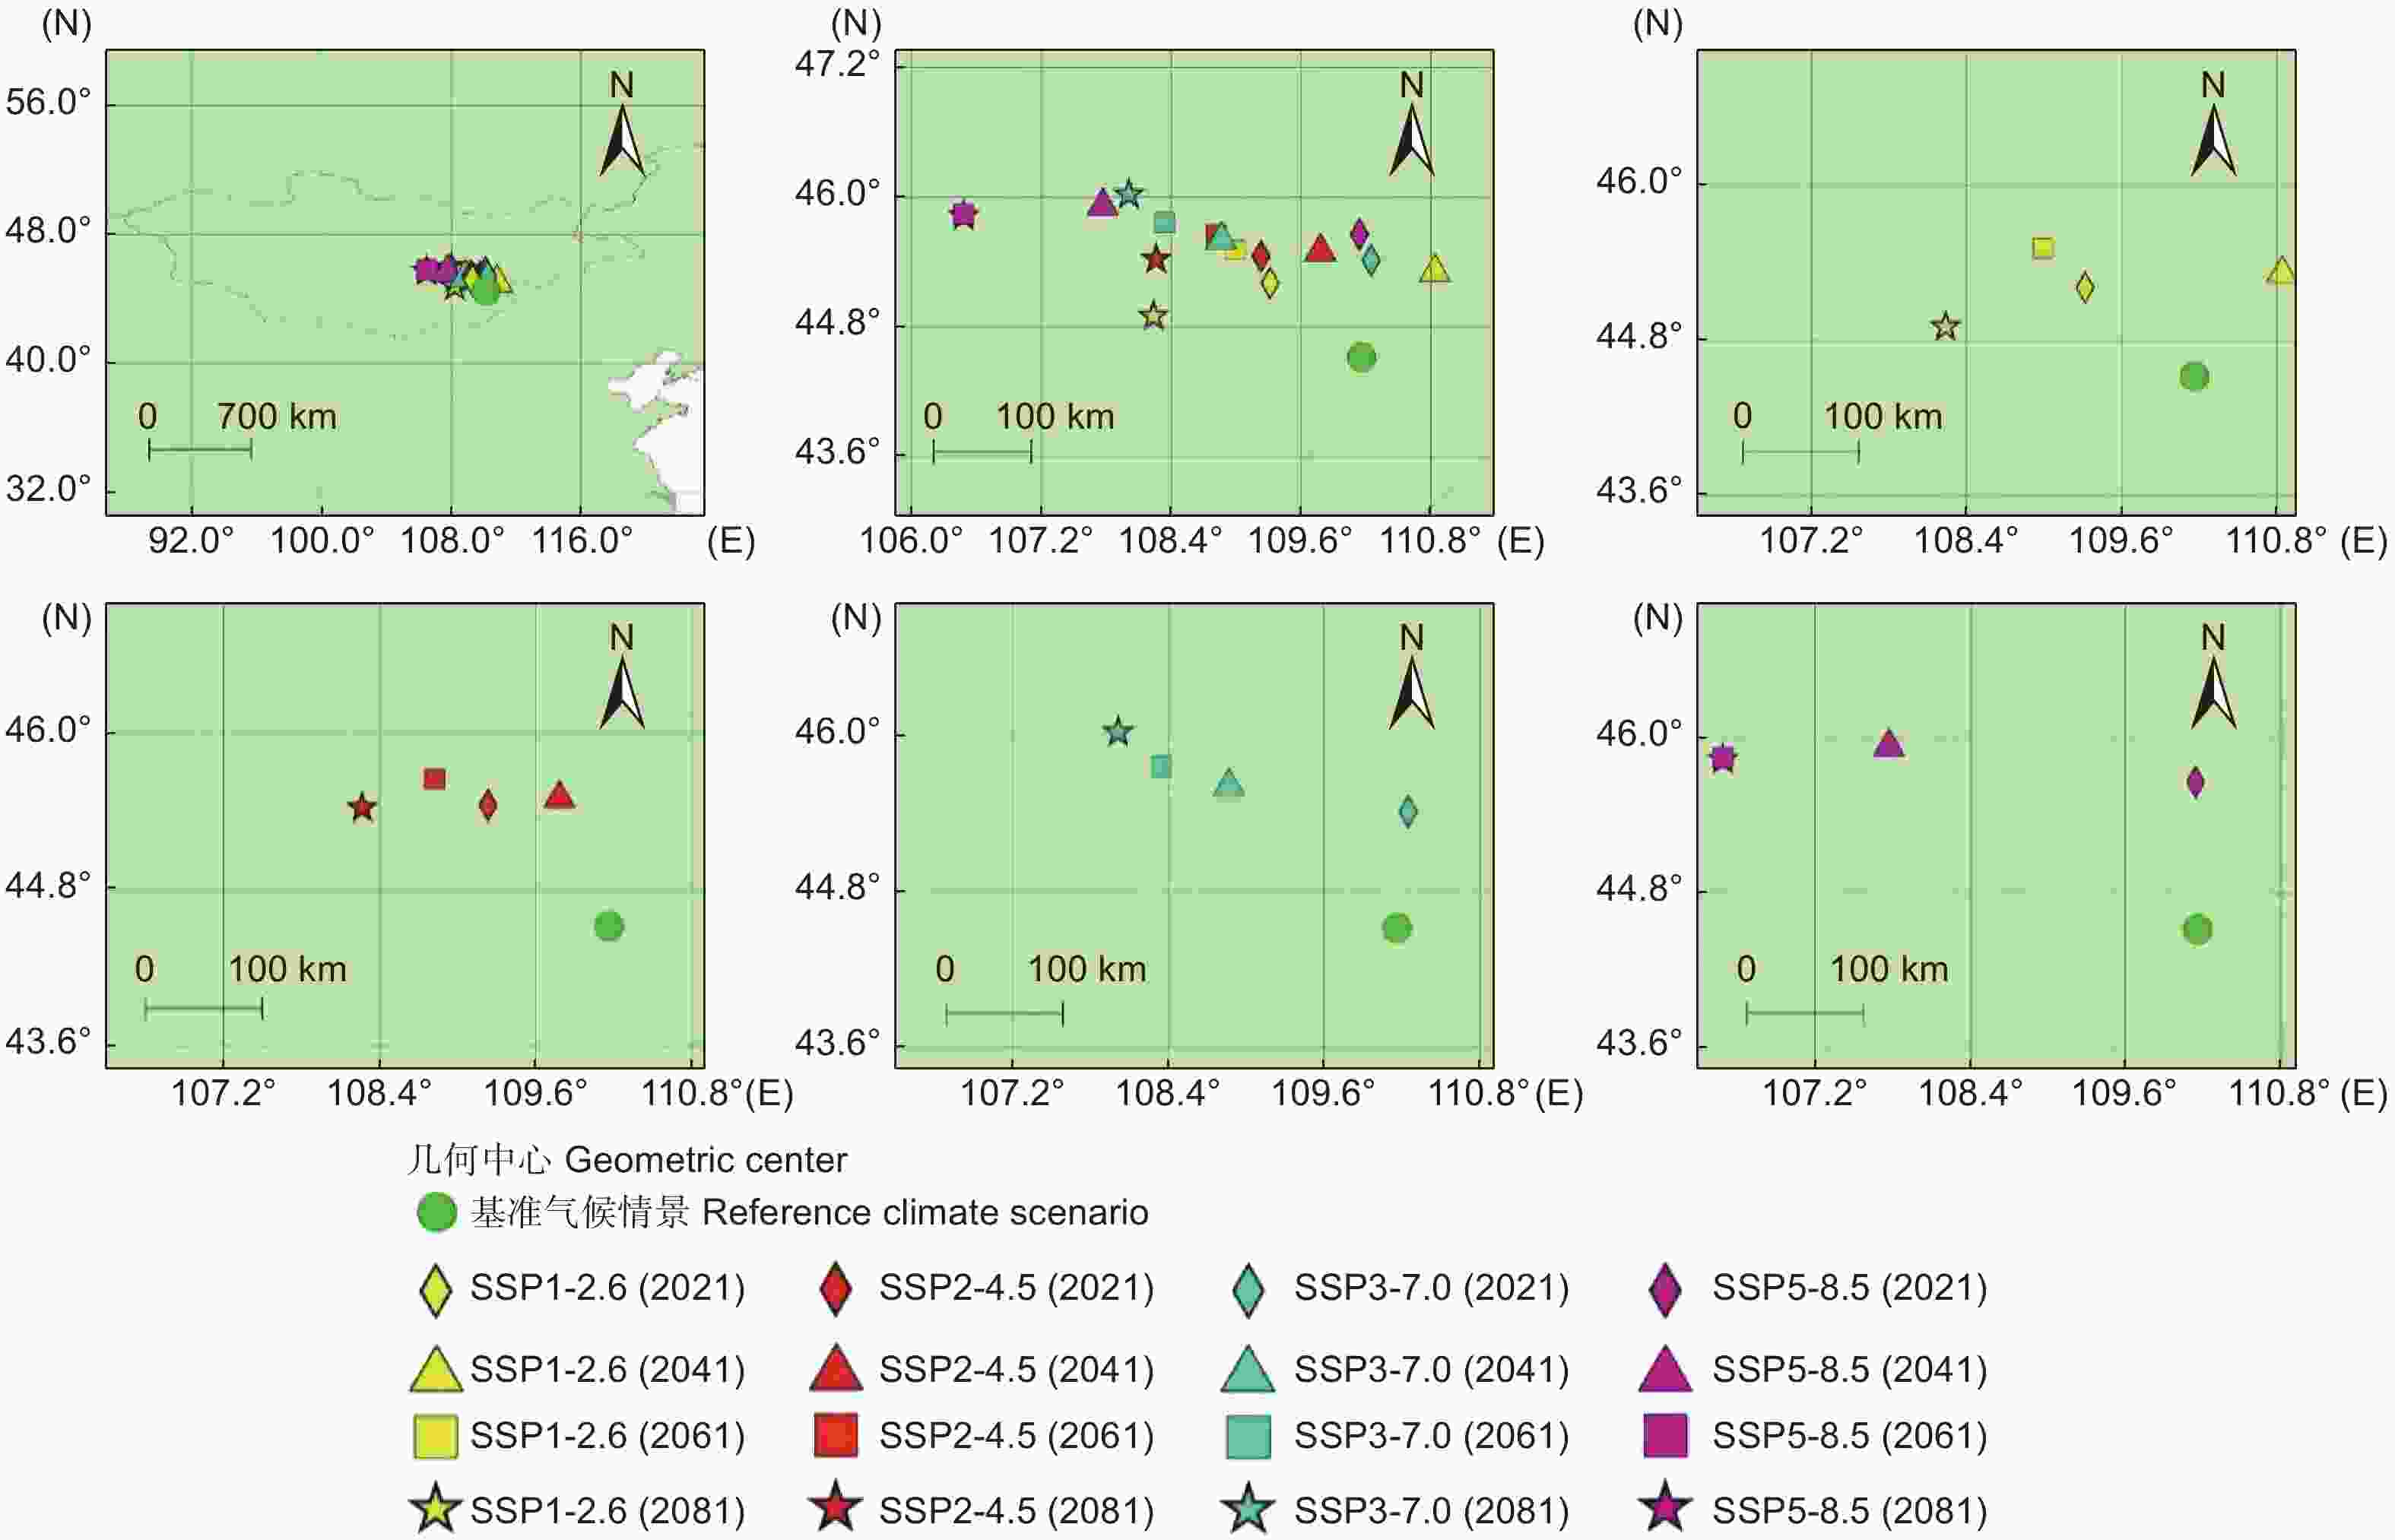
      Figure 4.  Geometric centers of the concentrated suitable distribution regions of Prunus pedunculata under different climate scenarios

      将几何中心的迁移进行量化,以基准气候情景下的几何中心为原点,距离原点最远的几何中心的迁移率表示为1,其余几何中心和原点间距离与最远几何中心和原点间距离之比就是这些几何中心的迁移率(表1)。几何中心迁移率最高的气候情景为2061和2081年的SSP5-8.5情景,迁移率为1。几何中心迁移率最低的气候情景为2021年的SSP3-7.0情景,迁移率为0.31。4种气候情景的平均迁移率分别为0.39(SSP1-2.6)、0.46(SSP2-4.5)、0.54(SSP3-7.0)和0.79(SSP5-8.5)。随着排放情景的升级,几何中心的平均迁移率也在增加,表明高排放情景下长柄扁桃集中适宜分布区的变化比低排放情景更活跃。

      情景
      Scenario
      年份
      Year
      迁移率
      Migration rate
      基准气候 Reference climate1970—20000
      SSP1-2.620210.32
      20410.33
      20610.44
      20810.48
      SSP2-4.520210.39
      20410.36
      20610.51
      20810.56
      SSP3-7.020210.31
      20410.49
      20610.61
      20810.74
      SSP5-8.520210.39
      20410.76
      20611
      20811
    • MaxEnT模型运用受试者工作曲线(ROC)对预测结果进行精确性验证。在该方法中,使用曲线下的面积,即AUC(area under curve)值(范围为0~1)来判断模型的预测精度。当AUC ≤ 0.7时,表明预测精度较差;当0.8 ≤ AUC < 0.9时,表明预测精度较好;当AUC > 0.9时,表明预测精度很好[11, 14]。本研究中,模型的AUC值为0.982,表明预测结果精度高,预测效果好。

    3.   讨论
    • 内蒙古和蒙古国的中东部是长柄扁桃集中适宜分布区。适宜分布区纬度跨度很大,从35.49°N至54.91° N,总体上长柄扁桃属于高纬度经济林树种。随着纬度的增加往往伴随着无霜期短、年均温度低、降水量少等低温、干旱的环境,导致大部分经济林树种无法发展[20-21]。而长柄扁桃在高纬度的分布,为高纬度地区提供了一个适宜的树种。

    • 降水季节性变化(bio15)是限制长柄扁桃分布的最关键变量。温度和降水是限制植物生长的2个关键因素。水对植物尤其重要,它不仅对植物的光合作用有重要影响,而且还决定着植物的生长状况,是限制植物分布的一个重要因素[22]。使用MaxEnt模型预测唇萼薄荷(Mentha pulegium L.)时,结果表明最冷季度的降水量(bio19)是限制其分布的最关键变量[23];对五叶木通(Akebia quinata (Thunb.) Decne.)的分布预测表明,限制其分布的最关键变量是年降水量(bio12)[15]。降水季节性变化(bio15)、最冷季度的降水量(bio19)和年降水量(bio12)都是与降水相关的变量,表明降水条件对长柄扁桃、薄荷和五叶木通等物种的分布限制优先级高于温度条件。而温度变量最冷季平均温度(bio11)是限制三叶木通(Akebia trifoliata (Thunb.) Koidz.)的最关键变量[16],限制竹叶花椒(Zanthoxylum armatum DC.)分布的关键环境因子的是1月份最高气温[24],对于三叶木通和竹叶花椒等物种来说,温度条件对分布的限制要高于降水条件。由此可知,尽管限制不同物种分布区的变量不同,但都或与温度,或与降水息息相关。

    • 不同物种针对气候变化做出的响应不同,尤其是随着CO2排放体量增加的情况下,不同的物种适宜面积既有增加也有减少。本研究中,长柄扁桃适宜面积总体呈增加趋势,具体情况是:2041年之前,长柄扁桃集中适宜分布区面积在未来4个情景中都为增加趋势;2041年之后,情景SSP1-2.6中的适宜面积开始减少,情景SSP2-4.5中适宜面积基本保持稳定,情景SSP3-7.0和SSP5-8.5中适宜面积持续增加,并且情景SSP3-7.0中的适宜面积在2061年之前就将超过情景SSP5-8.5,随后继续增加。同样,紫斑牡丹(Paeonia rockii (S. G. Haw & Lauener) T. Hong & J. J. Li)的适宜面积在排放情景RCP2.6和排放情景RCP8.5中都有所增加[22];而对松茸(Tricholoma matsutake (lto et lmai) Singer)的研究表明,在RCP8.5情景下,其适宜面积将大大减少,适宜分布区甚至会支离破碎[25]。由于气候变化,物种的适宜分布区也将发生变化[26-28]。物种分布区的扩张或收缩、物种迁移、甚至是分布区的破碎化是物种分布区几何中心变化的原因所在[15-16, 18]。未来气候情景中,长柄扁桃集中适宜分布区的几何中心有向西北移动的趋势,而五叶木通在东亚的适宜分布区的几何中心随着排放情景的升级而持续向东北移动[15],三叶木通适宜分布区的几何中心将向北移动[16]。随着CO2排放体量的增加,全球气候的变化不管是提升还是降低适宜分布区的面积,都会使物种适宜分布区的几何中心迁移,也就是原本适宜的地区不再适宜原生物种,这在很大程度上会威胁物种的生存。因此,控制碳排放,降低人类活动对气候的影响是非常必要的。

    4.   结论
    • 长柄扁桃适宜分布区主要集中在中国、蒙古和俄罗斯,范围为97.23°~122.62° E和35.49°~54.91° N。降水季节性变化(bio15)是限制长柄扁桃分布的最关键气候变量。在未来的4种气候情景下,长柄扁桃集中适宜分布区有向西北方迁移的趋势。随着排放情景的升级,几何中心的平均迁移率也在增加,高排放情景下集中适宜分布区的变化比低排放情景更活跃。本研究预测长柄扁桃分布区响应气候变化的规律,对其保护和开发利用具有重要意义。

Reference (28)

Catalog

    /

    DownLoad:  Full-Size Img  PowerPoint
    Return
    Return