


-
森林结构是决定森林能否充分发挥其功能的前提[1],通常采用空间与非空间参数来分析表征森林结构。经典森林经理一般把直径分布和树高分布作为林分结构的重要描述途径。实际上,林分直径和树高分布是对林木大小属性的统计表达。探讨林分胸径和树高的一元分布规律,可以掌握其林分的生长状况,也可以反映林分竞争、分化和自然稀疏现象,进而了解其生态进程,对实施合理的营林技术具有重要的指导意义。利用胸径和树高的二元分布描述树高和胸径之间的联合概率分布,揭示两个因子的内在结构关系,能够较全面认识林分结构、精确预估树木各径阶与蓄积量的变化[2]。Ni等[3]利用联合概率密度函数深入分析了长白山典型针阔混交林,得出胸径和树高二元分布关系。万盼等[4]通过双变量联合概率密度函数对不同密度沙地樟子松林进行分析,表明密度的差异导致了林木径向和纵向生长能量分配的不同。二元分布可为研究树木胸径、树高的实际关系和动态提供信息,在森林测量和调查中具有重要的作用。
近年来,兴安落叶松(Larix gmelini(Rupr.)Rupr.)树高胸径的研究主要集中在树高、胸径生长模型一元分布[5-7]以及林分结构特征[8-9]等方面,且人工落叶松研究颇多[10-11],但对于兴安落叶松天然林树高、胸径的二元分布研究相对较少,特别是分层研究结果鲜有报道。因此,本研究以兴安落叶松天然林为研究对象,选择具有代表性的林分,按整体和分层分析其胸径、树高的一元及二元分布,揭示林分胸径和树高的变化规律及两者之间的关联,以期为兴安落叶松天然林抚育经营等提供科学依据。
-
研究区选择在大兴安岭呼中林区,位于大兴安岭伊勒呼里山北坡(51°14′40″~52°25′ N,122°39′30″~124°21′ E),呼玛河中上游地区。该区属高纬度寒温带地区,气候特点是夏季短暂且雨热同季,冬季漫长而寒冷,永冻层与季节性冻层广泛分布,土壤沼泽化现象严重,主要树种为兴安落叶松(Larix gmelini(Rupr.)Rupr.)。由于气候寒冷,永冻层发育、土层瘠薄等因素使得阔叶树种生长受到限制,仅有部分白桦(Betula platyphylla Suk.)、山杨(Populus davidiana Dode.)、钻天柳(Chosenia arbutifolia (Pall.) A. Skv)等几种阔叶树种[12]。主要代表林型有:杜鹃落叶松林(Rhododendron-Larix forest),分布于海拔较高的山坡中上部;杜香落叶松林(Ledum-Larix forest),分布于阴坡、半阴坡下部缓平地段;草类落叶松林(grass-Larix forest),分布在阳坡或半阳坡。
-
在大兴安岭呼中林区设置3块50 m×50 m兴安落叶松林样地,利用全站仪(GTS602)测定每木坐标,并调查树种、胸径、树高、断面积及林下更新等内容,其基本特征如表 1:
表 1 落叶松天然林基本特征
Table 1. The basic characteristics of Larix gmelini forests
林分类型
Forest type平均胸径
Mean DBH/cm平均树高
Mean Height/m断面积
Basal area/(m2.hm-2)林分密度
Stand density/(tree·hm-2)林龄
Stand age/a杜香-落叶松林Ledum-Larix forest 11.6 9.9 11.6 992 70 草类-落叶松林grass-Larix forest 11.5 12.7 14.8 1 288 60 杜鹃-落叶松林Rhododendron-Larix forest 2.1 13.4 18.4 1 412 60 -
采用林分整体和分层相结合的方法分析林木大小分布特征。
-
林层数按树高分层,采用国际林联(IUFRO)的林分垂直分层标准,以林分优势高为依据把林分划分为3个垂直层,上层为树高≥2/3优势高的林木,中层为树高介于1/3~2/3优势高之间的林木,下层为树高≤1/3优势高的林木。若某层不足进行统计分析,则可合并。研究样地中第3层的林木株数太少(<30株),故将其归并为第二层,分别记为上层木(Ⅰ)和下层木(Ⅱ),其结果见表 2:
表 2 样地林层划分结果
Table 2. The results of layer classification in the plots
林分类型Forest type 第Ⅰ层LayerⅠ 第Ⅱ层LayerⅡ 株数Numbers 比例Proportion/% 株数Numbers 比例Proportion/% 杜香-落叶松林Ledum-Larix forest 188 75.8 60 24.2 草类-落叶松林grass-Larix forest 243 75.5 79 24.5 杜鹃-落叶松林Rhododendron-Larix forest 233 66.0 120 34.0 以胸径(径阶距为2 cm)或树高(树高阶距为1 m)为横坐标,以各径阶或树高级的每公顷株数为纵坐标,统计各样地林木直径分布或树高分布。应用R语言统计软件(moments)数据包对林分个体胸径和树高进行一元分布相关参数分析,包括:mean、skewness和kurtosis等。
-
应用计算机R语言对林木胸径和树高两个变量的二元分布分析:Mclust()函数进行双变量联合密度估计及相应参数的分析,plot()函数创建双变量的三维和等值线图。
-
图 1表示3块不同类型兴安落叶松天然林整体和分层的直径分布,通过R软件计算出林木直径分布的相关参数,如表 3和表 4。偏度表示分布曲线非对称的偏度方向程度;其中,偏度大于0,表示曲线左偏;偏度小于0,表示右偏。峰值表示了分布曲线顶峰的尖平程度;其中,峰值大于3(正态分布曲线峰值为3)表示分布曲线呈尖顶峰度(尖顶曲线);峰值小于3表示分布曲线呈平顶峰度(平顶曲线)。变异系数表示变量的离散程度。
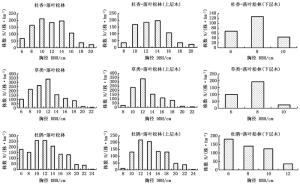
图 1 3块样地林分胸径分布
Figure 1. The distributions of the tree DBH in three plots
表 3 林木胸径分布相关参数
Table 3. The distributions parameters of tree DBH
林分类型Forest type 偏度Skewness 峰值Kurtosis 均值Mean 方差Var 变异系数Cv/% 标准差Sd 杜香-落叶松林Ledum-Larix forest 0.242 4 2.484 0 11.64 11.24 29 3.35 草类-落叶松林grass-Larix forest 0.417 0 2.836 0 11.53 11.65 30 3.41 杜鹃-落叶松林Rhododendron-Larix forest 0.379 5 2.506 7 12.14 17.26 34 4.15 表 4 不同层林木胸径分布相关参数
Table 4. The distributions parameters of tree DBH in different layers
林分类型Forest type 林层Layer 偏度Skewness 峰值Kurtosis 均值Mean 方差Var 变异系数Cv/% 标准差Sd 杜香-落叶松林
Ledum-Larix forestⅠ 0.413 6 2.774 3 12.92 7.49 21 2.74 Ⅱ 0.002 6 2.463 8 7.63 1.75 17 1.32 草类-落叶松林
grass-Larix forestⅠ 0.804 2 3.247 7 12.87 7.66 22 2.77 Ⅱ -0.272 7 2.280 6 7.41 1.33 16 1.15 杜鹃-落叶松林
Rhododendron-Larix forestⅠ 0.530 8 2.631 5 14.28 10.93 23 3.31 Ⅱ 0.267 6 2.079 7 7.99 3.39 23 1.84 整体来看,杜香-落叶松林和杜鹃-落叶松林的直径分布为双峰分布,而草类-落叶松林的直径分布却是单峰分布(图 1左)。由表 3可知,3块样地的平均胸径基本相同,林分整体直径分布均向左偏,说明小径级林木较多;3块样地峰值均小于3,为平顶峰度(平顶曲线),杜香-落叶松林直径分布曲线最平缓,草类-落叶松林直径分布曲线最尖削;杜鹃-落叶松林的直径离散程度最大,草类-落叶松林与杜香-落叶松林直径分布离散程度最小且基本相同。
由表 4可知,3块样地林分上层林木直径分布均向左偏,说明小径级林木较多。草类-落叶松林上层林木峰值大于3,分布曲线为顶尖峰度(顶尖曲线),其他2个为平顶峰度(平顶曲线),直径分布离散程度基本相同。3块样地下层林木平均胸径基本相同,杜香-落叶松林下层林木直径分布为近似正态分布,草类-落叶松林下层木右偏,说明大径阶林木较多,杜鹃-落叶松林下层林木左偏,说明小径级林木较多。3块样地均峰值均小于3,为平顶峰度(平顶曲线)。杜鹃-落叶松林下层林木的直径分布离散程度最大,其他2个样地直径分布离散程度较小。
-
图 2表示3块兴安落叶松天然林整体和分层的树高分布,再通过R软件计算出林木树高分布的相关参数,如表 5和表 6。
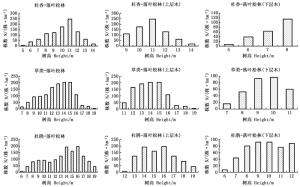
图 2 3块样地林分树高分布
Figure 2. The distributions of the tree height in three plots
表 5 林木树高分布相关参数
Table 5. The distributions parameters of tree height
林分类型Forest type 偏度Skewness 峰值Kurtosis 均值Mean 方差Var 变异系数Cv/% 标准差Sd 杜香-落叶松林Ledum-Larix forest -0.427 8 2.591 7 9.95 3.60 19 1.90 草类-落叶松林grass-Larix forest -0.312 2 2.551 9 12.73 5.88 19 2.43 杜鹃-落叶松林Rhododendron-Larix forest -0.373 8 2.221 4 13.42 10.31 24 3.21 表 6 不同层林木树高分布相关参数
Table 6. The distributions parameters of tree Height in different layers
林分类型Forest type 林层Layer 偏度Skewness 峰值Kurtosis 均值Mean 方差Var 变异系数Cv/% 标准差Sd 杜香-落叶松林
Ledum-Larix forestⅠ 0.270 6 2.515 1 10.81 1.42 11 1.19 Ⅱ -0.606 0 2.270 1 7.26 0.86 13 0.93 草类-落叶松林
grass-Larix forestⅠ 0.417 5 2.882 7 13.84 2.44 11 1.56 Ⅱ -0.369 7 2.258 9 9.34 1.22 12 1.10 杜鹃-落叶松林
Rhododendron-Larix forestⅠ 0.363 5 2.336 8 15.38 2.88 11 1.70 Ⅱ -0.074 8 1.933 6 9.62 2.80 17 1.67 整体来看,杜鹃-落叶松林的树高分布为多峰分布,而其他2个样地树高分布为单峰分布。3块样地林木树高均右偏,说明高大林木较多,且杜香-落叶松林偏斜程度最大,草类-落叶松林与杜鹃-落叶松林偏斜程度较小且基本相同。3块样地峰值均小于3,为平顶峰度(平顶曲线);杜鹃-落叶松林树高分布曲线最平缓且离散程度较大,杜香-落叶松林与草类-落叶松林树高分布曲线较相似,均较尖稍,离散程度均较小。
3块样地上层林木树高分布均左偏,说明矮小林木较多,且草类-落叶松林偏斜程度最大,杜香-落叶松林最小;3块样地峰值均小于3,为平顶峰度(平顶曲线);3块样地树高分布离散程度相同。3块样地下层木树高分布曲线右偏,即高大树木占多数,且杜香-落叶松林偏斜程度最大,杜鹃-落叶松林最小,近似正态分布(偏度接近0);3块样地峰值均小于3,为平顶峰度(平顶曲线);杜鹃-落叶松林树高分布曲线最平缓,变异系数最大,说明其下层木林木树高分化程度大(离散程度大)、分布范围广。
-
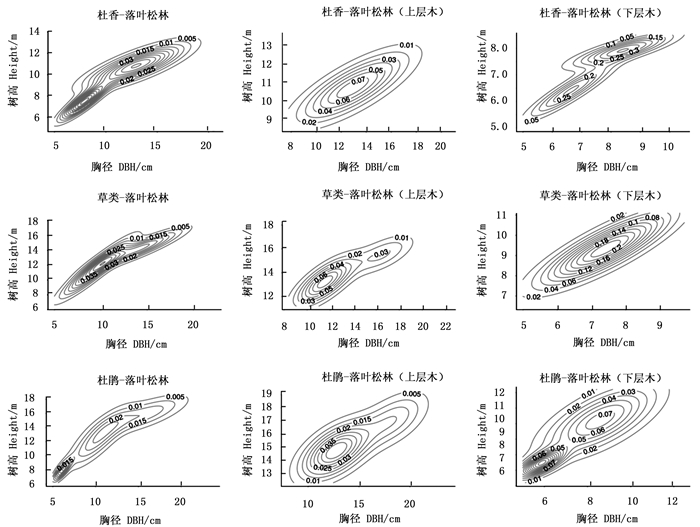
由图 3(左)可知,3块样地的胸径-树高联合分布均为多个聚集分布。可以看出,杜香-落叶松林大径级林木占绝大多数,而草类-落叶松林和杜鹃-落叶松林的小径级林木所占比例稍大。另外,由图 4(左)等值线图可知,3块样地中随着胸径的增大树高也在相应的增大,3块样地林分中树高与胸径的比值(斜率)小径级林木均大于大径级林木。
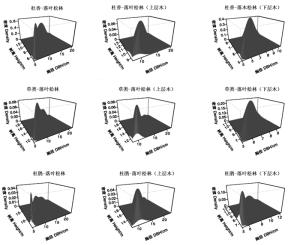
图 3 胸径-树高双变量联合分布三维图
Figure 3. Graphic representation of two bivariate mixtures involving DBH and height

图 4 胸径-树高双变量联合分布等值线图
Figure 4. Contour map of two bivariate mixtures involving DBH and height
分层分析表明(图 3,中),草类-落叶松林及杜鹃-落叶松林上层木胸径-树高联合分布均呈两个聚集分布,而杜香-落叶松林上层木的胸径-树高联合分布图为一个聚集分布。草类-落叶松林和杜鹃-落叶松林上层木小径级林木所占比例明显大于大径级林木。由图 4(中)可知,3块样地中随胸径增大树高在增大,但大小径级之间的林木树高与胸径的比值(斜率)没有明显差异。
同样分层分析表明(图 3,右),杜香-落叶松林及杜鹃-落叶松林下层木胸径和树高联合分布呈现两个聚集分布,草类-落叶松林下层木的胸径和树高联合分布图为一个聚集分布。杜香-落叶松林下层木大径阶林木所占比例稍大,杜鹃-落叶松林下层木大径级林木所占比例明显大于小径级林木。由图 4(右)可知,3块样地下层林木中,树高随胸径增大也增大,但大小径级之间的林木树高与胸径的比值(斜率)没有明显差异。
-
3块落叶松林除了林分密度有差异,其海拔和所处的环境条件也存在差异;其中,杜鹃-落叶松林海拔、密度均较其他两个落叶松林高;草类-落叶松林处于阳坡且生长条件相对较好。研究表明,林木生长过程中为获取有限资源而出现非对称竞争,进而引起林分直径分布出现多峰[13]。杜香-落叶松林、杜鹃-落叶松林由于生长条件均较草类-落叶松林差且资源匮乏,其林分生长出现了非对称竞争,导致林分直径分布出现多峰;而对于树高,也可能是由于杜鹃-落叶松林所处较高海拔,生长环境较差,树高生长也出现了相应的非对称竞争,从而出现多峰分布的现象。比较可知,3块样地落叶松林的平均胸径基本相等且均是小径级林木占多数,可能是由于该林分均属于种群发育初期形成的森林,属于年幼阶段的天然林;树高分析发现,杜鹃-落叶松林平均树高最高,而杜香-落叶松林最小,这与密度制约效应有关[14],即杜鹃-落叶松林林分密度较高,导致林分中的光环境弱,林木只能将更多的能量用于树高生长,以便得到更好的光环境,用来维持供自身正常生长发育。而高密度的杜鹃-落叶松林林分中高大林木比例却较低,这可能是由于林分密度高,导致林木争夺生长空间和土壤养分较为激烈,林木生长缓慢,使得林分中高大林木比例少[15]。
分层发现,3块样地上、下层林木的直径分布均为单峰分布;杜鹃-落叶松林的树高上、下层分布为双峰,其他两个样地上、下层树高分布均为单峰分布。可以看出,林分整体的分布特征与分层后的分布特征存在差异,分层更能够深入分析林木大小分布特征。3块样地上层木的小径级且矮小林木均占多数,其中,草类-落叶松林上层林木中小径级且矮小林木比例最高,杜香-落叶松林则最低。这是由于草类-落叶松林所处环境条件较好,更新条件好,使得上层木中小径级比例占多数;另外,草类-落叶松林密度较大,对生长环境的竞争大,致使上层高大林木比例较少;相反,杜香-落叶松密度小,对生长环境的竞争较其他林分小,使得林分上层木的高大林木比例多。
3块样地下层木的平均胸径基本相等;草类-落叶松下层木大径级林木比例较高,而杜鹃-落叶松下层木小径级林木比例低。这可能也是由于杜鹃-落叶松林分密度大且生长环境较差,导致林分内发生竞争作用时间早且竞争程度激烈,有限的光照、水分及土壤养分等生长资源不能满足高密度林木生长需求,导致其下层木大径级林木相对较少。对于下层木树高来说,3块样地落叶松林下层木中高大林木均占多数,且杜鹃-落叶松下层木中高大林木比例最高,而杜香-落叶松下层木高大林木比例最低。下层木受上层木的覆盖和挤压的影响,导致下层木接受的光比较少,落叶松林属于喜光树种,生长量优先分配于树高生长,这也是对林内光环境竞争一种响应;高密度的杜鹃-落叶松林木间相互挤压剧烈,尤其是下层木的冠幅生长受到严重抑制作用,更多的养分供给主体,主要用于树高生长,说明高密度对树高有促进作用[16];密度小的杜香-落叶松林分,其空间充足,林木侧枝生长茂盛,形成较大树冠伸展好,导致更多的能量用于树冠生长。
-
一元分布揭示的是单个变量的变化规律,采用联合密度函数能够对胸径和树高两个变量进行分析,能够更深入了解胸径和树高的变化规律[17-18]。本研究采用双变量联合密度函数对胸径和树高进行分析,整体来看,杜香-落叶松林大径阶林木株数比例明显大于小径阶林木株数比率,而草类-落叶松林和杜鹃-落叶松林小径阶林木株数比例明显大于大径阶林木株数比率。同样原因,由于杜香-落叶松林林分密度小,林木竞争小,营养空间大,优势林木较多;而草类-落叶松林和杜鹃-落叶松林密度大,其林分中林木竞争激烈,营养空间小,使得小径级林木占多数。3块样地落叶松林林分中树高与胸径的比值小径阶林木中明显大于大径级林木,这说明落叶松林在生长过程中对径向和纵向生长能量分配不同,这与其他[4, 19]研究结论相似,由于在生长初期阶段,林木主要以高生长为主,使其尽量达到上层林接收更好的生长环境。
分层来看,草类-落叶松林和杜鹃-落叶松林上层木胸径-树高联合分布均呈两个不同聚集峰,表现出较为复杂的林木大小分布特性,且林分中小径阶林木株数比例较大,也是由于密度差异引起的;而杜香-落叶松林上层木的胸径-树高联合分布却呈现一个聚集峰,说明该林分上层木林木大小分布特征单一。3块样地上层木在大小径林木间树高与胸径的比值均无明显差异,这说明已处于上层的林木,多数为高大林木,在不同径级林木中,能量用于树高和直径的分配比例保持不变。而对于下层木,杜香-落叶松林和杜鹃-落叶松林下层木胸径和树高联合分布呈现两个聚集峰,且林分中大径阶林木株数比例均大于小径阶林木株数比率,这是由于两块样地的生长环境较差且密度相对较大,下层木更新的幼小林木相对比较少,处在下层木的大径阶林木比例就相对高;而3块样地下层木在大小径林木间树高与胸径的比值也均无明显差异。这说明处在下层木的落叶松林木,为获取更多的光照以便存活,一直处在以高生长为主的生长阶段。
-
不同密度和不同类型的落叶松林直径和树高的分布特征不同,通过整体和分层分析对比发现,分层更能够深入分析林木大小分布特征。1)无论整体还是分层,高密度的杜鹃-落叶松林平均树高要高于密度低的杜香-落叶松林和草类-落叶松林平均树高,而平均直径在不同密度和不同类型的落叶松林中无明显差异。说明兴安落叶松林分密度对林木胸径生长影响不大,而对树高生长有一定影响,林分密度是制约林木群体生长发育的一项关键因素。2)密度小的杜香-落叶松林中大径阶林木株数比例明显大于小径阶林木株数比率,而密度大的草类-落叶松林和杜鹃-落叶松林小径阶林木株数比例明显大于大径阶林木株数比率。主要是由于林分密度小,林木竞争小,营养空间大,导致分化程度大。而密度稍大,其林分中林木竞争激烈,营养空间小,导致分化程度小。3)3块样地落叶松林林分中树高与胸径的比值小径阶林木中明显大于大径级林木,而这种差异在上下层林分中均表现不明显,说明落叶松林在生长过程中对径向和纵向生长能量分配不同,处于生长初期阶段,林木主要以高生长主。
兴安落叶松天然林林木直径与树高分布的分层特征
The Layered Characteristics of DBH and Height Distribution of Larix gmelini Nature Forest
-
摘要:
目的 通过分析大兴安岭呼中林区兴安落叶松天然林胸径和树高的一元、二元分布特征,揭示脆弱地带森林群落的林木大小分布特征。 方法 在大兴安岭呼中林场设置3种不同类型兴安落叶松林固定样地,利用整体和分层的方法,对样地林分胸径和树高的变化规律以及两者之间的关系进行研究。 结果 表明:(1)草类-落叶松林直径分布为单峰分布,其他2块样地为双峰分布;3块样地林木直径分布均呈左偏。杜鹃-落叶松林树高分布为多峰分布,其他2块地均为单峰分布;3块样地林木树高分布均呈右偏。(2)3块样地上、下层林木的直径分布均为单峰分布,上层木直径分布均呈左偏,下层木直径分布草类-落叶松林右偏,杜鹃-落叶松林左偏,杜香-落叶松林为近似正态。杜鹃-落叶松林的树高上、下层分布为双峰,其他2块样地均为单峰,3块样地上层木树高分布均左偏,而下层木树高分布均右偏。(3)草类-落叶松林和杜鹃-落叶松林小径阶林木株数占绝大多数。3块样地林分中树高与胸径的比值在小径阶林木中明显大于大径级林木。草类-落叶松林和杜鹃-落叶松林上层木中小径阶林木株数所占比例稍大,杜香-落叶松林和杜鹃-落叶松林下层木中大径阶林木株数比例稍大,但3块样地上层和下层木树高与胸径的比值在大小径阶林木中均无明显差异。 结论 高密度的杜鹃-落叶松林平均树高要高于低密度的杜香-落叶松林和草类-落叶松林平均树高,而平均胸径无明显差异。3块样地林分中树高与胸径的比值小径阶林木中明显大于大径级林木,但其差异在上层和下层林分中均表现不明显。 Abstract:Objective To analyze the univariate and bivariate distribution characteristics of DBH and tree height of Larix gmelini natural forest in Huzhong forest zone of Greater Khingan Mountains Region, and to reveal the size distribution of forest fragile zones of forest communities. Method Three sample plots of L. gmelini forest with different species composition (herbage-Larix, Rhododendron-Larix, and Ledum-Larix) were set up in Huzhong Forest Farm, the relationship between the DBH and the tree height was studied by the whole and layered method. Result (1) The DBH distribution of herbage-Larix forest followed a single peak distribution and the other two plots followed a bimodal distribution. The DBH distribution of the three plots was left-biased. The tree height distribution of Rhododendron-Larix forest was multimodal, and the other two plots were unimodal. (2) The DBH distribution of the upper and lower layers of the three plots were all unimodal. The DBH distribution of the upper layer on all the three plots was left-biased, the lower layer of the herbage-Larix forest was right-biased, the Rhododendron-Larix forest was left-biased, and the Ledum-Larix forest was approximately normal. The height distribution of Rhododendron-Larix forest in the upper and lower layers was bimodal, and the other two plots followed single distribution. The height distribution of the upper layers of these plots was the left-biased, while the height distribution of the lower layers of the three plots was right-biased. (3) The percentage of small diameter trees in herbage-Larix forest and Rhododendron-Larix forest was significantly higher than that in the large diameter forest. The ratio of tree height to DBH in small diameter forests was significantly higher than that in large diameter forest. The ratio of small diameter trees in the upper layer of herbage-Larix forest and Rhododendron-Larix forest was larger than that of the large diameter forest, the ratio of large DBH trees in the lower layer of Ledum-Larix forest and Rhododendron-Larix forest was higher than that of small diameter forest. However, no significant difference was found in the ratio of height and DBH between the upper and lower layers of the three plots. Conclusion The average height of the high-density Rhododendron-Larix forest is higher than that of the low-density Ledum-Larix forest and herbage-Larix forest, and the average DBH has no significant difference in different density and different typed forests. The ratio of tree height to DBH in small diameter forest is significantly higher than that in large DBH forest, but the difference is not obvious in upper and lower standings. -
图 3 胸径-树高双变量联合分布三维图
Figure 3. Graphic representation of two bivariate mixtures involving DBH and height
图 4 胸径-树高双变量联合分布等值线图
Figure 4. Contour map of two bivariate mixtures involving DBH and height
表 1 落叶松天然林基本特征
Table 1. The basic characteristics of Larix gmelini forests
林分类型
Forest type平均胸径
Mean DBH/cm平均树高
Mean Height/m断面积
Basal area/(m2.hm-2)林分密度
Stand density/(tree·hm-2)林龄
Stand age/a杜香-落叶松林Ledum-Larix forest 11.6 9.9 11.6 992 70 草类-落叶松林grass-Larix forest 11.5 12.7 14.8 1 288 60 杜鹃-落叶松林Rhododendron-Larix forest 2.1 13.4 18.4 1 412 60  下载: 导出CSV
表 2 样地林层划分结果
Table 2. The results of layer classification in the plots
林分类型Forest type 第Ⅰ层LayerⅠ 第Ⅱ层LayerⅡ 株数Numbers 比例Proportion/% 株数Numbers 比例Proportion/% 杜香-落叶松林Ledum-Larix forest 188 75.8 60 24.2 草类-落叶松林grass-Larix forest 243 75.5 79 24.5 杜鹃-落叶松林Rhododendron-Larix forest 233 66.0 120 34.0
下载: 导出CSV
表 3 林木胸径分布相关参数
Table 3. The distributions parameters of tree DBH
林分类型Forest type 偏度Skewness 峰值Kurtosis 均值Mean 方差Var 变异系数Cv/% 标准差Sd 杜香-落叶松林Ledum-Larix forest 0.242 4 2.484 0 11.64 11.24 29 3.35 草类-落叶松林grass-Larix forest 0.417 0 2.836 0 11.53 11.65 30 3.41 杜鹃-落叶松林Rhododendron-Larix forest 0.379 5 2.506 7 12.14 17.26 34 4.15
下载: 导出CSV
表 4 不同层林木胸径分布相关参数
Table 4. The distributions parameters of tree DBH in different layers
林分类型Forest type 林层Layer 偏度Skewness 峰值Kurtosis 均值Mean 方差Var 变异系数Cv/% 标准差Sd 杜香-落叶松林
Ledum-Larix forestⅠ 0.413 6 2.774 3 12.92 7.49 21 2.74 Ⅱ 0.002 6 2.463 8 7.63 1.75 17 1.32 草类-落叶松林
grass-Larix forestⅠ 0.804 2 3.247 7 12.87 7.66 22 2.77 Ⅱ -0.272 7 2.280 6 7.41 1.33 16 1.15 杜鹃-落叶松林
Rhododendron-Larix forestⅠ 0.530 8 2.631 5 14.28 10.93 23 3.31 Ⅱ 0.267 6 2.079 7 7.99 3.39 23 1.84
下载: 导出CSV
表 5 林木树高分布相关参数
Table 5. The distributions parameters of tree height
林分类型Forest type 偏度Skewness 峰值Kurtosis 均值Mean 方差Var 变异系数Cv/% 标准差Sd 杜香-落叶松林Ledum-Larix forest -0.427 8 2.591 7 9.95 3.60 19 1.90 草类-落叶松林grass-Larix forest -0.312 2 2.551 9 12.73 5.88 19 2.43 杜鹃-落叶松林Rhododendron-Larix forest -0.373 8 2.221 4 13.42 10.31 24 3.21
下载: 导出CSV
表 6 不同层林木树高分布相关参数
Table 6. The distributions parameters of tree Height in different layers
林分类型Forest type 林层Layer 偏度Skewness 峰值Kurtosis 均值Mean 方差Var 变异系数Cv/% 标准差Sd 杜香-落叶松林
Ledum-Larix forestⅠ 0.270 6 2.515 1 10.81 1.42 11 1.19 Ⅱ -0.606 0 2.270 1 7.26 0.86 13 0.93 草类-落叶松林
grass-Larix forestⅠ 0.417 5 2.882 7 13.84 2.44 11 1.56 Ⅱ -0.369 7 2.258 9 9.34 1.22 12 1.10 杜鹃-落叶松林
Rhododendron-Larix forestⅠ 0.363 5 2.336 8 15.38 2.88 11 1.70 Ⅱ -0.074 8 1.933 6 9.62 2.80 17 1.67
下载: 导出CSV
-
[1] 惠刚盈, 胡艳波, 徐海.结构化森林经营[M].北京:中国林业出版社, 2007. [2] 惠刚盈.结构化森林经营技术指南[M].北京:中国林业出版社, 2010. [3] NI R, Baiketuerhan Y, ZHANG C, et al. Analyzing structural diversity in two temperate forests in northeastern China[J]. Forest Ecology and Management, 2014, 316(2):139-147. [4] 万盼, 刘灵, 赵中华, 等.沙地樟子松天然林林木大小分布特征[J].北京林业大学学报, 2017, 39(7):1-9. [5] 洪清林, 柴一新, 王义弘, 等.大兴安岭塔河兴安落叶松天然林生长的研究[J].东北林业大学学报, 1994, 22(2):92-97. [6] 马利强, 玉宝, 王立明, 等.兴安落叶松天然林单木高生长模型[J].南京林业大学学报:自然科学版, 2013, 37(2):169-172. [7] 姜立春, 杜书立.基于非线性混合模型的东北兴安落叶松树高和直径生长模拟[J].林业科学研究, 2012, 25(1):11-16. doi: 10.3969/j.issn.1001-1498.2012.01.003 [8] 玉宝, 乌吉斯古楞, 王百田, 等.兴安落叶松天然林不同林分结构林木水平分布格局特征研究[J].林业科学研究, 2010, 23(1):83-88. [9] 董灵波, 刘兆刚, 李凤日, 等.大兴安岭主要森林类型林分空间结构及最优树种组成[J].林业科学研究, 2014, 27(6):734-740. [10] 张俊, 孙玉军, 许俊利.东北地区兴安落叶松人工林生长过程研究[J].西北林学院学报, 2008, 23(6):179-181. [11] 赵丹丹, 李凤日, 董利虎.落叶松人工林直径分布动态预估模型[J].东北林业大学学报, 2015, 43(5):42-48. doi: 10.3969/j.issn.1000-5382.2015.05.009 [12] 胡远满, 徐崇刚, 常禹, 等.空间直观景观模型LANDIS在大兴安岭呼中林区的应用[J].生态学报, 2004, 24(9):1846-1856. doi: 10.3321/j.issn:1000-0933.2004.09.004 [13] Velázquez J, Allen R B, Coomes D A, et al. Asymmetric competition causes multimodal size distributions in spatially structured populations[J]. Proceedings Biological Sciences, 2016, 283(1823):1-9. [14] 惠光秀, 吴海萍, 张庆费, 等.上海浦东公路绿带意杨和香樟群落密度定量化控制[J].东北林业大学学报, 2010, 38(3):20-22. doi: 10.3969/j.issn.1000-5382.2010.03.007 [15] 田新辉, 孙荣喜, 李军, 等.107杨人工林密度对林木生长的影响[J].林业科学, 2011, 47(3):184-188. [16] 刘灵, 胡艳波, 王千雪, 等.沙地樟子松天然纯林的结构特征[J].林业科学研究, 2016, 29(5):623-629. doi: 10.3969/j.issn.1001-1498.2016.05.001 [17] Wang M, Rennolis K, Tang S. Bivariate distribution modeling of tree diameters and heights:Dependency modeling using copulas[J]. Forest Science, 2008, 54(3):284-293. [18] 金星姬, 李凤日, 贾炜玮, 等.树木胸径和树高二元分布的建模与预测[J].林业科学, 2013, 49(6):74-82. [19] Zucchini W, Schmidt M, Gadow K V. A model for the diameter-height distribution in an uneven-aged beech forest and a method to access the fit of such models[J].Silva Fennica, 2011, 35(2):169-183. -

 点击查看大图

计量
- 文章访问数: 4842
- HTML全文浏览量: 1789
- PDF下载量: 440
- 被引次数: 0
