

-
白栎(Quercus fabri Hance)为壳斗科(Fagaceae)栎属(Quercus L.)的一种落叶乔木[1],广泛分布于我国亚热带的15个省份,是我国亚热带森林的主要天然次生树种和优势树种。白栎木材纹理致密美观,耐磨耐腐,常被用作建材、家居的高级用料,且其木材结构细腻耐烧、燃烧释放热值高、烟量少,是传统薪炭材[2]。白栎嫩叶可饲养柞蚕,老叶可作饲料[3]。白栎果实又称橡实,是一种传统的野生木本粮食资源,可用来开发食品、饲料和医药等[4-5]。因其具有多重用途,长期以来过度砍伐利用和粗放经营,导致白栎林分破坏较重,现存的白栎林高大乔木较少,主要为砍伐后其基部萌生枝条,再经封山育林而成的次生林。白栎分布广泛,可形成大量不同的遗传类型。研究遗传多样性是资源保护与评价的重要手段,在制定育种策略和物种保存等方面有着重要意义。
利用表型性状的差异来检测种源的遗传多样性是长期以来最简便易行的方法。林木的果实性状是较稳定的遗传特征,不同种源果实在表型性状上存在的差异是植物对环境的一种适应,研究果实性状可在一定程度上揭示种源的遗传规律和变异程度[6]。目前,有关白栎的研究仅分析了个别地区白栎居群的分布格局和个别种源白栎的生物量及果实中的矿质元素和营养成分的含量[7-8],白栎资源现状未得到全面调查和了解,其遗传多样性和遗传结构尚未展开系统研究。本文以14个白栎种源368个单株的果实为研究对象,初步揭示果实形态与营养成分含量在种源间、种源内的变异及其与地理气候因子的关系,为白栎良种选育及种质资源的开发利用提供参考。
-
2018年10—12月,在白栎自然分布区10个省的14个地点采集成熟果实用于试验。采种母树树龄大于30 a,无病虫害,生长正常且处于盛果期,每个单株按东、西、南、北4个方向均匀采集树冠中上的果实,尽量减少由不同生境造成的统计差异。采种母树间距在50 m以上,每个种源地采集母树数量20~30株不等,单株采果不少于200 g[9]。果实剥去壳斗后,分种源等质量均匀混合,摊开自然晾干,后于(105±5)℃下烘干至恒质量,清理干净后粉碎,密封置于4℃冰箱贮藏备用。采用GPS测量种源的经纬度,气象数据来自中国气象数据网(1981—2010年)(表1)。
表 1 14个白栎种源的地理位置及主要气象因子
Table 1. Geographic location and habitat of 14 provenances of Q. fabri
种源
Provenance编号
Code株数
Number年均相对湿度
Meanannual
humidit/%年均温度
Meanannual
temperature/℃年均日照时数
Mean annual
sunshine
duration /h年降水量
Meanannual
rainfall/mm1月均温
Mean temperature
of January/℃7月均温
Mean temperature
of July/℃纬度N/(°) 经度E/(°) 海拔高度
Altitude/m四川阆中 SCLZ 26 78 16.9 1 379 1 027 6.1 26.7 31.42 106.17 440 重庆万州 CQWZ 27 81 18.2 1 484 1 185 7.3 28.4 30.38 108.37 330 四川邻水 SCLS 25 84 16.1 1 286 1 200 6.3 27.1 30.33 107.07 430 湖北利川 HBLC 22 81 12.9 1 300 1 301 2.2 23.0 30.31 109.49 834 浙江西湖 ZJXH 30 76 17.0 1 765 1 438 4.6 28.9 30.28 120.06 156 湖南龙山 HNLS 24 80 16.1 1 161 1 308 4.8 26.4 29.34 109.42 542 重庆江津 CQJJ 29 81 18.3 1 141 1 000 8.0 28.0 28.65 106.40 924 浙江遂昌 ZJSC 30 78 17.1 1 755 1 579 5.8 27.7 28.64 119.18 748 浙江武义 ZJWY 30 79 17.3 1 891 1 520 5.2 28.9 28.46 119.39 160 湖南新晃 HNXH 23 80 16.6 1 321 1 155 5.1 27.0 27.65 110.32 520 江西宜黄 JXYH 25 81 17.7 1 765 1 832 5.5 29.0 27.39 116.25 418 福建武夷山 FJWYS 30 77 18.3 1 629 1 926 7.8 27.8 27.38 119.58 226 贵州黄平 GZHP 26 81 14.9 1 104 1 090 3.7 24.8 27.12 107.79 820 广西全州 GXQZ 21 78 18.1 1 443 1 566 6.5 28.5 26.01 109.96 350 注:浙江西湖采种地为杭州西山国家森林公园。
Note: Zhejiang West Lake provenance comes from Xishan National Forest Park of Hangzhou. -
选用果实长度、果实宽度、长宽比及百粒质量作为形态特征指标。每个种源随机选出100粒无虫蛀的健康果实,采用电子游标卡尺测量果实长度和果实宽度,重复3次,测量单位精确到0.01 mm,并计算果实长宽比。再用电子天平称量100粒无虫蛀的健康果实质量,重复5次,取平均值并精确到0.01 g。
-
蛋白质含量采用考马斯亮蓝法测定[10],脂肪含量采用索氏提取法测定[11],总黄酮含量和单宁含量采用分光光度比色法测定[12],可溶性糖和淀粉含量测定采用蒽酮比色法测定[13],每个指标测定均设置3次重复。
-
对原始数据进行正态性检验,发现数据服从正态分布。采用巢式方差分析[14]研究白栎果实性状变异,线性模型为:χijk = μ+ αi + δj(i) + εijk,其中,χijk为第i个种源的第j个个体的第k个观测值,μ为总平均值,αi为第i个种源的效应值,δj(i)为第i个种源内的第j个个体的效应值,εijk为随机误差,并利用Duncan方法进行多重比较[15]。
-
在R语言统计软件中计算各性状的变异系数(CV)、表型分化系数(Vst)和Shannon-Wiener指数(H)。CV可以说明性状的离散程度和种源间的分化程度,
$CV = \sigma /\bar x \times 100{\rm{\% }}$ ,其中,σ、$\bar x$ 分别为性状的标准差和均值。Vst可描述表型变异在种源间贡献的大小,Vst = σ2t/s/(σ2t/s+σ2s),其中,σ2t/s、σ2s分别为种源间和种源内方差值。Shannon-Wiener指数(H)=−ΣPiln(Pi),Pi=ni/N,Pi表示某性状第i个代码值出现的概率,ni为某表型性状出现的次数,N为样本数[16]。 -
Excel2016软件整理数据,DPS15.10软件中进行相关性分析、主成分分析和聚类分析。采用Pearson相关性分析法对果实的10个特征参数间以及与采集地生态因子进行相关性分析。主成分分析,通常选取主成分的个数为包含80%以上信息的变量,即特征根的累积贡献率大于80%。聚类分析,对原始数据进行标准化处理,采取极差正规化方法:从数据矩阵的每个变量中找出其最大和最小值,二者之差称为极差,然后从每个原始数据中减去该变量中的最小值,再除以极差,即
${x'_{ij}} = \left( {{x_{ij}} - {{\min }_{1 \leqslant i \leqslant n}}\left\{ {{x_{ij}}} \right\}}\right)/ $ ${(\max _{1 \leqslant i \leqslant n}}\left\{ {{x_{ij}}} \right\} -{\min _{1 \leqslant i \leqslant n}}\left\{ {{x_{ij}}} \right\}) $ 。经变换后,每列的最大数据变为1,最小数据变为0,其余数据取值在0~1,基于可变类平均法和绝对值距离作群体间的聚类分析。 -
不同种源白栎果实形态特征统计分析结果表明(表2)表明:14个白栎种源平均果实长度、果实宽度、长宽比及百粒质量分别为22.30 mm、11.48 mm、1.96和152.41 g,其平均变异系数分别为5.10%、6.40%、7.68%和2.65%,其中,百粒质量的变异系数最小,说明百粒质量的变异幅度相对于其它性状较小,百粒质量性状的稳定性较高。白栎果实长度的变化范围为20.72~24.60 mm,其中,重庆江津种源果实最长,江西宜黄种源最短,前者是后者的1.19倍;果实宽度的变化范围为10.69~14.53 mm,其中,浙江遂昌种源果实最宽,四川阆中种源最窄,前者是后者的1.36倍;长宽比的变化范围为1.67~2.17,其中,浙江武义种源最大,浙江遂昌种源最小,前者是后者的1.30倍;百粒质量的变化范围为121.24~249.45 g,其中,浙江遂昌种源最大,四川邻水种源最小,前者是后者的2.06倍。果实形态特征方差分析结果(表3)表明:白栎果实的形态指标果实长度、果实宽度、长宽比和百粒质量在种源间和种源内的差异均达到极显著水平(P<0.01),说明白栎果实各形态特征在种源间和种源内均存在一定程度的变异。为进一步确定白栎果实形态特征的变异来源,采用巢式方差分析,得到其在种源间和种源内的方差分量百分比及表型分化系数,结果(表3)显示:4个形态特征在种源间的表型分化系数变幅为27.98%~40.75%,均值为34.03%;各性状的平均方差分量百分比分别为种源间25.59%、种源内48.64%、随机误差25.77%,说明白栎果实形态特征在种源间和种源内均存在不同程度的变异,种源内的变异是其形态特征变异的主要来源,即种源内的多样性程度大于种源间。
表 2 14个白栎种源果实形态特征及多重比较
Table 2. Fruit morphology and multiple comparisons of 14 provenances of Q. fabri
种源Provenance 果实长度Fruit length/mm 果实宽度Fruit width/mm 长宽比Length-width ratio 百粒质量100-grain mass/g 均值±标准差Mean±standard deviation 变异系数CV/% 均值±标准差Mean±standard deviation 变异系数CV/% 均值±标准差Mean±standard deviation 变异系数CV/% 均值±标准差Mean±standard deviation 变异系数CV/% SCLZ 21.06±0.91 ef 4.32 10.69±0.96 f 8.95 1.99±0.19 bcd 9.68 160.64±2.21 de 1.37 CQWZ 22.34±0.91 cd 4.05 11.69±0.67 bc 5.71 1.91±0.15 cd 7.75 162.85±3.18 cde 2.00 SCLS 22.00±1.13 cdef 5.13 10.76±0.57 def 5.33 2.05±0.16 abc 7.61 121.14±2.82 f 2.23 HBLC 23.17±2.28 bc 9.87 10.94±1.06 cdef 9.73 2.12±0.13 ab 6.32 178.31±2.82 c 1.58 ZJXH 23.22±0.90 bc 3.85 11.56±0.92 bcd 7.98 2.02±0.18 abc 9.05 218.36±6.02 b 2.76 HNLS 21.17±0.80 def 3.77 11.41±0.58 bcdef 5.10 1.86±0.11 d 5.80 128.53±4.38 f 3.41 CQJJ 24.60±1.09 a 4.44 12.00±0.49 b 4.09 2.05±0.09 abc 4.55 170.82±1.64 cd 1.68 ZJSC 24.21±0.80 ab 3.30 14.53±0.63 a 4.32 1.67±0.10 e 5.93 249.45±11.25 a 4.51 ZJWY 23.28±1.09 bc 4.67 10.72±0.61 ef 5.65 2.17±0.14 a 6.58 160.41±1.93 de 1.20 HNXH 21.31±0.96 def 4.50 11.60±0.83 bcd 7.12 1.84±0.18 d 9.73 151.88±4.56 ef 3.00 JXYH 20.72±1.40 f 6.78 11.25±0.69 bcdef 6.12 1.84±0.18 d 9.76 158.01±6.82 e 4.32 FJWYS 22.14±1.31 cde 5.93 11.51±0.76 bcde 6.59 1.93±0.16 cd 8.18 147.07±2.32 e 1.58 GZHP 21.74±1.31 def 6.00 10.99±0.60 cdef 5.43 1.99±0.19 bcd 9.32 126.25±7.04 f 5.58 GXQZ 21.25±1.03 def 4.85 11.03±0.83 cdef 7.53 1.94±0.14 cd 7.30 159.34±3.00 de 1.89 均值 mean 22.30±1.14 5.10 11.48±0.73 6.40 1.96±0.15 7.68 152.41±4.21 2.65 注:同列数据后不同字母表示差异显著(P<0.05)。下同。
Note: The column data marked with different letters indicate the significant differences(P<0.05). The same as below.表 3 白栎表型性状的方差分量及种源间表型分化系数
Table 3. Variation components and phenotypic differentiation coefficients among Q. fabri provenances
果实性状
Fruit traits方差分量
Variance component方差分量百分比
Percentage of variance component/%表型分化系数
Differentiation Coefficients
of Phenotypic traits(Vst)/%F值
F value种源间
Among
provenances种源内
Within
provenances随机误差
Randomerrors种源间
Among
provenances种源内
Within
provenances随机误差
Randomerrors种源间
Among
provenances种源内
Within
provenances果实长度 Fruit length 1.264 3.253 2.075 19.17 49.35 31.48 27.98 22.36** 16.73** 果实宽度 Fruit width 0.889 1.385 0.556 31.41 48.94 19.65 39.09 33.63 ** 21.47** 长宽比Length-width ratio 0.015 0.038 0.024 19.48 49.35 31.17 28.30 14.24** 8.76** 百粒质量100-grain mass 0.663 0.964 0.427 32.28 46.93 20.79 40.75 143.41 ** 112.32** 均值 mean 25.59 48.64 25.77 34.03 注:**表示差异极显著(P<0.01)。下同。
Note: ** Indicates extremely significant different(P<0.01). The same as below.Shannon-Wiener指数(H)可以反映不同性状的丰富度和均匀度,对14个白栎种源的4个形态特征进行多样性指数分析(表4),发现14个白栎种源的Shannon-Wiener指数(H)在1.734~1.916之间,均值为1.839,多样性指数从高到低依次为:SCLS>GZHP>CQJJ>ZJSC>HNXH>FJWYS>GXQZ>SCLZ>HNLS>ZJWY>CQWZ>JXYH>HBLC>ZJXH。4个形态特征的Shannon-Wiener指数均值分别为:果实宽度(1.886)>果实长度(1.837)>长宽比(1.832)>百粒质量(1.801),总体看,4个形态特征的多样性差别不大,果实宽度的多样性略高于其它性状。
表 4 14个白栎种源果实表型性状的Shannon-Wiener指数
Table 4. Shannon-Wiener indexes of phenotypic traits of 14 provenances of Q. fabri
种源
Provenance果实长度
Fruit
length果实宽度
Fruit
width长宽比
Length-width
ratio百粒质量
100-grain
mass均值
MeanSCLZ 1.844 1.947 1.831 1.785 1.852 CQWZ 1.917 1.777 1.831 1.694 1.805 SCLS 1.878 1.990 1.960 1.835 1.916 HBLC 1.513 1.868 1.805 1.806 1.748 ZJXH 1.752 1.655 1.775 1.754 1.734 HNLS 1.614 1.917 1.930 1.925 1.847 CQJJ 1.960 1.921 1.777 1.837 1.874 ZJSC 1.943 1.943 1.709 1.887 1.871 ZJWY 1.900 1.874 1.748 1.762 1.821 HNXH 1.864 1.999 1.805 1.813 1.870 JXYH 1.782 1.900 1.792 1.734 1.802 FJWYS 1.792 2.013 1.900 1.764 1.867 GZHP 1.973 1.782 1.960 1.801 1.879 GXQZ 1.986 1.822 1.822 1.811 1.860 均值 mean 1.837 1.886 1.832 1.801 1.839 -
对白栎果实蛋白质、淀粉、可溶性糖、单宁、脂肪和总黄酮含量进行方差分析(表5),发现这些营养成分含量在14个白栎种源间的差异均极显著(P<0.01),说明白栎果实不同营养成分含量在种源间存在着丰富的遗传多样性。蛋白质含量变化范围为22.63~92.65 mg·g−1,其中,重庆江津种源蛋白质含量最高,福建武夷山种源蛋白质含量最低,前者是后者的4.09倍;淀粉含量变化范围为29.03%~59.73 %,其中,四川阆中种源淀粉含量最高,浙江武义种源淀粉含量最低,前者是后者的2.06倍;可溶性糖含量的变化范围为4.93%~10.96%,其中,湖南龙山种源可溶性糖含量最高,广西全州种源可溶性糖含量最低,前者是后者的2.22倍;单宁含量的变化范围为48.23~101.73 mg·g−1,其中,重庆万州种源单宁含量最高,浙江遂昌种源单宁含量最低,前者是后者的2.11倍;脂肪含量的变化范围为0.33~1.87 mg·g−1,其中,浙江遂昌种源脂肪含量最高,重庆万州种源脂肪含量最低,前者是后者的5.67倍;总黄酮含量的变化范围为0.92~2.72 mg·g−1,其中,福建武夷山种源总黄酮含量最高,浙江西湖种源总黄酮含量最低,前者是后者的2.96倍。白栎果实6种营养成分含量的平均变异系数为17.8%~47.1%,其中,总黄酮含量的变异系数最大,为47.1%,其余依次为脂肪含量(39.8%)、蛋白质含量(37.7%)、单宁含量(29.2%)和可溶性糖含量(21.3%),淀粉含量的变异系数最小(17.8%)。
表 5 14个白栎种源果实营养成分含量及多重比较
Table 5. Nutrient content and multiple comparisons of 14 provenances of Q. fabri
种源
Provenance蛋白质
Protein/(mg·g−1)淀粉
Starch/%可溶性糖
Soluble sugar/%单宁
Tannic/(mg·g−1)脂肪
Fat/%总黄酮
Totalflavonoids/(mg·g−1)SCLZ 58.31±0.25 b 59.73±0.96 a 5.67±0.49 g 58.17±1.06 e 1.13±0.06 e 1.73±0.03 b CQWZ 34.83±0.52 f 41.72±0.65 g 7.63±0.87 e 101.73±0.31 a 0.33±0.06 g 1.73±0.08 b SCLS 44.42±0.40 d 51.13±1.06 e 7.17±0.47 e 54.30±0.98 f 1.83±0.06 a 1.29±0.03 d HBLC 34.83±0.72 f 50.94±0.73 e 6.64±0.92 f 54.77±0.55 fg 1.37±0.06 d 1.01±0.02 gh ZJXH 29.71±0.72 g 50.96±0.76 e 8.45±0.51 d 74.37±1.07 d 1.24±0.12 de 0.92±0.03 h HNLS 38.43±0.35 e 37.83±0.81 i 10.96±0.92 a 88.40±0.85 c 0.37±0.05 g 1.00±0.02 gh CQJJ 92.65±0.75 a 44.74±0.85 f 7.60±0.84 e 92.67±1.01 b 1.27±0.06 de 1.18±0.05 def ZJSC 42.77±0.51 d 54.45±0.78 c 6.25±0.55 f 48.23±0.83 h 1.87±0.06 a 1.08±0.02 fg ZJWY 44.35±0.64 d 29.03±0.21 j 9.76±0.72 b 92.73±0.40 b 0.87±0.05 f 1.44±0.03 c HNXH 37.51±0.53 e 51.69±0.76 e 8.96±0.62 c 51.07±0.81 g 1.38±0.05 cd 1.17±0.06 ef JXYH 44.12±0.64 d 40.54±0.55 h 8.54±0.63 cd 51.57±0.81 g 1.57±0.05 bc 1.23±0.02 de FJWYS 22.63±0.50 h 42.54±0.98 g 10.13±0.80 b 91.47±0.76 b 0.69±0.06 f 2.72±0.02 a GZHP 32.84±0.50 f 52.95±.056 d 8.89±0.41 cd 51.67±0.77 fg 1.58±0.07 b 1.00±0.01 gh GXQZ 53.46±0.35 c 56.75±0.59 b 4.93±0.75 h 49.93±0.38 gh 1.59±0.08 b 0.94±0.01 h 均值mean 43.63±0.54 47.5±0.70 7.97±0.68 70.01±0.76 1.21±0.06 1.32±0.03 变异系数CV/% 37.7 17.8 21.3 29.2 39.8 47.1 F值F value 1 497** 2 730** 449.2** 1 986** 179.7** 596.9** -
不同种源白栎果实特征参数间存在一定的相关性,表6表明:白栎果实长度与长宽比呈显著正相关,果实长度与果实宽度、百粒质量呈极显著正相关,说明果实越长、宽度越大其质量也越大;果实宽度与百粒质量呈极显著正相关,说明果实越宽其质量越大;果实淀粉含量与脂肪含量呈显著正相关,与可溶性糖和单宁含量呈极显著负相关,表明随着淀粉含量的增加,脂肪含量呈增加的趋势,可溶性糖和单宁含量呈降低的趋势;脂肪含量与可溶性糖含量呈显著负相关,与单宁含量呈极显著负相关,表明随着脂肪含量的增加可溶性糖和单宁含量都呈降低的趋势。不同种源白栎果实特征参数与地理气候因子的相关分析表明(表7)表明:仅总黄酮含量与1月均温呈显著正相关,果实的其它特征参数与地理气候因子的相关性均不显著。
表 6 不同种源白栎果实各特征参数间的相关关系
Table 6. Correlations among fruit character parameters of different provenances of Q. fabri
项目
Item果实长度
Fruit length果实宽度
Fruit width长宽比
Length-width ratio百粒质量
100-grain mass蛋白质
Protein淀粉
Starch可溶性糖
Soluble sugar单宁
Tannic脂肪
Fat总黄酮
Total flavonoids果实长度 Fruit length 1.00 果实宽度 Fruit width 0.74** 1.00 长宽比Length-width ratio 0.56* −0.15 1.00 百粒质量100-grain mass 0.79** 0.76** 0.24 1.00 蛋白质Protein 0.30 −0.01 0.45 0.13 1.00 淀粉Starch 0.18 −0.16 0.46 0.14 0.09 1.00 可溶性糖Soluble sugar −0.24 0.12 −0.50 −0.23 −0.39 −0.73** 1.00 单宁Tannic 0.15 0.34 −0.20 0.09 0.07 −0.71** 0.52 1.00 脂肪Fat 0.20 −0.18 0.52 0.15 0.20 0.60* −0.54* −0.85** 1.00 总黄酮Total flavonoids −0.14 −0.13 −0.07 −0.19 −0.22 −0.24 0.24 0.46 −0.47 1.00 注:*表示显著水平差异(P<0.05),**表示差异极显著( P <0.01)。下同。
Note: * Indicates significant different(P<0.05), ** Indicates extremely significant different( P <0.01). The same as below.表 7 不同种源白栎果实各特征参数与地理气候因子间的相关分析
Table 7. Correlations between fruit character parameters and ecological factors of different provenances of Q. fabri
项目
Item果实长度
Fruit length果实宽度
Fruit width长宽比
Length-width
ratio百粒质量
100-grain
mass蛋白质
Protein淀粉
Starch可溶性糖
Soluble
sugar单宁
Tannic脂肪
Fat总黄酮
Total
flavonoids纬度N 0.23 0.07 0.26 0.24 0.03 0.09 −0.16 0.20 −0.24 0.04 经度E 0.09 0.40 −0.36 0.44 −0.45 −0.36 0.33 0.13 −0.02 0.21 海拔高度Altitude 0.49 0.22 0.44 0.17 0.42 0.32 −0.23 −0.31 0.37 −0.41 年均温度Mean annual temperature −0.02 0.02 −0.07 0.05 0.31 −0.24 0.02 0.43 −0.24 0.42 年均相对湿度Mean annual humidity −0.07 −0.35 0.34 −0.47 0.21 −0.13 0.01 −0.12 0.18 −0.22 年降水量Mean annual rainfall −0.16 0.09 −0.36 0.01 −0.43 −0.32 0.21 0.01 0.01 0.34 年均日照时数Mean annual sunshine duration −0.04 0.22 −0.33 0.36 −0.30 −0.32 0.05 0.09 0.01 0.23 1月均温Mean temperature of January 0.13 −0.07 0.25 −0.01 0.42 −0.12 −0.08 0.45 −0.22 0.57* 7月均温Mean temperature of July −0.08 0.03 −0.15 0.13 0.18 −0.33 0.07 0.34 −0.12 0.20 -
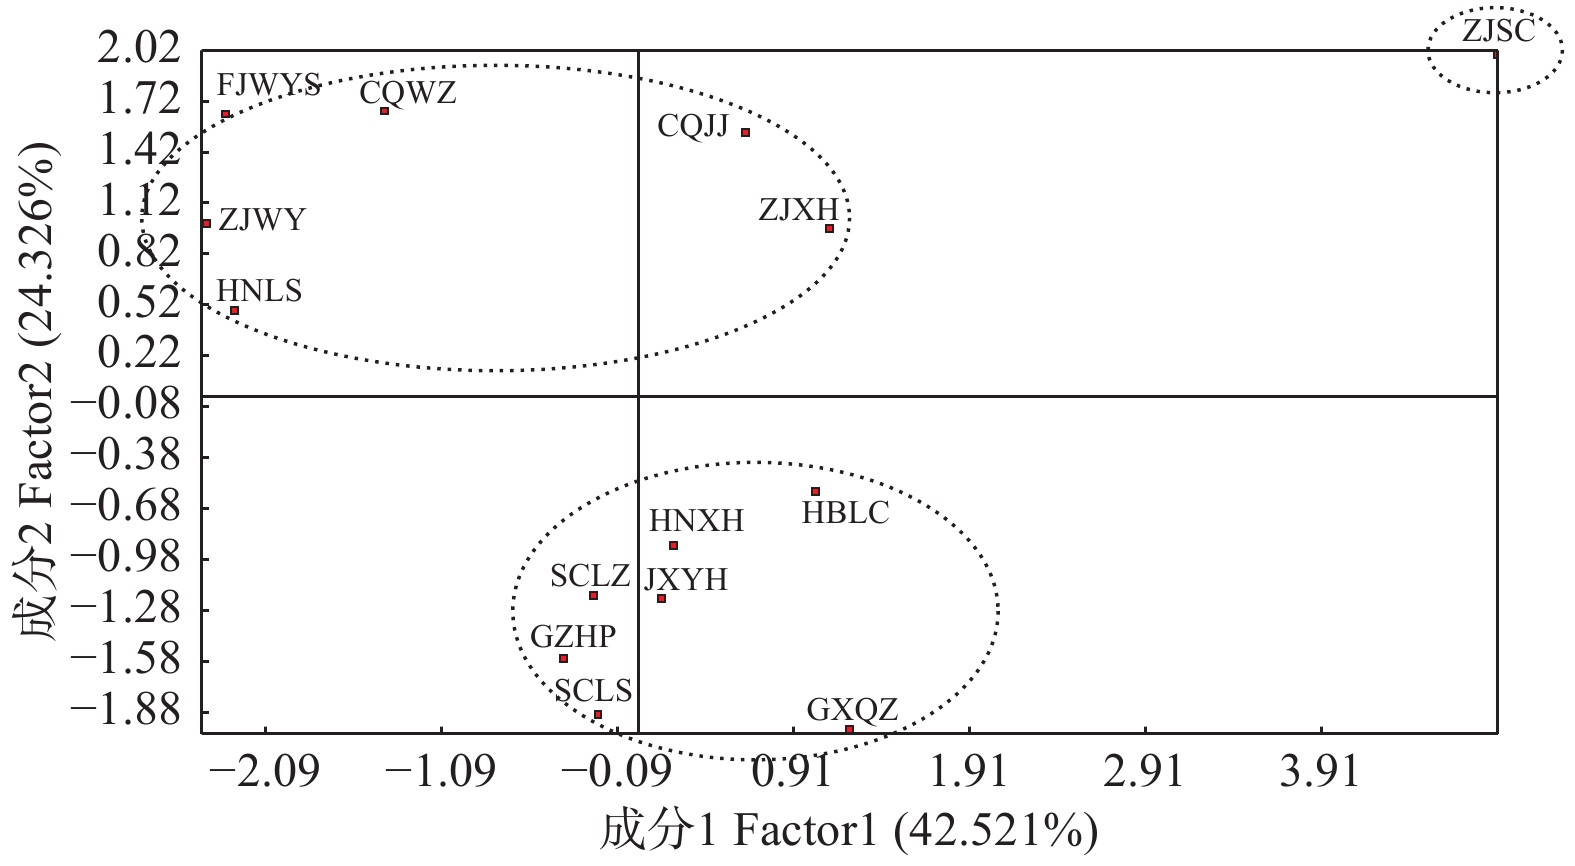
对不同种源白栎果实的10个特征参数进行主成分分析(表8),得到3个特征值大于1.000的主成分,它们的贡献率依次为42.521%、24.326%、16.517%,累积贡献率为83.364%,保留了原始性状的大部分信息。第1主成分中载荷量较大的因子由大到小依次为淀粉含量>百粒质量>脂肪含量,主要反映了果实的质量性状;第2主成分主要包含果实长度、果实宽度和单宁含量;第3主成分主要包含长宽比和蛋白质含量。基于第1主成分、第2主成分绘制散点图(图1),发现白栎不同种源的地理分布对白栎果实形态特征及营养成分含量影响较大,其中,浙江遂昌种源受地理因子影响较大。
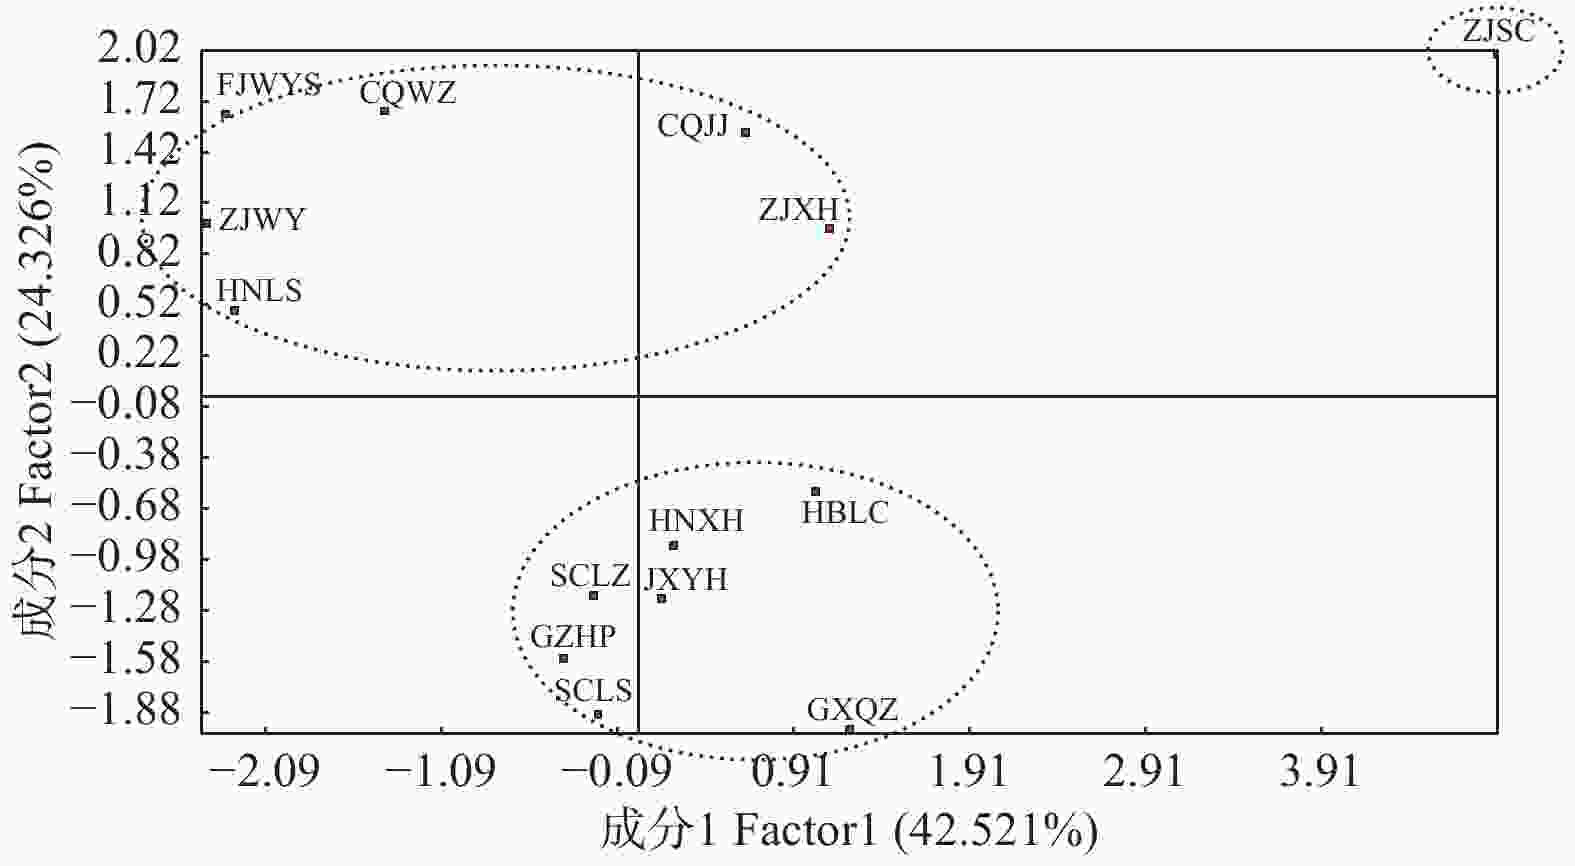
图 1 基于果实特征参数的白栎天然种源关系
Figure 1. The relationship among different Q. fabri provenances based on fruit characteristic parameters
表 8 白栎果实特征参数的主成分分析
Table 8. Principal component analysis of characteristic parameters of Q. fabri
性状
Traits第1主成分
First
principal
component第2主成分
Second
principal
component第3主成分
Third
principal
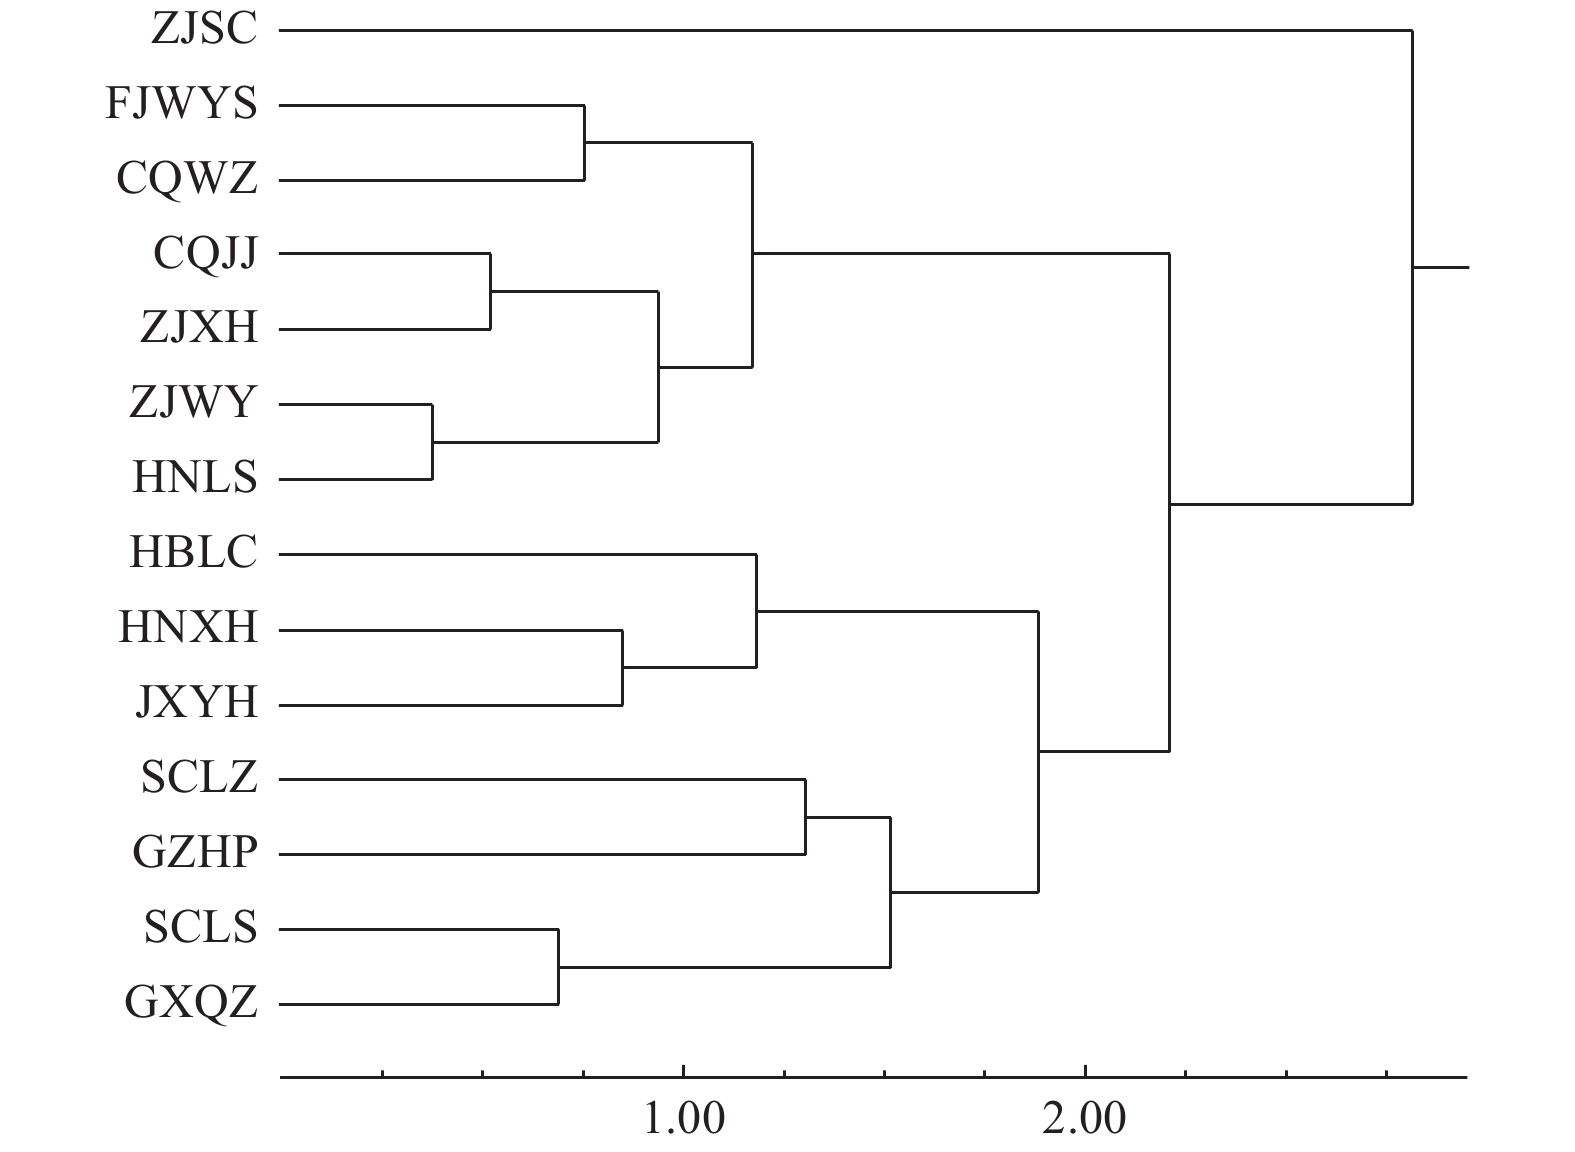
component果实长度Fruit length 0.208 0.445 0.429 果实宽度Fruit width 0.360 0.410 −0.201 长宽比Length-width ratio −0.229 −0.131 0.583 百粒质量100-grain mass 0.393 0.345 0.030 蛋白质Protein 0.098 −0.018 0.563 淀粉Starch 0.437 0.071 −0.076 可溶性糖Soluble sugar −0.345 0.236 −0.197 单宁Tannic −0.317 0.494 0.188 脂肪Fat 0.372 −0.362 0.080 总黄酮Total flavonoids −0.250 0.249 −0.179 特征值Eigen value 4.231 2.432 1.653 贡献率Variance/% 42.521 24.326 16.517 累积贡献率Cumulative proportion/% 42.521 66.847 83.364 将10个特征参数的原始数据进行标准化转换,采用可变类平均法,对14个白栎种源进行Q型聚类分析,结果(图2)显示:可将白栎种源划分为3类,其中,湖北利川、四川邻水、四川阆中、贵州黄平、湖南新晃、江西宜黄和广西全州种源为第一类,其特点是果实形态较小,个体质量较小,蛋白质和淀粉含量高;重庆万州、重庆江津、湖南龙山、福建武夷山、浙江武义、浙江西湖种源为第二类,其特点是果实形态较大,个体质量大,可溶性糖、总黄酮和单宁含量高;而浙江遂昌种源单独列为一类,其果实远大于其它种源,百粒质量最大。
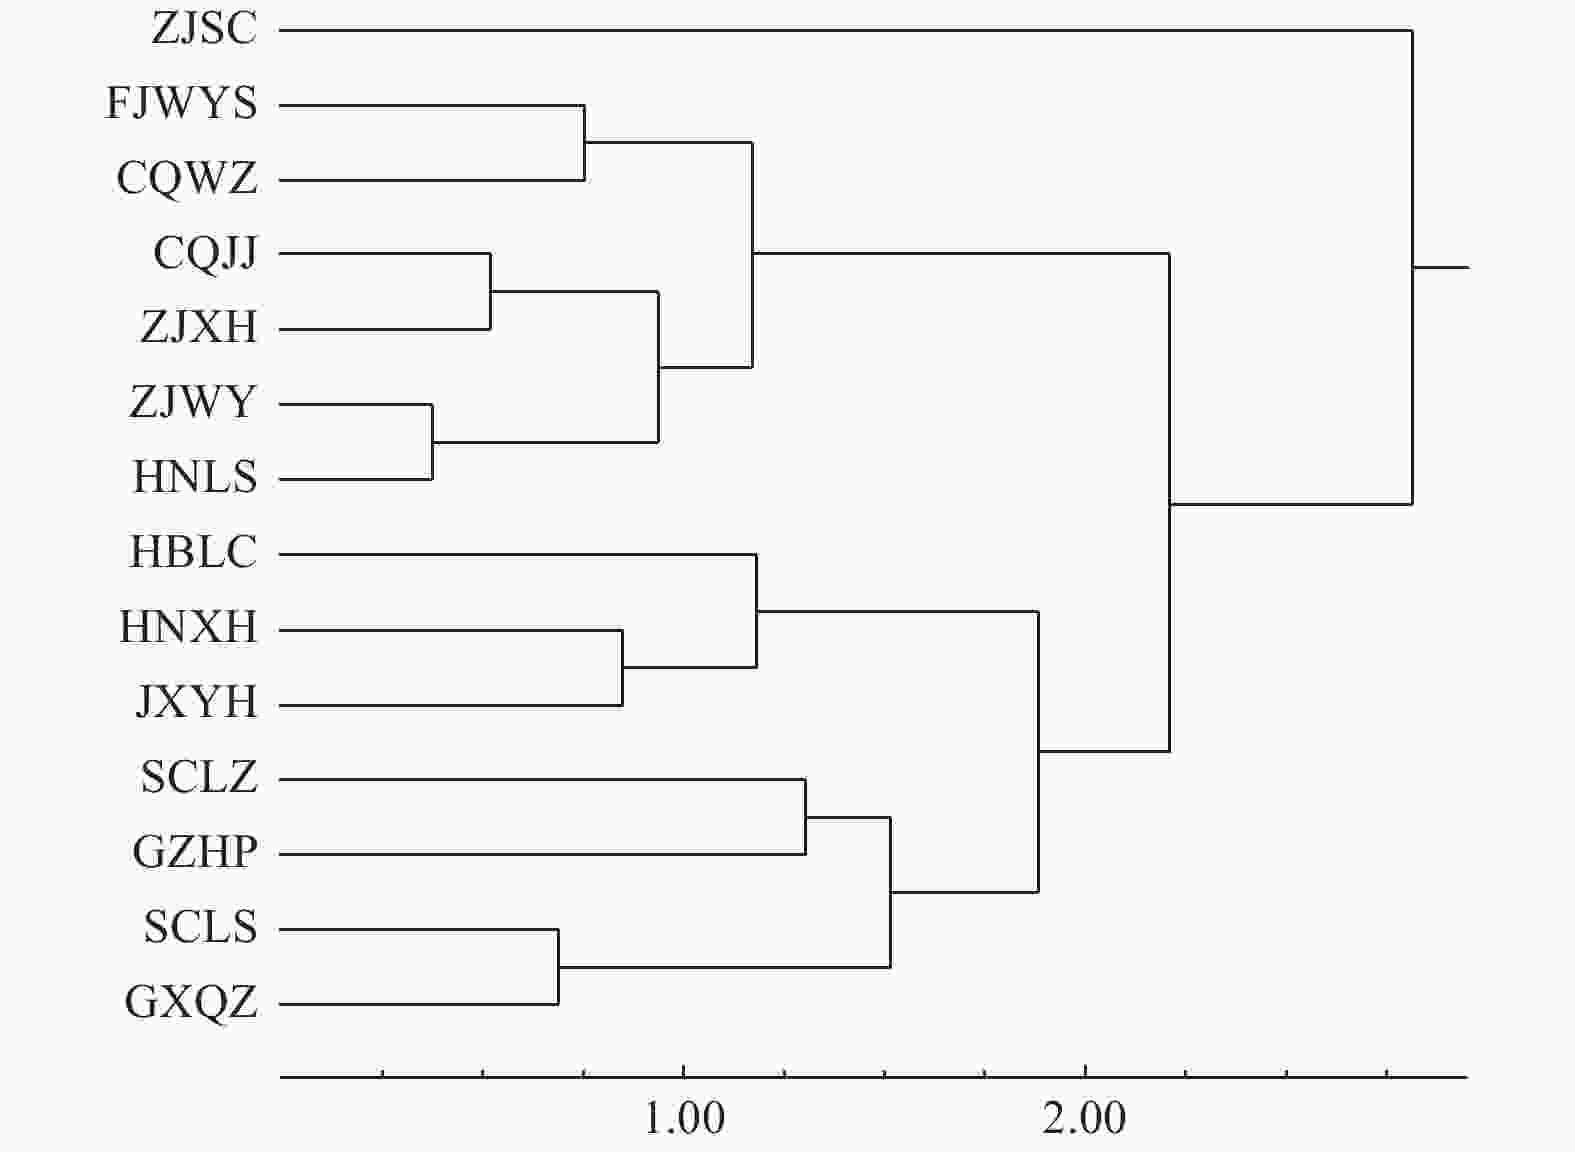
图 2 14个白栎种源的聚类分析树状图
Figure 2. Cluster analysis of 14 provenances of Q. fabri
-
一个树种分布区域广,由于突变、自然选择和隔离等原因,分化并产生了种内不同的地理生态种源[17],表型性状的变异既受遗传控制,也受环境因素影响[18-20]。白栎的自然分布东至浙江,西至云南,南至广东,北至陕西南部,复杂的生境和地理隔离使得白栎的某些性状在不同种源间产生了遗传分化。表型变异是生物遗传变异最直接的表现,也是遗传多样性研究的重要内容之一[21-22],选用果实进行表型性状多样性的研究,可在一定程度上反映不同群体的变异大小和遗传多样性水平[23-24]。本研究表明,14个白栎种源果实形态特征在种源内和种源间均差异极显著,营养成分含量在种源间差异极显著,这与国内对其它栎类树种,如麻栎(Q. acutissima Carruth)、蒙古栎(Q. mongolica Fisch. ex Ledeb)和栓皮栎(Q. variabilis Bl.)等果实性状的种源变异研究结果基本吻合[25-27],这些差异是种源选择和良种选育的基础。白栎果实6种营养成分含量变异系数的变幅为17.8%~47.1%,均值为32.15%,4个形态指标变异系数的变幅为2.65%~7.68%,均值为5.46%,其营养成分含量的平均变异系数远大于果实形态的平均变异系数,说明白栎果实形态特征相对营养成分含量来说较稳定。白栎种源的平均表型分化系数为34.03%,说明白栎种源表型变异在种源间的贡献率为34.03%,在种源内的贡献率为65.97%,种源内的变异高于种源间,变异的来源主要为种源内。研究表明[28],异花授粉的植物交配系统可以促进种源间的基因交流,增大有效群体规模,减少基因漂变对遗传结构的影响。白栎为风媒异花授粉,授粉能力强,可以进行较远距离扩散,从而增进了种源间的基因流动;白栎结实量多,果实成熟时自然脱落,易被野生动物取食、搬运,促进了基因流的流动,从而减少了种源间的差异。这与大多数林木种源的表型变异来源相同,即种源内的变异是变异的主要来源,如格木(Erythrophleum fordii Oliv)(21.56%)[16]、砂生槐(Sophora moorcroftiana (Benrh.)Baker)(39.25%)[29]、板栗(Castanea mollissima Bl.)(23.42%)[30]等。遗传多样性可以反映某一性状的不同表现等级和数量分布,在形态多样性研究中,多样性指数越高表明形态性状的多样性越丰富。白栎果实形态特征的Shannon-Wiener指数(H)均值为1.839,与垂珠花(Styrax dasyantha Perk)表型遗传多样性指数(1.894)接近[31],低于格木表型多样性指数(2.0278)[16]和滇楸(Catalpa fargesii Bur. f. duclouxii(Dode)Gilmour)表型多样性指数(1.918)[32],大于7种兰属(Cymbidium Sw.)表型多样性指数(1.037)[33],其中,四川邻水、贵州黄平种源的多样性指数较高,可作为种质资源收集保存和多样性保护的重点区域。
白栎果实富含淀粉,还含有蛋白质、可溶性糖、脂肪、单宁、维生素、矿质元素等营养成分,是一种可开发利用的优良木本粮食资源。对蒙古栎橡实的研究发现,其可利用的营养价值和产热量均与玉米和高粱相近,略优于稻谷[5]。橡实淀粉经加工去除单宁就能食用,目前已利用橡实淀粉生产出多种食品,如橡子豆腐、橡子白酒、橡子挂面和橡子酱等[34]。对14个白栎种源果实的营养成分含量进行分析,发现大部分种源的橡实淀粉含量超过50%,可将其分为3类:第一类为高淀粉含量类群,包括四川阆中、广西全州和浙江遂昌种源,其中,四川阆中种源淀粉含量最高,约达60%,比一般粮食作物淀粉含量都高;第二类为中淀粉含量类群,包括湖北利川、四川邻水、贵州黄平、湖南新晃和浙江西湖种源,这类群体的淀粉含量在50%~53%;第三类为低淀粉含量类群,包括重庆江津、重庆万州、湖南龙山、福建武夷山、江西宜黄和浙江武义种源,这类群体的淀粉含量低于50%。
-
植物果实表型性状和营养成分含量的地理变异规律较复杂,通常由基因型和环境因子共同决定。因此,不同的物种具有不同的变异模式,如山杏(Armeniaca sibirica(L.)Lam)表现出以经度、年降水量和年日照时间为主的变异模式[35];长柄扁桃(Amygdalus pcdunculata Pall)呈现出以平均气温和无霜期为主的变异模式[36];浙江楠(Phoebe chekiangensis C. B. Shang)表现出以海拔为主的变异模式[37]。白栎果实的10个特征参数与地理气候因子间的相关性分析表明,大多数特征参数与地理气候因子间的相关性不强,仅总黄酮含量与1月均温呈显著相关性。本研究采样点地形差异较大,有平原、盆地和山地丘陵等,不同种源立地条件差别巨大。一些研究表明,植物果实大小会随海拔升高而降低,可能是由环境变化引起的对可利用资源减少的可塑性响应[38],但重庆江津和浙江遂昌都是高海拔种源,其果实反而较大,可能由于所处的小气候有关,它们都属于山地气候,昼夜温差大,白天光合作用强,夜间呼吸作用弱,营养消耗少,这有利于果实膨大和营养积累。
根据白栎种源果实主成分分析和聚类分析结果,可将14个白栎种源划分为3类,发现白栎种源并未完全按照地理距离的远近而聚类,表型性状具有不连续性。不同种源白栎果实差异明显,华东和西南地区的种源果实个体及质量均较大,而华中地区的种源果实个体和质量较小。白栎果实形态特征及营养成分含量的地理变异在大部分地区呈现区域板块变异模式,小部分地区则呈现随机变异模式。各种源白栎果实形态特征和营养成分含量均存在极显著差异,但造成这种差异的主要原因是遗传因素还是环境因子尚不清楚,还需进一步利用种源试验来剖析遗传和环境及其互作效应。
-
本研究表明,白栎果实的形态特征在种源内和种源间均差异极显著,种源内的变异高于种源间的变异,营养成分含量在种源间均差异极显著,说明其存在着丰富的遗传变异,且营养成分含量的变异系数高于形态特征的变异系数。根据聚类分析结果,可将14个白栎种源划分为3大类群,结合营养成分含量分析结果可以看出,浙江遂昌种源果实综合品质最好,是一个有潜力的优良种源。
不同种源白栎果实形态特征和营养成分含量变异分析
Variation in Morphological Characters and Nutrient Contents of Quercus fabri Fruits from Different Provenances
-
摘要:
目的 研究不同种源白栎果实形态特征和营养成分变异规律,为白栎品种选育和种质资源开发利用提供科学依据。 方法 收集白栎自然分布区14个天然种源368个单株果实,分别测定4个形态特征指标和6个营养成分含量指标,并进行统计学分析、主成分分析和聚类分析。 结果 (1)白栎4个形态特征在种源间和种源内均差异极显著,6个营养成分含量在种源间均差异极显著。白栎果实形态特征的Shannon-Wiener指数(H)均值为1.839,其中,果实宽度(1.886)>果实长度(1.837)>长宽比(1.832)>百粒质量(1.801);(2)白栎果实10个特征参数间大多存在显著或极显著相关性,其与地理气候因子间仅个别存在显著相关性;(3)对10个特征参数进行Q型聚类分析,可将14个白栎种源划分为3大类群:湖北利川、四川邻水、四川阆中、贵州黄平、湖南新晃、江西宜黄和广西全州种源为第一类;重庆万州、重庆江津、湖南龙山、福建武夷山、浙江武义、浙江西湖种源为第二类;浙江遂昌种源单独归为一类。 结论 白栎果实形态特征在种源内和种源间均差异极显著,种源内的变异高于种源间的变异,营养成分含量在种源间均差异极显著,说明其存在着丰富的遗传变异;果实特征参数与地理气候因子间存在一定的相关性。综合聚类分析和营养成分含量分析结果,可以看出浙江遂昌种源果实综合品质最好。 Abstract:Objective To provide references for breeding and germplasm resources development of Quercus fabri by analyzing the variations of fruit morphology and nutrient composition of Q. fabri from different provenances. Method The fruits of 368 individual plants from 14 Q. fabri provenances were collected, and 4 morphological characteristics and 6 nutrient content indicators of each fruit were measured, then, the statistical analysis, principal component analysis and cluster analysis were conducted. Result (1) There were extremely significant differences in the 4 morphological characteristics of Q. fabri among and within these provenances, and there were significant differences in 6 nutrient contents among provenances. The mean value of Shannon-Wiener (H) of fruit morphology characteristics was 1.839, in which the values of fruit width, fruit length, length-width ratio and 100-grain mass were 1.886, 1.837, 1.832, and 1.801. (2) The results of correlation analysis showed that most of the 10 characteristic parameters had significant or extremely significant correlations, however, only a few of them had significant correlations with geographical and climatic factors. (3) According to the results of Q-type cluster analysis of 10 characteristic parameters, the 14 Q. fabri provenances could be divided into 3 groups. Conclusion There are extremely significant differences in morphological characteristics of Q. fabri fruit within or among provenances, and the difference is greater within provenance than among provenances. There are extremely significant differences in nutrient content among provenances. It shows abundant genetic variations. There is a certain correlation between fruit characteristic parameters and geographic climate factors. Based on the results of cluster analysis and nutrient content analysis, it is proved that the fruit quality of the provenance from Suichang of Zhejiang Province is the best. -
Key words:
- Quercus fabri
- / provenance
- / fruit morphology
- / nutrient composition
- / geographic variation
-
图 1 基于果实特征参数的白栎天然种源关系
Figure 1. The relationship among different Q. fabri provenances based on fruit characteristic parameters
表 1 14个白栎种源的地理位置及主要气象因子
Table 1. Geographic location and habitat of 14 provenances of Q. fabri
种源
Provenance编号
Code株数
Number年均相对湿度
Meanannual
humidit/%年均温度
Meanannual
temperature/℃年均日照时数
Mean annual
sunshine
duration /h年降水量
Meanannual
rainfall/mm1月均温
Mean temperature
of January/℃7月均温
Mean temperature
of July/℃纬度N/(°) 经度E/(°) 海拔高度
Altitude/m四川阆中 SCLZ 26 78 16.9 1 379 1 027 6.1 26.7 31.42 106.17 440 重庆万州 CQWZ 27 81 18.2 1 484 1 185 7.3 28.4 30.38 108.37 330 四川邻水 SCLS 25 84 16.1 1 286 1 200 6.3 27.1 30.33 107.07 430 湖北利川 HBLC 22 81 12.9 1 300 1 301 2.2 23.0 30.31 109.49 834 浙江西湖 ZJXH 30 76 17.0 1 765 1 438 4.6 28.9 30.28 120.06 156 湖南龙山 HNLS 24 80 16.1 1 161 1 308 4.8 26.4 29.34 109.42 542 重庆江津 CQJJ 29 81 18.3 1 141 1 000 8.0 28.0 28.65 106.40 924 浙江遂昌 ZJSC 30 78 17.1 1 755 1 579 5.8 27.7 28.64 119.18 748 浙江武义 ZJWY 30 79 17.3 1 891 1 520 5.2 28.9 28.46 119.39 160 湖南新晃 HNXH 23 80 16.6 1 321 1 155 5.1 27.0 27.65 110.32 520 江西宜黄 JXYH 25 81 17.7 1 765 1 832 5.5 29.0 27.39 116.25 418 福建武夷山 FJWYS 30 77 18.3 1 629 1 926 7.8 27.8 27.38 119.58 226 贵州黄平 GZHP 26 81 14.9 1 104 1 090 3.7 24.8 27.12 107.79 820 广西全州 GXQZ 21 78 18.1 1 443 1 566 6.5 28.5 26.01 109.96 350 注:浙江西湖采种地为杭州西山国家森林公园。
Note: Zhejiang West Lake provenance comes from Xishan National Forest Park of Hangzhou. 下载: 导出CSV
表 2 14个白栎种源果实形态特征及多重比较
Table 2. Fruit morphology and multiple comparisons of 14 provenances of Q. fabri
种源Provenance 果实长度Fruit length/mm 果实宽度Fruit width/mm 长宽比Length-width ratio 百粒质量100-grain mass/g 均值±标准差Mean±standard deviation 变异系数CV/% 均值±标准差Mean±standard deviation 变异系数CV/% 均值±标准差Mean±standard deviation 变异系数CV/% 均值±标准差Mean±standard deviation 变异系数CV/% SCLZ 21.06±0.91 ef 4.32 10.69±0.96 f 8.95 1.99±0.19 bcd 9.68 160.64±2.21 de 1.37 CQWZ 22.34±0.91 cd 4.05 11.69±0.67 bc 5.71 1.91±0.15 cd 7.75 162.85±3.18 cde 2.00 SCLS 22.00±1.13 cdef 5.13 10.76±0.57 def 5.33 2.05±0.16 abc 7.61 121.14±2.82 f 2.23 HBLC 23.17±2.28 bc 9.87 10.94±1.06 cdef 9.73 2.12±0.13 ab 6.32 178.31±2.82 c 1.58 ZJXH 23.22±0.90 bc 3.85 11.56±0.92 bcd 7.98 2.02±0.18 abc 9.05 218.36±6.02 b 2.76 HNLS 21.17±0.80 def 3.77 11.41±0.58 bcdef 5.10 1.86±0.11 d 5.80 128.53±4.38 f 3.41 CQJJ 24.60±1.09 a 4.44 12.00±0.49 b 4.09 2.05±0.09 abc 4.55 170.82±1.64 cd 1.68 ZJSC 24.21±0.80 ab 3.30 14.53±0.63 a 4.32 1.67±0.10 e 5.93 249.45±11.25 a 4.51 ZJWY 23.28±1.09 bc 4.67 10.72±0.61 ef 5.65 2.17±0.14 a 6.58 160.41±1.93 de 1.20 HNXH 21.31±0.96 def 4.50 11.60±0.83 bcd 7.12 1.84±0.18 d 9.73 151.88±4.56 ef 3.00 JXYH 20.72±1.40 f 6.78 11.25±0.69 bcdef 6.12 1.84±0.18 d 9.76 158.01±6.82 e 4.32 FJWYS 22.14±1.31 cde 5.93 11.51±0.76 bcde 6.59 1.93±0.16 cd 8.18 147.07±2.32 e 1.58 GZHP 21.74±1.31 def 6.00 10.99±0.60 cdef 5.43 1.99±0.19 bcd 9.32 126.25±7.04 f 5.58 GXQZ 21.25±1.03 def 4.85 11.03±0.83 cdef 7.53 1.94±0.14 cd 7.30 159.34±3.00 de 1.89 均值 mean 22.30±1.14 5.10 11.48±0.73 6.40 1.96±0.15 7.68 152.41±4.21 2.65 注:同列数据后不同字母表示差异显著(P<0.05)。下同。
Note: The column data marked with different letters indicate the significant differences(P<0.05). The same as below.
下载: 导出CSV
表 3 白栎表型性状的方差分量及种源间表型分化系数
Table 3. Variation components and phenotypic differentiation coefficients among Q. fabri provenances
果实性状
Fruit traits方差分量
Variance component方差分量百分比
Percentage of variance component/%表型分化系数
Differentiation Coefficients
of Phenotypic traits(Vst)/%F值
F value种源间
Among
provenances种源内
Within
provenances随机误差
Randomerrors种源间
Among
provenances种源内
Within
provenances随机误差
Randomerrors种源间
Among
provenances种源内
Within
provenances果实长度 Fruit length 1.264 3.253 2.075 19.17 49.35 31.48 27.98 22.36** 16.73** 果实宽度 Fruit width 0.889 1.385 0.556 31.41 48.94 19.65 39.09 33.63 ** 21.47** 长宽比Length-width ratio 0.015 0.038 0.024 19.48 49.35 31.17 28.30 14.24** 8.76** 百粒质量100-grain mass 0.663 0.964 0.427 32.28 46.93 20.79 40.75 143.41 ** 112.32** 均值 mean 25.59 48.64 25.77 34.03 注:**表示差异极显著(P<0.01)。下同。
Note: ** Indicates extremely significant different(P<0.01). The same as below.
下载: 导出CSV
表 4 14个白栎种源果实表型性状的Shannon-Wiener指数
Table 4. Shannon-Wiener indexes of phenotypic traits of 14 provenances of Q. fabri
种源
Provenance果实长度
Fruit
length果实宽度
Fruit
width长宽比
Length-width
ratio百粒质量
100-grain
mass均值
MeanSCLZ 1.844 1.947 1.831 1.785 1.852 CQWZ 1.917 1.777 1.831 1.694 1.805 SCLS 1.878 1.990 1.960 1.835 1.916 HBLC 1.513 1.868 1.805 1.806 1.748 ZJXH 1.752 1.655 1.775 1.754 1.734 HNLS 1.614 1.917 1.930 1.925 1.847 CQJJ 1.960 1.921 1.777 1.837 1.874 ZJSC 1.943 1.943 1.709 1.887 1.871 ZJWY 1.900 1.874 1.748 1.762 1.821 HNXH 1.864 1.999 1.805 1.813 1.870 JXYH 1.782 1.900 1.792 1.734 1.802 FJWYS 1.792 2.013 1.900 1.764 1.867 GZHP 1.973 1.782 1.960 1.801 1.879 GXQZ 1.986 1.822 1.822 1.811 1.860 均值 mean 1.837 1.886 1.832 1.801 1.839
下载: 导出CSV
表 5 14个白栎种源果实营养成分含量及多重比较
Table 5. Nutrient content and multiple comparisons of 14 provenances of Q. fabri
种源
Provenance蛋白质
Protein/(mg·g−1)淀粉
Starch/%可溶性糖
Soluble sugar/%单宁
Tannic/(mg·g−1)脂肪
Fat/%总黄酮
Totalflavonoids/(mg·g−1)SCLZ 58.31±0.25 b 59.73±0.96 a 5.67±0.49 g 58.17±1.06 e 1.13±0.06 e 1.73±0.03 b CQWZ 34.83±0.52 f 41.72±0.65 g 7.63±0.87 e 101.73±0.31 a 0.33±0.06 g 1.73±0.08 b SCLS 44.42±0.40 d 51.13±1.06 e 7.17±0.47 e 54.30±0.98 f 1.83±0.06 a 1.29±0.03 d HBLC 34.83±0.72 f 50.94±0.73 e 6.64±0.92 f 54.77±0.55 fg 1.37±0.06 d 1.01±0.02 gh ZJXH 29.71±0.72 g 50.96±0.76 e 8.45±0.51 d 74.37±1.07 d 1.24±0.12 de 0.92±0.03 h HNLS 38.43±0.35 e 37.83±0.81 i 10.96±0.92 a 88.40±0.85 c 0.37±0.05 g 1.00±0.02 gh CQJJ 92.65±0.75 a 44.74±0.85 f 7.60±0.84 e 92.67±1.01 b 1.27±0.06 de 1.18±0.05 def ZJSC 42.77±0.51 d 54.45±0.78 c 6.25±0.55 f 48.23±0.83 h 1.87±0.06 a 1.08±0.02 fg ZJWY 44.35±0.64 d 29.03±0.21 j 9.76±0.72 b 92.73±0.40 b 0.87±0.05 f 1.44±0.03 c HNXH 37.51±0.53 e 51.69±0.76 e 8.96±0.62 c 51.07±0.81 g 1.38±0.05 cd 1.17±0.06 ef JXYH 44.12±0.64 d 40.54±0.55 h 8.54±0.63 cd 51.57±0.81 g 1.57±0.05 bc 1.23±0.02 de FJWYS 22.63±0.50 h 42.54±0.98 g 10.13±0.80 b 91.47±0.76 b 0.69±0.06 f 2.72±0.02 a GZHP 32.84±0.50 f 52.95±.056 d 8.89±0.41 cd 51.67±0.77 fg 1.58±0.07 b 1.00±0.01 gh GXQZ 53.46±0.35 c 56.75±0.59 b 4.93±0.75 h 49.93±0.38 gh 1.59±0.08 b 0.94±0.01 h 均值mean 43.63±0.54 47.5±0.70 7.97±0.68 70.01±0.76 1.21±0.06 1.32±0.03 变异系数CV/% 37.7 17.8 21.3 29.2 39.8 47.1 F值F value 1 497** 2 730** 449.2** 1 986** 179.7** 596.9**
下载: 导出CSV
表 6 不同种源白栎果实各特征参数间的相关关系
Table 6. Correlations among fruit character parameters of different provenances of Q. fabri
项目
Item果实长度
Fruit length果实宽度
Fruit width长宽比
Length-width ratio百粒质量
100-grain mass蛋白质
Protein淀粉
Starch可溶性糖
Soluble sugar单宁
Tannic脂肪
Fat总黄酮
Total flavonoids果实长度 Fruit length 1.00 果实宽度 Fruit width 0.74** 1.00 长宽比Length-width ratio 0.56* −0.15 1.00 百粒质量100-grain mass 0.79** 0.76** 0.24 1.00 蛋白质Protein 0.30 −0.01 0.45 0.13 1.00 淀粉Starch 0.18 −0.16 0.46 0.14 0.09 1.00 可溶性糖Soluble sugar −0.24 0.12 −0.50 −0.23 −0.39 −0.73** 1.00 单宁Tannic 0.15 0.34 −0.20 0.09 0.07 −0.71** 0.52 1.00 脂肪Fat 0.20 −0.18 0.52 0.15 0.20 0.60* −0.54* −0.85** 1.00 总黄酮Total flavonoids −0.14 −0.13 −0.07 −0.19 −0.22 −0.24 0.24 0.46 −0.47 1.00 注:*表示显著水平差异(P<0.05),**表示差异极显著( P <0.01)。下同。
Note: * Indicates significant different(P<0.05), ** Indicates extremely significant different( P <0.01). The same as below.
下载: 导出CSV
表 7 不同种源白栎果实各特征参数与地理气候因子间的相关分析
Table 7. Correlations between fruit character parameters and ecological factors of different provenances of Q. fabri
项目
Item果实长度
Fruit length果实宽度
Fruit width长宽比
Length-width
ratio百粒质量
100-grain
mass蛋白质
Protein淀粉
Starch可溶性糖
Soluble
sugar单宁
Tannic脂肪
Fat总黄酮
Total
flavonoids纬度N 0.23 0.07 0.26 0.24 0.03 0.09 −0.16 0.20 −0.24 0.04 经度E 0.09 0.40 −0.36 0.44 −0.45 −0.36 0.33 0.13 −0.02 0.21 海拔高度Altitude 0.49 0.22 0.44 0.17 0.42 0.32 −0.23 −0.31 0.37 −0.41 年均温度Mean annual temperature −0.02 0.02 −0.07 0.05 0.31 −0.24 0.02 0.43 −0.24 0.42 年均相对湿度Mean annual humidity −0.07 −0.35 0.34 −0.47 0.21 −0.13 0.01 −0.12 0.18 −0.22 年降水量Mean annual rainfall −0.16 0.09 −0.36 0.01 −0.43 −0.32 0.21 0.01 0.01 0.34 年均日照时数Mean annual sunshine duration −0.04 0.22 −0.33 0.36 −0.30 −0.32 0.05 0.09 0.01 0.23 1月均温Mean temperature of January 0.13 −0.07 0.25 −0.01 0.42 −0.12 −0.08 0.45 −0.22 0.57* 7月均温Mean temperature of July −0.08 0.03 −0.15 0.13 0.18 −0.33 0.07 0.34 −0.12 0.20
下载: 导出CSV
表 8 白栎果实特征参数的主成分分析
Table 8. Principal component analysis of characteristic parameters of Q. fabri
性状
Traits第1主成分
First
principal
component第2主成分
Second
principal
component第3主成分
Third
principal
component果实长度Fruit length 0.208 0.445 0.429 果实宽度Fruit width 0.360 0.410 −0.201 长宽比Length-width ratio −0.229 −0.131 0.583 百粒质量100-grain mass 0.393 0.345 0.030 蛋白质Protein 0.098 −0.018 0.563 淀粉Starch 0.437 0.071 −0.076 可溶性糖Soluble sugar −0.345 0.236 −0.197 单宁Tannic −0.317 0.494 0.188 脂肪Fat 0.372 −0.362 0.080 总黄酮Total flavonoids −0.250 0.249 −0.179 特征值Eigen value 4.231 2.432 1.653 贡献率Variance/% 42.521 24.326 16.517 累积贡献率Cumulative proportion/% 42.521 66.847 83.364
下载: 导出CSV
-
[1] 中国科学院中国植物志编辑委员会. 中国植物志: 第22卷[M]. 北京: 科学出版社, 2004: 227. [2] 温佐吾, 张文武. 白栎次生薪炭林的工艺成熟与适宜采伐年龄[J]. 山地农业生物学报, 2012, 31(5):439-442. doi: 10.3969/j.issn.1008-0457.2012.05.014 [3] 李 璇, 李 垚, 方炎明. 基于优化的Maxent模型预测白栎在中国的潜在分布区[J]. 林业科学, 2018, 54(8):156-167. [4] 韦晓霞, 张艳芳, 周丹蓉, 等. 福建省白栎资源及其开发利用[J]. 东南园艺, 2013, 1(2):55-57. doi: 10.3969/j.issn.1004-6089.2013.02.018 [5] 郝乘仪, 于 蕾, 胡 杨. 我国橡子开发利用现状与前景[J]. 吉林医药学院学报, 2017, 38(5):11-13. [6] 杜会聪, 蒋雅婷, 田 敏, 等. 浙江省野生蜡梅花部形态变异及其与环境因子的相关性[J]. 生态学报, 2018, 38(16):5800-5809. [7] 刘仁林, 王 娟, 廖为明. 10种壳斗科植物果实主要营养成分比较分析[J]. 江西农业大学学报, 2009, 31(5):901-905. doi: 10.3969/j.issn.1000-2286.2009.05.025 [8] 徐雯佳, 刘璟琪, 马泽清, 等. 江西千烟洲不同恢复途径下白栎种群生物量[J]. 应用生态学报, 2008, 19(3):459-466. [9] 蔡 杰, 张 挺, 刘 成, 等. 野生植物种子采集技术规范[J]. 植物分类与资源学报, 2013, 35(3):22-24. [10] 李合生. 植物生理生化实验原理和技术[M]. 北京: 高等教育出版社, 2000. [11] 魏 红, 钟红舰, 汪 红. 索氏抽提法测定粗脂肪含量的改进[J]. 中国油脂, 2004, 29(6):37-38. doi: 10.3321/j.issn:1003-7969.2004.06.011 [12] 钟冬莲, 韩素芳, 丁 明. 分光光度法测定西红柿中总黄酮含量的方法比较[J]. 食品科学, 2009, 30(22):272-274. doi: 10.3321/j.issn:1002-6630.2009.22.063 [13] 王晶英, 敖 红, 张 杰, 等. 植物生理生化实验技术与原理[M]. 哈尔滨: 东北林业大学出版社, 2003. [14] 朱 弘, 朱淑霞, 李涌福, 等. 尾叶樱桃天然种群叶表型性状变异研究[J]. 植物生态学报, 2018, 42(12):1168-1178. doi: 10.17521/cjpe.2018.0196 [15] 何庆海, 杨少宗, 李因刚, 等. 枫香树种群种子与果实表型性状变异分析[J]. 植物生态学报, 2018, 42(7):752-763. doi: 10.17521/cjpe.2017.0229 [16] 李洪果, 陈达镇, 许靖诗, 等. 濒危植物格木天然种群的表型多样性及变异[J]. 林业科学, 2019, 55(4):69-83. doi: 10.11707/j.1001-7488.20190408 [17] 王明庥. 林木遗传育种学[M]. 北京: 中国林业出版社, 2001. [18] Milošević T, Milošević N, Glišić I, et al. Characteristics of promising apricot (Prunus armeniaca L) genetic resources in Central Serbia based on blossoming period and fruit quality[J]. Horticultural Science, 2010, 37(2): 46-55. doi: 10.17221/67/2009-HORTSCI [19] Mratinić E, Popovski B, Milošević T, et al. Analysis of morphological and pomological characteristics of apricot germplasm in FYR Macedonia[J]. Journal of Agricultural Science and Technology, 2011, 13(4): 1121-1134. [20] Yu H, Liang D, Tian E, et al. Plant geographic phenotypic variation drives diversification in its associated community of a phytophagous insect and its arasitoids[J]. Evolutionary Biology, 2018, 18(1): 134-145. [21] Pinsky M L, Palumbi S R. Meta-analysis lower genetic diversity in overfished populations[J]. Molecular Ecology, 2014, 23(1): 29-39. doi: 10.1111/mec.12509 [22] Soares M P, Weiss G. The Iron age of host-microbe interactions[J]. EMBO Reports, 2015, 16(11): 1482-1500. doi: 10.15252/embr.201540558 [23] 乔 谦, 丰 震, 任红剑, 等. 元宝枫天然种群种实表型多样性[J]. 生态学杂志, 2017, 36(10):2707-2715. [24] 王旭军, 张日清, 许忠坤, 等. 红榉不同种源种子形态性状变异[J]. 中南林业科技大学学报, 2015, 35(1):1-7. [25] 厉月桥, 李迎超, 吴志庄. 不同种源蒙古栎种子表型性状与淀粉含量的变异分析[J]. 林业科学研究, 2013, 26(4):528-532. doi: 10.3969/j.issn.1001-1498.2013.04.022 [26] 方 芳, 彭祚登, 赵 静. 不同种源栓皮栎种子综合性状变异分析[J]. 东北林业大学学报, 2013, 41(8):1-3. doi: 10.3969/j.issn.1000-5382.2013.08.001 [27] 张元燕, 虞木奎, 方炎明. 麻栎不同种源的表型性状变异分析[J]. 植物资源与环境学报, 2014, 23(3):36-44. doi: 10.3969/j.issn.1674-7895.2014.03.05 [28] 童跃伟, 唐 杨, 陈 红, 等. 红松种子园种群的表型多样性研究[J]. 生态学报, 2019, 23(17):1-8. [29] 林 玲, 王军辉, 罗 建, 等. 砂生槐天然群体种实性状的表型多样性[J]. 林业科学, 2014, 50(4):137-143. [30] 江锡兵, 龚榜初, 刘庆忠, 等. 中国板栗地方品种重要农艺性状的表型多样性[J]. 园艺学报, 2014, 41(4):641-652. [31] 许晓岗, 吴秀萍, 丁芳芳. 垂珠花自然居群表型性状及遗传多样性分析[J]. 西北植物学报, 2017, 37(8):1517-1524. doi: 10.7606/j.issn.1000-4025.2017.08.1517 [32] 肖 遥, 麻文俊, 易 飞, 等. 滇楸种质生长性状遗传变异及表型性状遗传多样性分析[J]. 植物研究, 2018, 38(6):843-851. doi: 10.7525/j.issn.1673-5102.2018.06.007 [33] 傅巧娟, 李春楠, 赵福康, 等. 7种兰属种质表型性状遗传多样性分析[J]. 分子植物育种, 2018, 16(10):3381-3394. [34] 李 娜, 赵文恩, 李 勇. 橡实利用研究进展[J]. 中国野生植物资源, 2016, 35(2):45-50. doi: 10.3969/j.issn.1006-9690.2016.02.013 [35] 尹明宇, 姜仲茂, 朱绪春, 等. 内蒙古山杏种群表型变异[J]. 植物生态学报, 2016, 40(10):1090-1099. doi: 10.17521/cjpe.2016.0172 [36] 柳江群, 尹明宇, 左丝雨, 等. 长柄扁桃天然种群表型变异[J]. 植物生态学报, 2017, 41(10):1091-1102. [37] 李因刚, 柳新红, 马俊伟, 等. 浙江楠种群表型变异[J]. 植物生态学报, 2014, 38(12):1315-1324. [38] Srikanta D K G, Ullasa K. Plant and animal reproductive strategies: Lessons from offspring size and number tradeoffs[J]. Frontiers in Ecology and Evolution, 2017, 5(2): 38-48. -

 点击查看大图
计量
- 文章访问数: 4728
- HTML全文浏览量: 2945
- PDF下载量: 84
- 被引次数: 0


