

-
生态化学计量学综合生物学、化学和物理学的基本原理,利用生态过程中多重化学元素的平衡关系,为研究C、N、P等营养元素在生态系统过程中的耦合关系提供了一种综合方法,能更好地解释生态系统各组分(植物、土壤等)养分比例的调控机制[1-2]。土壤作为植物立地和生长的基础,为植物生长发育提供所需的养分,其C、N、P含量调控着植物的生长,并影响植物群落的组成、结构和功能[3-4]。作为植物光合作用的主要器官,叶片与土壤元素之间作用密切,叶片的养分含量状况较好地反映了土壤养分的供给能力[5]。研究植物叶片与其生境土壤营养元素的生态化学计量特征,对于揭示植物对营养元素的需求和土壤的养分供给能力以及植物对环境的适应性都具有重要的意义[6]。
目前,一些学者对较大尺度下不同群落或树种的植物-土壤的化学计量特征进行了研究,表明不同森林类型或树种的植物-土壤C、N、P化学计量相关性存在差异[7];一些学者对不同林龄、立地条件植物-土壤化学计量的变化特征进行研究,探讨了植物在不同发育阶段或不同环境下的养分限制因素和养分利用的策略[8-9];但鲜有研究关注同一植物不同品种叶片-土壤化学计量的变化特征。榧树(Torreya grandis Fort. et Lindl.)为常绿乔木,雌雄异株,是我国榧属(Torreya Arn.)植物中最重要的一种。目前,对榧树资源的分布[10]、种群结构与动态[11]等研究较深入,更多研究集中于香榧(T. grandis cv. ‘Merrilli’)的栽培技术管理[12]、林地养分[13]等。大多数榧树处于野生状态,其种内性状变异复杂,有很多自然变异类型(如圆榧(T. grandis cv. ‘Dielsii’)、芝麻榧、米榧等);但目前对榧树品种的研究较少,对不同品种榧树生态化学计量特征的研究更欠缺。本文以浙江诸暨香榧国家森林公园百年以上不同品种雌榧树(实生雌榧树(圆榧)、嫁接的雌榧树香榧)以及实生雄榧树为研究对象,探讨品种差异对榧树C、N、P生态化学计量特征的影响,以期为提高榧树林地养分利用率以及经营管理提供科学依据。
-
研究地位于浙江省诸暨市赵家镇宣家村的香榧国家森林公园(29°21′~29°59′ N,119°53′~120°32′ E),该地区属于亚热带季风气候,四季分明,雨水丰沛,日照充足,年平均气温16.3℃,年平均降水量约1 373.6 mm,年平均日照时数约1 887.6 h。研究区属于低山丘陵地貌,土壤类型为微酸性红壤。诸暨香榧国家森林公园为国内规模最大的香榧古树聚集地,树龄100 a以上的榧树达4 200多株,500 a以上的古树1 600余株,1 000 a以上的古树200余株,以雌株为主。
-
2018年9月中旬,通过查阅资料、农户访问和实地调查,分别选取环境因子基本一致、树龄300 a左右的实生雌榧树(实生结果圆榧)、雄榧树(实生不结果)和香榧(嫁接的榧树)各6株,共18棵样株为研究对象,对样株胸径、树高等基本特征进行测定,同时在树冠东、南、西、北4个方位和上、中、下3个部位采集适量针叶,每个样株采集的针叶均匀混合后装入袋中,带回实验室。同时在离开树体50~100 cm的树冠下(东、南、西、北4个方位),随机挖取4个土壤剖面(避开粗根系),分别采集0~20、20~40、40~60 cm土层土样,去掉可见植物根系、残体和碎石,分别标号后带回实验室,自然风干备用。所有调查样株分布在半径为500 m的范围内,以保证环境因子基本一致,试验具有可比性[14]。样地基本情况见表1。
表 1 样地基本情况
Table 1. General information of sample plots
品种
Varieties平均胸径
Mean DBH/cm平均树高
Height/m平均坡度
Slop/(°)平均海拔
Altitude/m经营状况
Management situation分布
Distribution香榧 T. grandis cv.‘Merrilli’ 98.2 11 18 543 3月地表撒施化肥(N:P2O5:K2O比例15%:15%:15%),9月地表撒施化肥和有机肥,每年化肥总施用量为0.7 kg·m−2,有机肥总施用量为7.5 kg·m−2,垦覆深度30 cm 单株分布 圆榧 T. grandis cv. ‘Dielsii’ 70.1 19 30 496 除采果用于育苗外,无人为经营 单株分布 雄榧树 Male T. grandis 74.3 16 25 477 无人为经营 单株分布 -
将采集的榧树针叶105℃杀青,60℃烘干后磨碎,备用;自然风干后的土样分别过2.00、0.25、0.15 mm筛,备用。土壤有机碳(SOC)和针叶全碳(LTC)含量采用重铬酸钾外加热法测定;土壤全氮(STN)用浓硫酸消煮,采用凯氏定氮法测定;土壤全磷(STP)用H2SO4-HClO4消煮,钼锑抗比色法测定。植物样品首先用H2SO4-H2O2消煮,之后针叶全氮(LTN)用凯氏定氮法测定,针叶全磷(LTP)用钼锑抗比色法测定[15]。
-
试验数据用Microsoft Office Excel 2010进行初步整理,采用SPSS 22.0软件进行单因素方差分析(One-way ANOVA)、双因素方差分析(Two-way ANOVAs)和多重比较(LSD),显著性水平设为0.05。
-
由双因素方差分析(表2)可知:品种对STP含量影响极显著,品种和土层间的交互作用极显著影响STP。从表3可见:0~20 cm土层香榧SOC、STN含量最高,20~40 cm和40~60 cm土层圆榧SOC、STN含量最高。香榧不同土层STP(2.9、1.5、0.9 g·kg−1)含量均显著高于圆榧和雄榧树。整体上,圆榧和雄榧树SOC、STN和STP含量均无显著差异。
表 2 品种和土层对榧树土壤和针叶C、N、P含量及化学计量的方差分析
Table 2. The correlation between each element in leaves, breaches, and roots of T. grandis
项目
Item因素
FactorsF(P) C N P C:N C:P N:P 土壤 Soil 品种 Varieties 2.312 (0.111) 2.529 (0.091) 75.492 (< 0.001) 4.430 (0.018) 44.488 (< 0.001) 54.018 (< 0.001) 土层 Layers 28.135 (< 0.001) 29.258 (< 0.001) 22.301 (< 0.001) 2.001 (0.147) 0.001 (0.999) 0.669 (0.517) 品种+土层 Varieties+Layers 0.867 (0.491) 1.118 (0.360) 10.871 (< 0.001) 1.430 (0.240) 0.047 (0.996) 0.242 (0.913) 针叶 Leave 品种 Varieties 7.415 (0.006) 7.596 (0.005) 0.568 (0.578) 12.704 (< 0.001) 0.872 (0.438) 3.753 (0.048) 表 3 榧树不同土层的C、N、P含量
Table 3. Content of C, N and P of the various soil layers of T. grandis
项目 Item 土层 Layers/cm 香榧 T. grandis cv. ‘Merrilli’ 圆榧 T. grandis cv. ‘Dielsii’ 雄榧树 Male T. grandis 0~20 26.4 ± 3.5 Aa 24.9 ± 3.4 Aa 24.9 ± 7.4 Aa SOC/(g·kg−1) 20~40 16.2 ± 5.2 Ab 19.2 ± 4.8 Ab 14.0 ± 5.8 Ab 40~60 11.6 ± 4.2 Bb 16.8 ± 2.5 Ab 11.2 ± 6.6 Bb 0~20 2.4 ± 0.3 Aa 2.3 ± 0.4 Aa 2.2 ± 0.6 Aa STN/(g·kg−1) 20~40 1.4 ± 0.6 Ab 1.7 ± 0.3 Ab 1.4 ± 0.5 Ab 40~60 1.0 ± 0.4 Bb 1.6 ± 0.2 Ab 1.2 ± 0.5 ABb 0~20 2.9 ± 0.8 Aa 0.6 ± 0.3 Ba 0.6 ± 0.1 Ba STP/(g·kg−1) 20~40 1.5 ± 0.6 Ab 0.5 ± 0.3 Ba 0.3 ± 0.1 Bb 40~60 0.9 ± 0.3 Ab 0.4 ± 0.2 Ba 0.3 ± 0.1 Bb 注:同行不同大写字母代表不同品种榧树间差异显著(p < 0.05),同列不同小写字母代表同一品种不同土层间差异显著(p < 0.05)。下同。
Notes: Different capital letters in the same line indicate significant difference among different varieties at 0.05 level, and different lowercase letters in the same row indicate significant difference among different layers at 0.05 level. The same as below.由表2可见,土壤深度极显著影响SOC、STN、STP。从不同土层(表3)可知:各土层SOC含量为11.2~26.4 g·kg−1,STN含量为1.0~2.4 g·kg−1,STP含量为0.3~2.9 g·kg−1,SOC、STN和STP含量均表现为0~20 cm土层 > 20~40 cm土层 > 40~60 cm土层,随着土层的加深含量逐渐减小。
从表4可见:香榧、圆榧和雄榧树三者C:P整体表现为圆榧 > 雄榧树 > 香榧,香榧C:P(9.6、11.3、12.3)和N:P(0.9、0.9、1.1)显著低于圆榧和雄榧树。由双因素方差分析(表2)可知:品种对C:N影响显著,极显著影响C:P、N:P,而品种和土层交互作用下化学计量比保持稳定。
表 4 不同品种榧树不同土层的C、N、P化学计量变化
Table 4. Content of C, N and P of the various soil layers of T. grandis
项目 Item 土层 Layers/cm 香榧 T. grandis cv. ‘Merrilli’ 圆榧 T. grandis cv.‘Dielsii’ 雄榧树 Male T. grandis C:N 0~20 10.8 ± 0.6 Aa 10.8 ± 0.8 Aa 11.0 ± 1.0 Aa 20~40 12.6 ± 3.6 Aa 11.0 ± 1.5 Aa 9.9 ± 1.4 Aa 40~60 11.3 ± 0.4 Aa 10.3 ± 0.9 Aa 8.7 ± 2.3 Ba C:P 0~20 9.6 ± 2.6 Ba 50.8 ± 21.9 Aa 44.2 ± 9.0 Aa 20~40 11.3 ± 2.7 Ba 49.3 ± 20.6 Aa 43.9 ± 12.1 Aa 40~60 12.3 ± 1.4 Ba 49.3 ± 15.8 Aa 43.4 ± 13.6 Aa N:P 0~20 0.9 ± 0.2 Ba 4.7 ± 2.0 Aa 4.0 ± 0.5 Aa 20~40 0.9 ± 0.1 Ba 4.6 ± 2.1 Aa 4.4 ± 0.9 Aa 40~60 1.1 ± 0.1 Ba 4.8 ± 1.5 Aa 5.0 ± 1.2 Aa 从不同土层(表4)可知:各土层C:P为9.6~50.8,C:N为8.7~12.6,N:P为0.9~5.0。C:N、C:P和N:P比在不同土层的空间变异性小。土层深度对化学计量比均无显著影响,土层深度和品种交互作用对土壤化学计量特征也无显著影响(表2)。
-
从图1可知:香榧针叶LTC、LTN含量分别为533.0、18.5 g·kg−1,圆榧针叶LTC、LTN含量分别为502.8、23.2 g·kg−1,雄榧树针叶LTC、LTN含量分别为502.7、23.2 g·kg−1。香榧LTC含量显著高于圆榧和雄榧树,LTN含量显著低于雄榧树圆榧和雄榧树,而圆榧和雄榧树LTC、LTN含量差异均不显著。3种榧树LTP含量分别为2.0、1.9、2.1 g·kg−1,差异不显著。由方差分析(表2)可知:品种对榧树LTC和LTN含量影响显著,对C:N影响极显著。
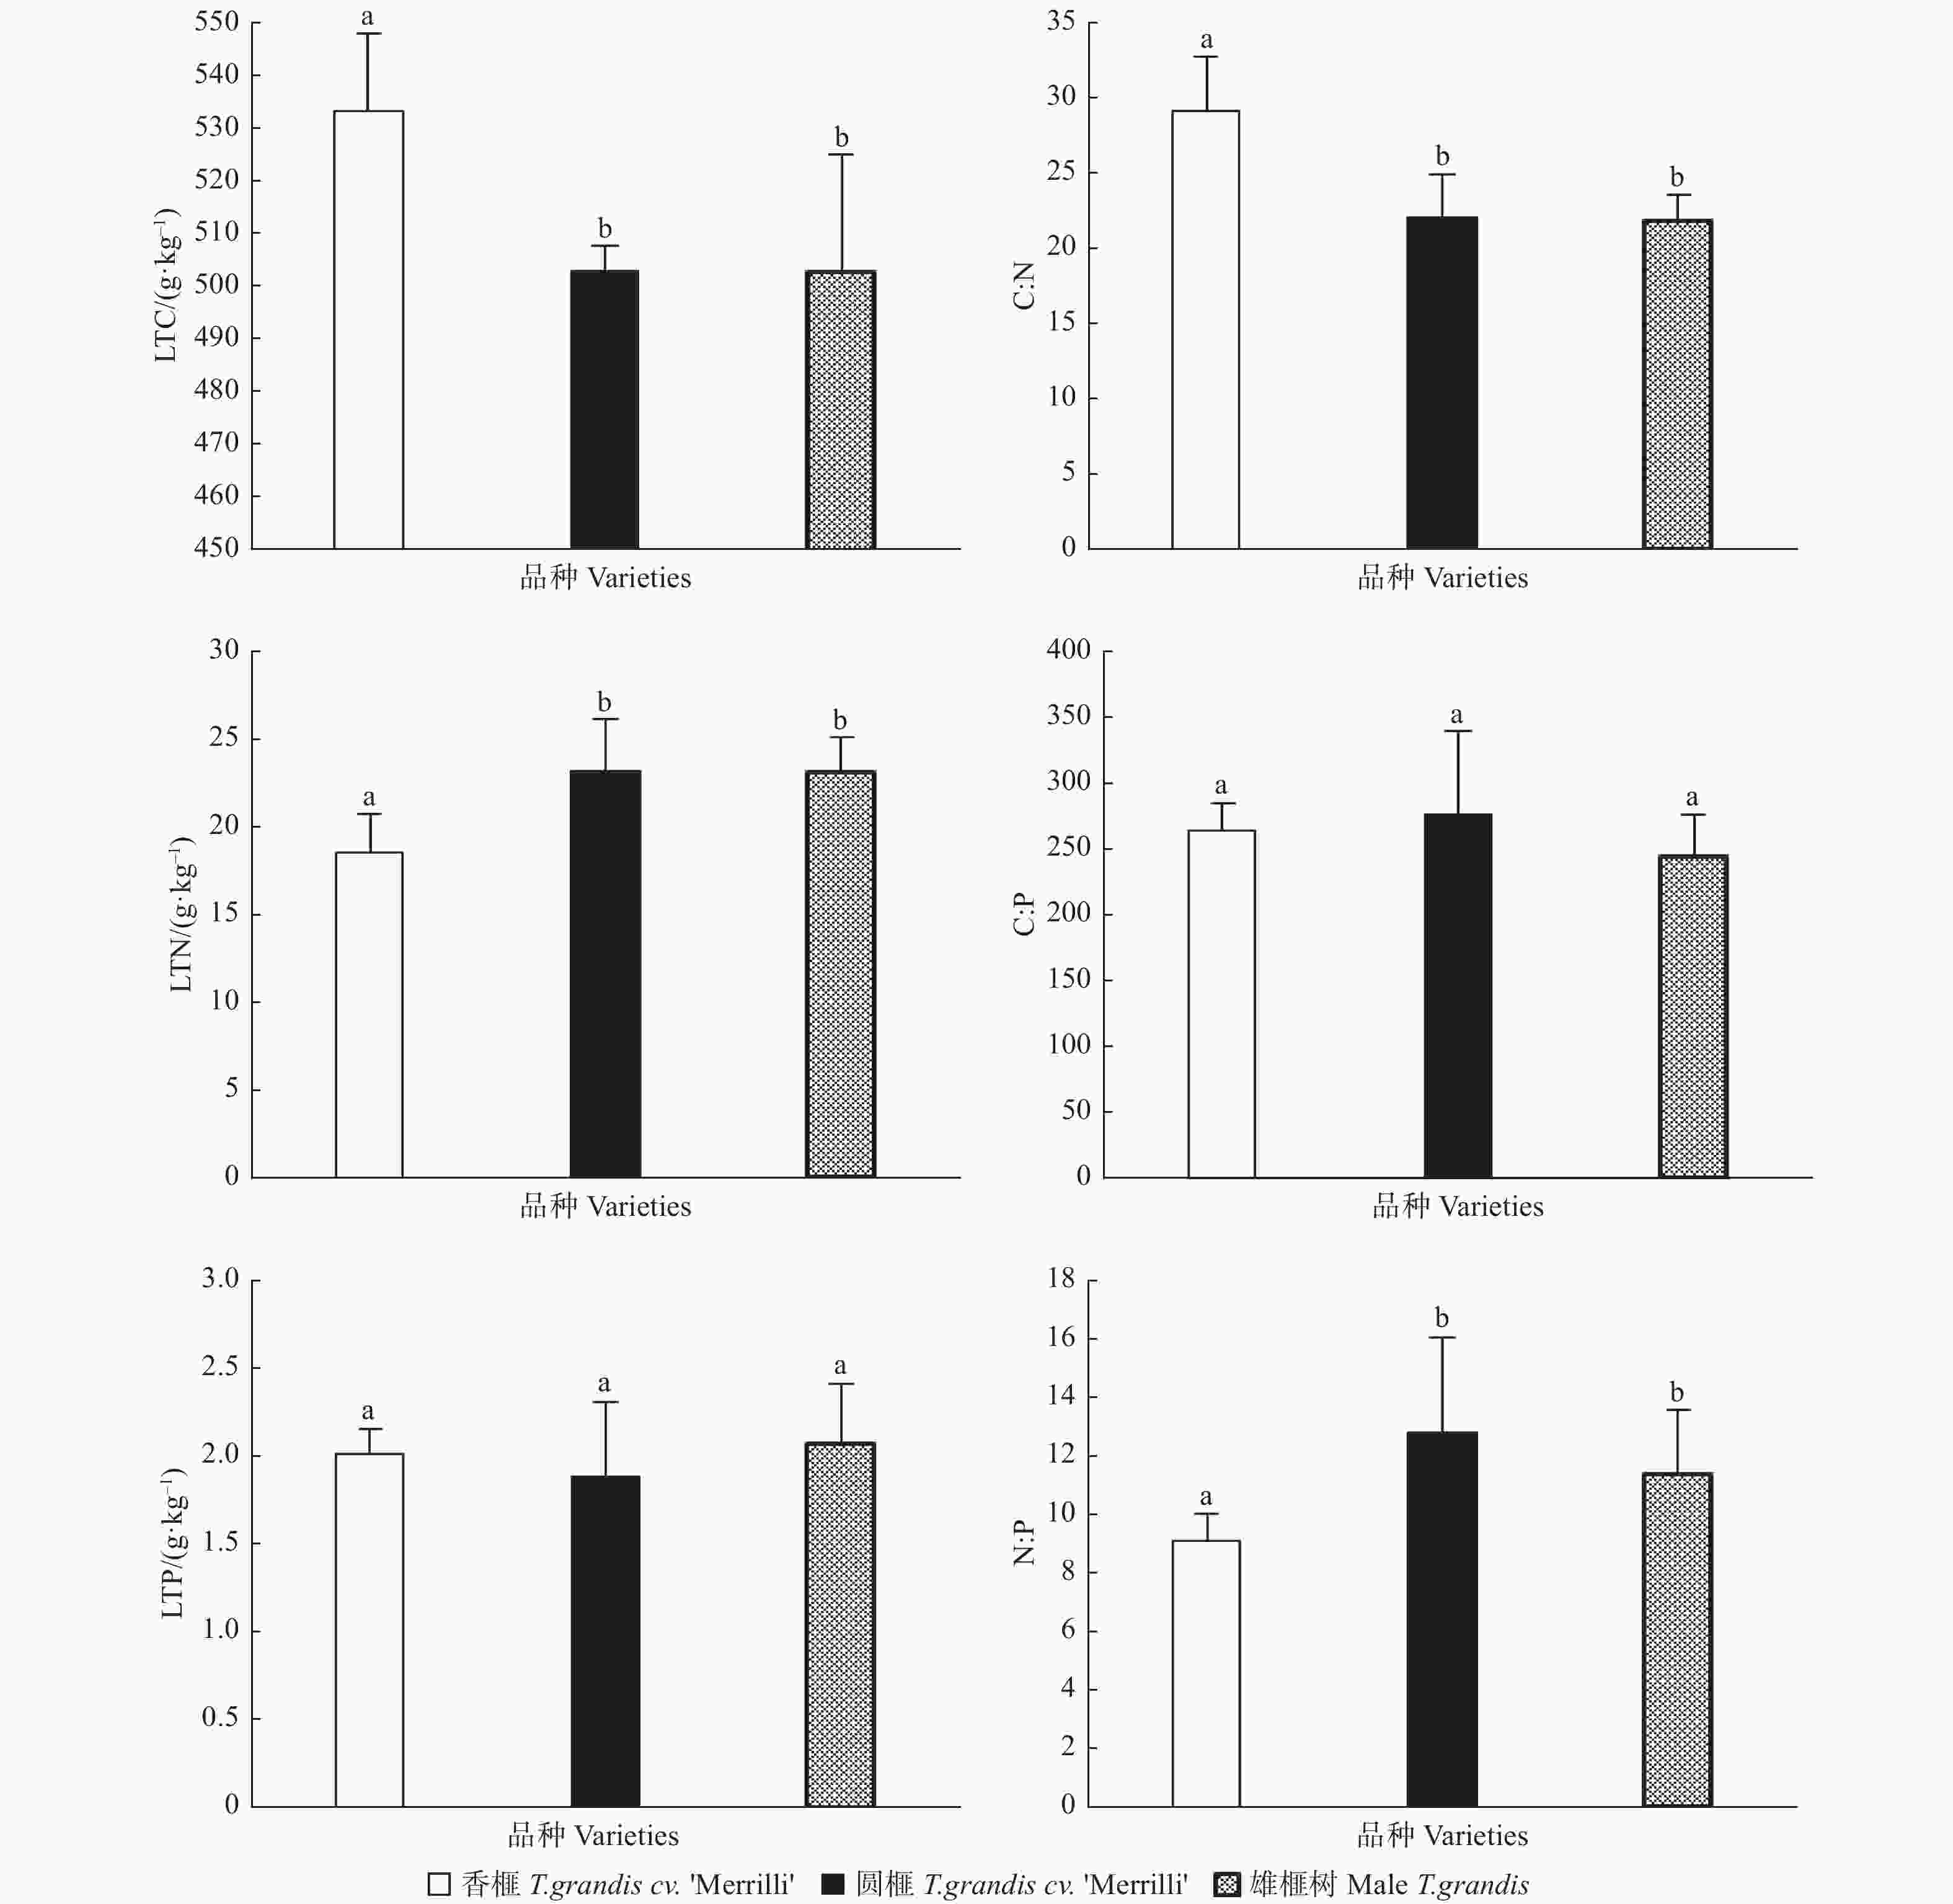
图 1 不同品种榧树针叶C、N、P含量及化学计量变化
Figure 1. The Stoichiometric Characteristics of C, N, and P in leaves of different varieties of T. grandis
香榧针叶C:N、N:P分别为29.2、9.1,圆榧C:N、N:P分别为22.0、12.8,雄榧树C:N、N:P分别为21.6、11.4。香榧针叶C:N显著高于圆榧和雄榧树,与LTC含量变化趋势一致;香榧针叶N:P显著低于圆榧和雄榧树,与LTN含量变化一致。3种榧树C:P分别为264.0、277.3、245.3,差异不显著。
-
从相关分析结果(表5)可知:香榧LTN与不同土层SOC、STN和STP均呈负相关关系,相关系数为−0.631~−0.327;LTP与0~20 cm土层STN显著负相关,相关系数为−0.836。整体上,榧树LTC、LTN、LTP与土壤SOC、STN、STP呈不显著相关。
由表6可知:仅圆榧针叶C:N与土壤40~60 cm土层的C:N显著相关,相关系数为0.883。整体上,不同品种榧树针叶C:N、C:P、N:P和土壤C:N、C:P、N:P呈不显著相关。
表 5 榧树针叶与土壤C、N、P含量的相关性
Table 5. The correlation between each element in leaves and soil of T. grandis
土层
Layers/cm项目
Item香榧 T.grandis cv. ‘Merrilli’ 圆榧 T.grandis cv.‘Dielsii’ 雄榧树 Male T. grandis LTC LTN LTP LTC LTN LTP LTC LTN LTP 0~20 SOC 0.717 −0.342 −0.696 −0.311 −0.497 −0.673 −0.451 −0.032 0.080 STN 0.491 −0.535 −0.836* 0.053 −0.260 −0.786 −0.299 0.055 0.225 STP 0.012 −0.538 −0.412 0.748 −0.253 0.005 0.039 0.359 0.170 20~40 SOC 0.146 −0.631 −0.295 0.284 −0.567 −0.515 −0.049 0.638 −0.128 STN −0.204 −0.450 −0.479 −0.102 −0.641 −0.534 0.135 0.671 0.030 STP −0.137 −0.445 −0.401 0.758 0.049 −0.166 0.341 0.588 0.005 40~60 SOC 0.244 −0.401 −0.462 −0.053 −0.319 −0.299 0.279 0.628 −0.127 STN 0.203 −0.364 −0.425 −0.107 0.219 −0.474 0.484 0.648 −0.044 STP 0.223 −0.327 −0.547 0.823* 0.118 −0.163 0.579 0.537 0.022 注:* p < 0.05。下同。
Note:* p <0.05.The same as below.表 6 榧树针叶与土壤C:N、C:P、N:P比相关性分析
Table 6. The correlation between C:N, C:P, N:P in leaves and soil of T. grandis
土层
Layers/cm项目
Item针叶 Leaf 香榧 T. grandis cv. ‘Merrilli’ 圆榧 T. grandis cv.‘Dielsii’ 雄榧树 Male T. grandis’ C:N C:P N:P C:N C:P N:P C:N C:P N:P 土壤
Soil0~20 C:N −0.192 0.084 0.306 0.317 −0.398 −0.495 −0.361 0.258 0.286 C:P −0.224 0.169 0.368 −0.261 0.438 0.475 −0.232 −0.062 0.018 N:P −0.232 0.169 0.370 −0.311 0.480 0.537 −0.186 −0.262 −0.130 20~40 C:N 0.315 −0.157 −0.482 0.209 0.258 0.101 −0.697 0.470 0.593 C:P 0.382 −0.072 −0.497 0.203 0.459 0.272 −0.693 0.215 0.417 N:P 0.081 0.402 0.207 0.079 0.381 0.272 −0.588 0.003 0.230 40~60 C:N 0.238 0.275 −0.152 0.883* −0.113 −0.537 −0.413 0.099 0.209 C:P 0.444 −0.050 −0.517 0.180 0.245 0.109 −0.596 0.241 0.382 N:P 0.324 −0.107 −0.403 −0.071 0.248 0.239 −0.568 0.348 0.468 -
土壤C、N、P化学计量特征不仅反映土壤系统功能的变异性,且是土壤有机质构成、土壤质量状况和养分供给能力的重要表现指标[16]。本研究中,3种榧树0~20、20~40 cm土层SOC含量无显著差异,香榧40~60 cm土层SOC、STN含量显著低于圆榧。这可能是因为香榧林地长期施复合肥,一定程度上对土壤结构造成破坏作用,从而减小了土壤深层的总有机碳含量[17],且香榧林地的垦覆、锄草等人为管理,造成土壤的严重搅动,翻耕使得土壤有机质充分暴露在有氧环境中,促使土壤矿物质化,从而导致更多的C、N的排放。香榧和圆榧0~20 cm土层SOC、STN含量显著高于20~40、40~60 cm土层,与吕金林等[18]研究报道一致。土壤P素作为一种沉积的矿质,在土壤中的迁移率很低,全磷的垂直变化较稳定[19]。香榧各土层STP含量均显著高于圆榧和雄榧树,P元素供应充足,这可能是因为香榧林地长期施入磷肥,导致香榧土壤C:P和N:P显著低于圆榧和雄榧树。
香榧、圆榧和雄榧树土壤C:N较C:P、N:P稳定,这与C、N元素含量对同一环境因素变化的响应基本同步有关,作为结构性成分,二者的积累和消耗过程存在相对稳定的比值[20]。除40~60 cm土层香榧和圆榧C:N显著高于雄榧树外,香榧、圆榧和雄榧树其他土层的C:N均无显著差异,一定程度上反映出不同品种榧树土壤氮素矿化能力与有机质的分解速率相近;同时,表层土壤C:N能够很好地指示土壤供N状况[21]。本研究结果表明,香榧、圆榧和雄榧树土壤N供应能力基本一致,较高的C:P是P有效性低的一个指标[22],香榧、圆榧和雄榧树土壤C:P和N:P均表现为圆榧 > 雄榧树 > 香榧,且圆榧和雄榧树N:P也显著高于香榧,表明二者土壤可利用P低,与其STP含量少表现一致。出现这种现象的原因可能是研究区凋落物较少且岩石风化过程漫长,P元素积累缓慢。
-
本研究中,香榧LTC含量显著高于圆榧和雄榧树,这与C在多数植物体内含量很高且变异较小不一致[23],这可能因为研究地对香榧的施肥、除草等人为经营,有利于植物的光合作用,从而固定更多的C。香榧LTN含量显著低于圆榧,与陈佳妮等[24]报道香榧LTN含量高于榧树的结果不同,研究结果的差异可能因为试验的时间不同,其研究选择在4—5月榧树开花后,而本研究在榧树果实成熟的9月,更多的N用于果实生长发育。香榧深层的STN含量显著低于圆榧也可能是造成该现象的原因。植物P含量一方面反映了植物对P元素的利用效率,另一方面反映土壤P元素的供应能力[25]。3种榧树LTP含量表现为雄榧树 > 香榧 > 圆榧,这与香榧林地STP含量显著高于圆榧和雄榧树表现并不一致。有研究认为,林地N肥施入促进土壤磷酸酶活性,进而提高土壤中植物可利用性P含量[26],进而有利于植物对P的吸收,增加植物P含量;然而,香榧林地P含量显著高于圆榧和雄榧树,而香榧LTP含量与圆榧和雄榧树并无显著差异,这可能是植物的生物增长速率大于植物P元素吸收速率时,会产生“生物量稀释作用”,植物叶片P含量表现为无显著变化甚至减少[27-28]。
叶片C:N和C:P一定程度能反映植物的养分利用效率[29]。香榧针叶C:N显著高于圆榧和雄榧树,且C:P也较高,说明香榧有较高的养分利用效率。很多研究将植物叶片N:P比作为限制因子判断的指标,N:P < 14受N限制,N:P > 16受P限制,位于二者中间N、P共同限制或均不限制[30]。本研究中,3种榧树N:P分别为9.1、12.8和11.4,小于受N限制的阈值(14.0)。土壤是陆地植物生长最重要的基质,其N:P可用作N饱和的诊断指标,并常被用于确定养分限制的阈值[31]。本研究中,3种榧树土壤N:P远小于14.0,造成香榧土壤N:P小的主要原因是STP含量高,因此,单纯靠阈值判断植物养分限制存在局限性,更应结合林地实际情况。
-
诸多研究表明,叶片的养分含量状况能较好地反应土壤养分的供给能力,植物叶片与土壤C、N、P含量及化学计量比有一定的相关性。李喜霞等对红松(Pinus koraiensis Sieb. et Zucc.)林的研究表明,LTN、LTP含量与STN、STP显著相关(p <0.05)[32];邓成华等[33]研究发现,油茶(Camellia oleifera Abel.)LTP含量与STP含量显著正相关,且土壤C:N、C:P、N:P与叶片C:N、C:P呈显著正相关,叶片N:P与土壤C:P、N:P呈显著正相关(p < 0.05);顾大形等[34]对四季竹(Oligostachyum lubricum (Wen) King f.)的研究表明,STN含量分别与LTN含量、叶片N:P呈极显著正相关(p < 0.01)。这与土壤为植物提供生长所需养分,植物通过光合作用,然后以植物残体的形式返还给土壤有很强的关系[35];但也有一些研究表明,植物-土壤C、N、P化学计量特征相关性较小。靖磊等[36]对杨树(Populus spp.)的研究表明,LTC、LTN、LTP含量及其比值与土壤之间相关关系并不显著;姜沛沛等对刺槐(Robinia pseudoacacia L.)、辽东栎(Quercus liaotungensis Koidz.)的研究中发现,LTN、LTP含量与STN、STP含量均无显著关系,且环境因子对叶片和土壤N、P影响较大[37]。本研究中,榧树LTC、LTN和LTP含量以及化学计量特征与STC、STN、STP含量及化学计量特征的相关关系并不显著,这可能因为当地榧树树龄较大,植物有较强的内稳性。本研究结果与姜沛沛等[37]、张藤子等[8]发现油松(P. tabulaeformis Carr.)植物养分与土壤养分含量及化学特征相关关系较弱的结果一致。
-
本研究中,实生榧树圆榧和雄榧树针叶-土壤化学计量特征均无差异,雌雄异株对实生榧树化学计量特征无显著影响;香榧林地土壤P含量显著高于圆榧和雄榧树,施肥等人为经营管理对榧树林地土壤P含量影响较大。榧树针叶-土壤C、N、P含量及化学计量相关关系较弱。
不同品种榧树针叶-土壤C、N、P生态化学计量特征研究
Stoichiometric Characteristics of C, N and P in Leaves of Torreya grandis Varieties and Soils
-
摘要:
目的 探讨品种对榧树针叶-土壤化学计量的影响,为榧树的合理经营管理提供科学依据。 方法 以浙江诸暨树龄300 a左右的不同品种雌榧树(实生雌榧树圆榧、嫁接良种香榧)和实生雄榧树为研究对象,通过野外采集不同品种榧树针叶样品及0~20、20~40、40~60 cm土层土壤样品,分析不同品种榧树针叶-土壤C、N、P含量及化学计量特征变化。 结果 (1)圆榧和雄榧树叶片-土壤C、N、P化学计量特征均无显著差异,雌雄异株对榧树化学计量特征无显著影响;(2)香榧、圆榧和雄榧树土壤有机碳(SOC)、土壤全氮(STN)含量差异不显著,0~20 cm土层香榧SOC、STN含量最高,20~40、40~60 cm土层圆榧SOC、STN含量最高;香榧0~20、20~40、40~60 cm土层土壤全磷(STP)含量(2.9、1.5、0.9 g·kg−1)均显著高于圆榧和雄榧树;(3)香榧、圆榧和雄榧树土壤C:N较C:P、N:P稳定,香榧C:P、N:P显著低于圆榧和雄榧树;(4)香榧针叶全碳(LTC)含量(533.0 g·kg−1)显著高于圆榧(502.8 g·kg−1)和雄榧树(502.7 g·kg−1),C:N与LTC含量变化趋势一致;香榧针叶全氮(LTN)含量(18.5 g·kg−1)显著低于圆榧(23.2 g·kg−1)和雄榧树(23.2 g·kg−1),N:P与LTN含量变化趋势一致;(5)整体上榧树针叶和土壤C、N、P含量及化学计量相关性不显著。 结论 本研究中,雌雄异株对榧树化学计量特征无显著影响,施肥等人为经营活动对榧树林地土壤P含量影响显著。 Abstract:Objective To examine the effects of cultivar and dioecy on stiochiometry of Torreya grandis and provide data for management of T. grandis stands. Method The female (T. grandis cv. ‘Dielsii’ and T. grandis cv. ‘Merrilli’) and male T. grandis with age of about 300 years were selected from T. grandis National Forest Park in Zhuji of Zhejiang Province. The leaf and soil samples (0-20, 20-40 and 40-60 cm) of different T. grandis species were collected in the field to analyze the C, N, P contents and their stoichiometric characteristics. Result (1) There was no significant difference in C, N, P contents and stoichiometric characteristics between T. grandis cv. ‘Dielsii’ and male T. grandis. Dioecy had no significant effects on the stoichiometry of T. grandis. (2) There was no significant difference in C and N contents among T. grandis. The C and N contents in 0-20 cm soil layer of T. grandis cv. ‘Merrilli’ stand and in 20-40 and 40-60 cm soil layer of T. grandis cv. ‘Dielsii’ stand were the highest. The content of P in soil of T. grandis cv. ‘Merrilli’ stand (2.9, 1.5 and 0.9 g·kg−1) was significantly higher than that in T. grandis cv. ‘Dielsii’ stand and male T. grandis stand. (3) C:N in soil of T. grandis stand were more stable than C:P and N:P. The C:P and N:P in soil of T. grandis cv. ‘Merrilli’ stand was significantly lower than that in T. grandis cv. ‘Dielsii’ and male T. grandis stands. (4) The C content in T. grandis cv. ‘Merrilli’ leaves (533.0 g·kg−1) was significantly higher than that in T. grandis cv. ‘Dielsii’ leaves (502.8 g·kg−1) and male T. grandis leaves (502.7 g·kg−1). The change trend of C:N and C content in leaves was the same. The N content in leaves of T. grandis cv. ‘Merrilli’ (18.5 g·kg−1) was significantly lower than that of T. grandis cv. ‘Dielsii’ s leaves (23.2 g·kg−1) and male T. grandis leaves (23.2 g·kg−1). The change trend of N:P and leaf N content was same. (5) On the whole, there was no significant correlation between C, N, P contents and stoichiometric characteristics in leaves of T. grandis and soils. Conclusion Dioecy of T. grandis shows no significant effect on the stoichiometric characteristics of tree. Fertilization and other management activities have a significant impact on soil P content in soil of T. grandis stand. -
Key words:
- Torreya grandis
- / stoichiometry
- / varieties
- / soil
- / leaves
-
图 1 不同品种榧树针叶C、N、P含量及化学计量变化
Figure 1. The Stoichiometric Characteristics of C, N, and P in leaves of different varieties of T. grandis
表 1 样地基本情况
Table 1. General information of sample plots
品种
Varieties平均胸径
Mean DBH/cm平均树高
Height/m平均坡度
Slop/(°)平均海拔
Altitude/m经营状况
Management situation分布
Distribution香榧 T. grandis cv.‘Merrilli’ 98.2 11 18 543 3月地表撒施化肥(N:P2O5:K2O比例15%:15%:15%),9月地表撒施化肥和有机肥,每年化肥总施用量为0.7 kg·m−2,有机肥总施用量为7.5 kg·m−2,垦覆深度30 cm 单株分布 圆榧 T. grandis cv. ‘Dielsii’ 70.1 19 30 496 除采果用于育苗外,无人为经营 单株分布 雄榧树 Male T. grandis 74.3 16 25 477 无人为经营 单株分布  下载: 导出CSV
表 2 品种和土层对榧树土壤和针叶C、N、P含量及化学计量的方差分析
Table 2. The correlation between each element in leaves, breaches, and roots of T. grandis
项目
Item因素
FactorsF(P) C N P C:N C:P N:P 土壤 Soil 品种 Varieties 2.312 (0.111) 2.529 (0.091) 75.492 (< 0.001) 4.430 (0.018) 44.488 (< 0.001) 54.018 (< 0.001) 土层 Layers 28.135 (< 0.001) 29.258 (< 0.001) 22.301 (< 0.001) 2.001 (0.147) 0.001 (0.999) 0.669 (0.517) 品种+土层 Varieties+Layers 0.867 (0.491) 1.118 (0.360) 10.871 (< 0.001) 1.430 (0.240) 0.047 (0.996) 0.242 (0.913) 针叶 Leave 品种 Varieties 7.415 (0.006) 7.596 (0.005) 0.568 (0.578) 12.704 (< 0.001) 0.872 (0.438) 3.753 (0.048)
下载: 导出CSV
表 3 榧树不同土层的C、N、P含量
Table 3. Content of C, N and P of the various soil layers of T. grandis
项目 Item 土层 Layers/cm 香榧 T. grandis cv. ‘Merrilli’ 圆榧 T. grandis cv. ‘Dielsii’ 雄榧树 Male T. grandis 0~20 26.4 ± 3.5 Aa 24.9 ± 3.4 Aa 24.9 ± 7.4 Aa SOC/(g·kg−1) 20~40 16.2 ± 5.2 Ab 19.2 ± 4.8 Ab 14.0 ± 5.8 Ab 40~60 11.6 ± 4.2 Bb 16.8 ± 2.5 Ab 11.2 ± 6.6 Bb 0~20 2.4 ± 0.3 Aa 2.3 ± 0.4 Aa 2.2 ± 0.6 Aa STN/(g·kg−1) 20~40 1.4 ± 0.6 Ab 1.7 ± 0.3 Ab 1.4 ± 0.5 Ab 40~60 1.0 ± 0.4 Bb 1.6 ± 0.2 Ab 1.2 ± 0.5 ABb 0~20 2.9 ± 0.8 Aa 0.6 ± 0.3 Ba 0.6 ± 0.1 Ba STP/(g·kg−1) 20~40 1.5 ± 0.6 Ab 0.5 ± 0.3 Ba 0.3 ± 0.1 Bb 40~60 0.9 ± 0.3 Ab 0.4 ± 0.2 Ba 0.3 ± 0.1 Bb 注:同行不同大写字母代表不同品种榧树间差异显著(p < 0.05),同列不同小写字母代表同一品种不同土层间差异显著(p < 0.05)。下同。
Notes: Different capital letters in the same line indicate significant difference among different varieties at 0.05 level, and different lowercase letters in the same row indicate significant difference among different layers at 0.05 level. The same as below.
下载: 导出CSV
表 4 不同品种榧树不同土层的C、N、P化学计量变化
Table 4. Content of C, N and P of the various soil layers of T. grandis
项目 Item 土层 Layers/cm 香榧 T. grandis cv. ‘Merrilli’ 圆榧 T. grandis cv.‘Dielsii’ 雄榧树 Male T. grandis C:N 0~20 10.8 ± 0.6 Aa 10.8 ± 0.8 Aa 11.0 ± 1.0 Aa 20~40 12.6 ± 3.6 Aa 11.0 ± 1.5 Aa 9.9 ± 1.4 Aa 40~60 11.3 ± 0.4 Aa 10.3 ± 0.9 Aa 8.7 ± 2.3 Ba C:P 0~20 9.6 ± 2.6 Ba 50.8 ± 21.9 Aa 44.2 ± 9.0 Aa 20~40 11.3 ± 2.7 Ba 49.3 ± 20.6 Aa 43.9 ± 12.1 Aa 40~60 12.3 ± 1.4 Ba 49.3 ± 15.8 Aa 43.4 ± 13.6 Aa N:P 0~20 0.9 ± 0.2 Ba 4.7 ± 2.0 Aa 4.0 ± 0.5 Aa 20~40 0.9 ± 0.1 Ba 4.6 ± 2.1 Aa 4.4 ± 0.9 Aa 40~60 1.1 ± 0.1 Ba 4.8 ± 1.5 Aa 5.0 ± 1.2 Aa
下载: 导出CSV
表 5 榧树针叶与土壤C、N、P含量的相关性
Table 5. The correlation between each element in leaves and soil of T. grandis
土层
Layers/cm项目
Item香榧 T.grandis cv. ‘Merrilli’ 圆榧 T.grandis cv.‘Dielsii’ 雄榧树 Male T. grandis LTC LTN LTP LTC LTN LTP LTC LTN LTP 0~20 SOC 0.717 −0.342 −0.696 −0.311 −0.497 −0.673 −0.451 −0.032 0.080 STN 0.491 −0.535 −0.836* 0.053 −0.260 −0.786 −0.299 0.055 0.225 STP 0.012 −0.538 −0.412 0.748 −0.253 0.005 0.039 0.359 0.170 20~40 SOC 0.146 −0.631 −0.295 0.284 −0.567 −0.515 −0.049 0.638 −0.128 STN −0.204 −0.450 −0.479 −0.102 −0.641 −0.534 0.135 0.671 0.030 STP −0.137 −0.445 −0.401 0.758 0.049 −0.166 0.341 0.588 0.005 40~60 SOC 0.244 −0.401 −0.462 −0.053 −0.319 −0.299 0.279 0.628 −0.127 STN 0.203 −0.364 −0.425 −0.107 0.219 −0.474 0.484 0.648 −0.044 STP 0.223 −0.327 −0.547 0.823* 0.118 −0.163 0.579 0.537 0.022 注:* p < 0.05。下同。
Note:* p <0.05.The same as below.
下载: 导出CSV
表 6 榧树针叶与土壤C:N、C:P、N:P比相关性分析
Table 6. The correlation between C:N, C:P, N:P in leaves and soil of T. grandis
土层
Layers/cm项目
Item针叶 Leaf 香榧 T. grandis cv. ‘Merrilli’ 圆榧 T. grandis cv.‘Dielsii’ 雄榧树 Male T. grandis’ C:N C:P N:P C:N C:P N:P C:N C:P N:P 土壤
Soil0~20 C:N −0.192 0.084 0.306 0.317 −0.398 −0.495 −0.361 0.258 0.286 C:P −0.224 0.169 0.368 −0.261 0.438 0.475 −0.232 −0.062 0.018 N:P −0.232 0.169 0.370 −0.311 0.480 0.537 −0.186 −0.262 −0.130 20~40 C:N 0.315 −0.157 −0.482 0.209 0.258 0.101 −0.697 0.470 0.593 C:P 0.382 −0.072 −0.497 0.203 0.459 0.272 −0.693 0.215 0.417 N:P 0.081 0.402 0.207 0.079 0.381 0.272 −0.588 0.003 0.230 40~60 C:N 0.238 0.275 −0.152 0.883* −0.113 −0.537 −0.413 0.099 0.209 C:P 0.444 −0.050 −0.517 0.180 0.245 0.109 −0.596 0.241 0.382 N:P 0.324 −0.107 −0.403 −0.071 0.248 0.239 −0.568 0.348 0.468
下载: 导出CSV
-
[1] Elser J J, Fagan W F, Denno R F, et al. Nutritional constraints in terrestrial and freshwater food webs[J]. Nature, 2000, 408(6812): 578-580. doi: 10.1038/35046058 [2] Yu Q, Chen Q S, Elser J J, et al. Linking stoichiometric homoeostasis with ecosystem structure, functioning and stability[J]. Ecology Letters, 2010, 13(11): 1390-1399. doi: 10.1111/j.1461-0248.2010.01532.x [3] 阎恩荣, 王希华, 郭 明, 等. 浙江天童常绿阔叶林、常绿针叶林与落叶阔叶林的C:N:P化学计量特征[J]. 植物生态学报, 2010, 34(1):48-57. [4] 刘海霞, 许斌杰, 范新峰, 等. 植物—土壤反馈机制研究综述[J]. 青岛农业大学学报: 自然科学版, 2014, 31(2):142-147. [5] Müller M, Oelmann Y, Schickhoff U, et al. Himalayan treeline soil and foliar C∶N∶P stoichiometry indicate nutrient shortage with elevation[J]. Geoderma, 2017, 291(1): 21-32. [6] 李从娟, 雷加强, 徐新文, 等. 塔克拉玛干沙漠腹地人工植被及土壤C、N、P的化学计量特征[J]. 生态学报, 2013, 33(18):5760-5767. [7] 张 萍, 章广琦, 赵一娉, 等. 黄土丘陵区不同森林类型叶片-凋落物-土壤生态化学计量特征[J]. 生态学报, 2018, 38(14):5087-5098. [8] 张藤子, 李亚楠, 韩飞燕, 等. 辽西两种油松混交林土壤及油松叶片C:N:P化学计量特征[J]. 生态学杂志, 2018, 37(10):196-202. [9] Fan H B, Wu J P, Liu W F, et al. Linkages of plant and soil C:N:P stoichiometry and their relationships to forest growth in subtropical plantations[J]. Plant and Soil, 2015, 392(1/2): 127-138. [10] 程晓建, 黎章矩, 喻卫武, 等. 榧树的资源分布与生态习性[J]. 浙江林学院学报, 2007, 24(4):383-388. [11] 江 波, 周先容, 尚 进, 等. 中国特有植物巴山榧树的种群结构与动态[J]. 生态学报, 2018, 38(3):1016-1027. [12] 方丽梅. 香榧发展前景及其丰产生态栽培技术[J]. 现代农业科技, 2018, 723(13):162-163. [13] 张雨洁, 王 斌, 李正才, 等. 不同树龄香榧土壤有机碳特征及其与土壤养分的关系[J]. 西北植物学报, 2018, 38(8):149-157. [14] 原雅楠, 李正才, 王 斌, 等. 榧树种内C、N、P生态化学计量特征研究[J]. 林业科学研究, 2019, 32(6):73-79. [15] 鲁如坤. 土壤农业化学分析方法[M]. 北京: 中国农业科技出版社, 2000. [16] 曹 娟, 闫文德, 项文化, 等. 湖南会同3个林龄杉木人工林土壤碳、氮、磷化学计量特征[J]. 林业科学, 2015, 51(7):1-8. [17] 张雨洁, 王 斌, 李正才, 等. 施肥措施对古香榧林地土壤活性有机碳和养分的影响[J]. 林业科学研究, 2019, 32(2):91-97. [18] 吕金林, 闫美杰, 宋变兰, 等. 黄土丘陵区刺槐、辽东栎林地土壤碳、氮、磷生态化学计量特征[J]. 生态学报, 2017, 37(10):3385-3393. [19] 刘兴诏, 周国逸, 张德强, 等. 南亚热带森林不同演替阶段植物与土壤中N、P的化学计量特征[J]. 植物生态学报, 2010, 34(1):64-71. [20] Agren G I. Stoichiometry and nutrition of plant growth in natural communities[J]. Annual review of Ecology, Evolution, and Systematics, 2008, 39(1): 153-170. doi: 10.1146/annurev.ecolsys.39.110707.173515 [21] 张春华, 王宗明, 居为民, 等. 松嫩平原玉米带土壤碳氮比的时空变异特征[J]. 环境科学, 2011, 32(5):1407-1414. [22] 赵维俊, 刘贤德, 金 铭, 等. 祁连山青海云杉林叶片—枯落物—土壤的碳氮磷生态化学计量特征[J]. 土壤学报, 2016, 53(2):477-489. [23] Reich P B, Oleksyn J. Global patterns of plant leaf N and P in relation to temperature and latitude[J]. Proceedings of the National Academy of Sciences of the United States of America, 2004, 101(30): 11001-11006. doi: 10.1073/pnas.0403588101 [24] 陈佳妮, 廖 亮, 黄增冠, 等. 香榧与榧树叶片光合特性及其光保护机制的比较[J]. 林业科学, 2015, 51(10):134-141. [25] 杨 幸, 王 平, 高大威, 等. 云南药山自然保护区黄背栎林和巧家五针松林生态化学计量特征[J]. 生态学报, 2019, 39(11):4021-4028. [26] Marklein A R, Houlton B Z. Nitrogen inputs accelerate phosphorus cycling rates across a wide variety of terrestrial ecosystems[J]. New Phytologist, 2012, 193(3): 696-704. doi: 10.1111/j.1469-8137.2011.03967.x [27] Yan Z B, Guan H Y, Han W X, et al. Reproductive organ and young tissues show constrained elemental composition in Arabidopsis thaliana[J]. Annals of Botany, 2016, 117(3): 431-439. doi: 10.1093/aob/mcv190 [28] Zhang Q F, Xie J S, Lyu M K, et al. Short-term effects of soil warming and nitrogen addition on the N:P stoichiometry of Cunninghamia lanceolata, in subtropical regions[J]. Plant and Soil, 2017, 411(1-2): 395-407. doi: 10.1007/s11104-016-3037-4 [29] 刘万德, 苏建荣, 李帅锋, 等. 云南普洱季风常绿阔叶林演替系列植物和土壤C、N、P化学计量特征[J]. 生态学报, 2010, 30(23):6581-6590. [30] Koerselman W, Meuleman A F M. The vegetation N:P ratio: a new tool to detect the nature of Nutrient limitation[J]. Journal of Applied Ecology, 1996, 33(6): 1441-1450. doi: 10.2307/2404783 [31] 朱秋莲, 邢肖毅, 张 宏, 等. 黄土丘陵沟壑区不同植被区土壤生态化学计量特征[J]. 生态学报, 2013, 33(15):4674-4682. [32] 李喜霞, 杜天雨, 魏亚伟, 等. 阔叶红松林生态化学计量学特征及其对纬度梯度的响应[J]. 生态学报, 2018, 38(11):3952-3960. [33] 邓成华, 吴龙龙, 张雨婷, 等. 不同林龄油茶人工林土壤-叶片碳氮磷生态化学计量特征[J]. 生态学报, 2019, 39(24):9152-9161. [34] 顾大形, 陈双林, 黄玉清, 等. 土壤氮磷对四季竹叶片氮磷化学计量特征和叶绿素含量的影响[J]. 植物生态学报, 2011, 35(12):1219-1225. [35] 王维奇, 徐玲琳, 曾从盛, 等. 河口湿地植物活体-枯落物-土壤的碳、氮、磷生态化学计量特征[J]. 生态学报, 2011, 31(23):7119-7124. [36] 靖 磊, 周 延, 吕 偲, 等. 洞庭湖湿地3个林龄杨树人工林叶与土壤碳氮磷生态化学计量特征[J]. 生态学报, 2018, 38(18):6530-6538. [37] 姜沛沛, 曹 扬, 陈云明, 等. 陕西省3种主要树种叶片、凋落物和土壤N、P化学计量特征[J]. 生态学报, 2017, 37(2):443-454. -

 点击查看大图

计量
- 文章访问数: 4308
- HTML全文浏览量: 2845
- PDF下载量: 122
- 被引次数: 0
