


-
我国盐碱地面积约为9 900万公顷,广泛分布在东北、西北、华北及滨海地区[1]。土壤中过量的盐分破坏了植物的生理代谢过程,影响植物正常生长,造成林分衰退甚至大面积森林死亡[2-7]。因此,选育耐盐碱林木种质资源、并鉴别植物耐盐性指标,对改善盐碱地生态环境、减少盐渍化危害具有重要意义[8]。
植物生理形态指标是反映其对盐胁迫适应性的重要参数,是评价其耐盐性的重要依据。然而,植物的耐盐性非常复杂,不同的评价指标会导致不同的结果,因此,需要筛选并寻找相关性较大的指标进行后续耐盐性评价[8]。近年来,对植物耐盐筛选评价的方法主要以相关性分析、主成分分析法和隶属函数法等为主[8-9]。如余如刚等[9]以13 种小白菜(Brassica rapa L. ssp. chinensis)幼苗的单项指标的耐盐系数为依据,运用多种方法综合评价了其耐盐性,并筛选出株高和根干质量2个鉴定指标;Yu等[10]采用多个指标对20个不同紫苜蓿(Medicago sativa L.)品种幼苗的14个性状的耐盐系数进行了分析,发现地上部分鲜质量、地上部分K+/Na+、地上部分干质量、地上部分与地下部分鲜质量比值、根系比表面积和比根体积可作为苜蓿幼苗耐盐性评价指标。Afsar等[11]基于形态生理性状对25份芸芥(Eruca sativa T.)的耐盐性进行了评价并筛选出高耐盐性种质,发现株高、根长、植株高度、叶片数量、叶面积、鲜质量、干质量和光合作用速率是研究种质间变异的最显著性状。Li等[12]对萌发期向日葵(Helianthus annuus L.)种子的耐盐性进行评价,筛选高耐盐性种质30份,并确定发芽指数和发芽活力指数为最可靠的2个性状指标。
本研究以苦楝(Melia azedarach L.)、白榆(Ulmus pumila L.)和刺槐(Robinia pseudoacacia L.)这3个我国常用造林树种幼苗为材料,基于它们对盐胁迫的生理生态响应,采用相关性分析、主成分分析、隶属函数法及灰色关联分析等方法综合评价其耐盐性差异并筛选耐盐性鉴定指标,从而为建立耐盐碱林木种质苗期耐盐性筛选评价体系和耐盐碱林木种质资源选育提供科学参考。
-
参照甘红豪等[13]的方法在中国林业科学研究院科研温室中培养一年生苦楝、白榆和刺槐扦插苗,选取生长健康且株高基本一致(约30 cm)的幼苗进行后续试验。试验共设置0、100、200和300 mmol·L−1 NaCl处理浓度,每个树种每个NaCl浓度10株幼苗。参照甘红豪等[14]的方法进行NaCl处理。
-
NaCl处理30 d后,使用Li 6400光合仪(LI-Cor, Lincoln, Nebraska, USA)测定苦楝、白榆和刺槐幼苗叶片的净光合速率(Pn)、气孔导度(Gs)、胞间CO2 浓度(Ci)和蒸腾速率(E)[13-14]。同时,计算苦楝、白榆和刺槐幼苗叶片WUE=Pn/E,式中WUE为水分瞬时利用效率;并计算Ls= 1−Ci/Ca,式中Ls为气孔限制值,Ca 为空气中 CO2 浓度,本试验中该值为 400 μmol·mol−1 [15]。
然后,分别收获不同NaCl处理下苦楝、白榆和刺槐幼苗的根、茎、叶样品并记录鲜质量。所有材料在液氮中研成粉末,并保存在−80 °C冰箱中备用。称取各NaCl处理组刺槐、苦楝和白榆的根、茎、叶鲜样50 mg左右,在80 °C下烘干后,称其质量、计算干湿比,并以此计算样品干质量。
-
各NaCl处理苦楝、白榆和刺槐幼苗叶片的相对含水量(RWC)采用烘干称重法测定[13]。幼苗叶片电解质渗透率(REL)采用电导率仪(DDSJ-308F,雷磁)进行测定[16]。使用80%丙酮浸提幼苗叶片叶绿素,并利用分光光度计测定其含量[17]。
-
分别使用 Tamás 等[18]和Luo等[19]提出的方法测定各NaCl处理下苦楝、白榆和刺槐幼苗根和叶中游离脯氨酸以及可溶性蛋白含量。
-
各NaCl处理下苦楝、白榆和刺槐幼苗根和叶中过氧化氢酶(CAT)和抗坏血酸过氧化物酶(APX)的活性参照Polle等[20]所建立的方法测定。
-
依据甘红豪等[14]的方法测定各NaCl处理下苦楝、白榆和刺槐幼苗根和叶片中的Na+、K+、Ca2+ 和Mg2+ 含量,计算Na+/K+、Na+/Ca2+、Na+/Mg2+ 的比值。利用公式Sx, Na=(叶片X/Na+)/(根X/Na+)(X代表K+、Ca2+ 和Mg2+ 中的一种)计算离子选择运输系数SK, Na、SMg, Na 和 SCa, Na,用以评价NaCl处理下从幼苗根向叶片运输离子的选择性,其值越大,代表离子向叶片运输的选择性吸收积累就越高[14]。
-
使用Statgraphics Centurion XVI.I(STN, St, Louis, MO, USA)软件对正态分布检验后的数据进行分析。采用双因素方差分析研究树种(S)和盐分(T)对各变量的影响。当F检验的P-Value < 0.05时,认为数据间具有统计学差异。使用OriginPro 2021(OriginLab Inc.,Massachusetts,USA)进行相关性分析、主成分分析和图表绘制,并利用隶属函数法和主成分权重赋值法分析评价不同幼苗的耐盐能力差异,同时使用灰色关联分析筛选在苦楝、白榆和刺槐幼苗适应盐胁迫过程中起主要作用的变量指标。
-
白榆和刺槐幼苗根、茎、叶片生物量随着NaCl浓度的增加呈下降趋势;苦楝幼苗叶生物量在NaCl处理下没有发生显著变化,但根和茎生物量在200 mmol·L−1 NaCl处理下达到最大值(表1)。与0 mmol·L−1 NaCl处理相比,300 mmol·L−1 NaCl处理使苦楝、白榆、刺槐幼苗根、茎和叶生物量出现不同程度降低,其中刺槐根和叶生物量降低幅度最大,为45.1%和52.2%;而白榆茎生物量下降最多,为24.8%。三者幼苗叶RWC在300 mmol·L−1 NaCl处理下显著下降、REL显著升高,其中苦楝幼苗叶片RWC显著降低了28.0%,而刺槐幼苗叶片REL显著升高了125.3%,改变幅度最大。
树种
SpeciesNaCl浓度/
( mmol·L−1)干质量 Dry biomass/g 叶片相对含水量
RWC/%电解质渗透率
REL/%根
Root茎
Shoot叶
Leaf苦楝 0 2.51 ± 0.15 bc 3.31 ± 0.08 b 2.43 ± 0.08 c 87.25 ± 1.29 f 37.5 ± 2.5 c 100 2.22 ± 0.25 b 3.59 ± 0.40 bc 2.08 ± 0.22 abc 73.69 ± 0.71 d 49.4 ± 1.7 f 200 2.86 ± 0.03 c 4.29 ± 0.07 c 2.37 ± 0.05 bc 63.33 ± 1.90 b 55.5 ± 1.5 g 300 2.40 ± 0.17 bc 3.21 ± 0.25 b 1.75 ± 0.10 a 57.29 ± 0.59 a 59.5 ± 1.4 h 白榆 0 8.72 ± 0.38 f 10.13 ± 0.47 i 10.26 ± 0.42 g 88.68 ± 0.61 f 26.3 ± 1.3 a 100 6.12 ± 0.10 de 8.82 ± 0.23 e 7.04 ± 0.27 ef 81.63 ± 1.82 e 35.6 ± 1.6 c 200 6.59 ± 0.28 e 8.46 ± 0.59 e 7.73 ± 0.17 f 77.12 ± 1.23 d 42.6 ± 1.7 d 300 5.75 ± 0.06 d 7.61 ± 0.23 d 6.47 ± 0.48 e 64.79 ± 1.21 b 45.4 ± 1.4 e 刺槐 0 1.02 ± 0.02 a 2.10 ± 0.09 a 3.64 ± 0.17 d 90.66 ± 0.54 f 28.5 ± 1.6 b 100 0.59 ± 0.03 a 1.63 ± 0.07 a 1.87 ± 0.18 a 74.23 ± 1.39 d 49.8 ± 1.9 f 200 0.57 ± 0.05 a 1.80 ± 0.17 a 1.95 ± 0.10 ab 69.20 ± 1.12 c 60.1 ± 1.8 h 300 0.56 ± 0.04 a 1.65 ± 0.07 a 1.74 ± 0.11 a 65.24 ± 0.83 b 64.2 ± 1.5 i P -Value S **** **** **** **** **** T **** ** **** **** **** S × T **** ** *** *** **** 注:数据为平均值 ± 标准误(n=6),同列不同字母代表差异显著( P ≤ 0.05) ; *: P ≤ 0.05; **: P ≤ 0.01; ***:P ≤ 0.001; ***:P ≤ 0.0001。下同
Notes: The data is the average ± SE (n=6), different letters in the same column mean significant different in P ≤ 0.05 level; **: P ≤ 0.01; ***:P ≤ 0.001; ***:P ≤ 0.0001. The same belowTable 1. The Effects of NaCl on dry biomass, leaf relative water content and relative electrolytic leakage of M. azedarach, U. pumila and R. pseudoacacia.
与0 mmol·L−1 NaCl处理相比,苦楝和白榆幼苗叶片的叶绿素(叶绿素a和叶绿素b)和类胡萝卜素含量在100和200 mmol·L−1 NaCl处理下差异不显著,但刺槐幼苗叶片色素含量显著降低(表2)。在300 mmol·L−1 NaCl处理下,三种幼苗叶片的色素含量均显著降低,其中白榆幼苗叶片叶绿素b显著下降了59.4%,降幅最大;而刺槐幼苗叶片叶绿素a和类胡萝卜素含量减少了48.0%和51.0%,下降最多。
树种/
SpeciesNaCl浓度/
(mmol·L−1)叶绿素a
Chl a/(mg·g−1)叶绿素b
Chl b/(mg·g−1)类胡萝卜素
Car/(mg·g−1)苦楝 0 9.47 ± 0.34 fg 2.64 ± 0.12 de 2.17 ± 0.06 fg 100 9.84 ± 1.04 g 3.09 ± 0.28 e 2.02 ± 0.26 efg 200 8.66 ± 0.96 efg 3.06 ± 0.36 e 2.34 ± 0.05 gh 300 6.07 ± 0.25 abc 1.71 ± 0.08 bc 1.83 ± 0.07 de 白榆 0 8.03 ± 0.38 def 2.71 ± 0.08 de 1.69 ± 0.13 cd 100 7.66 ± 0.56 de 2.14 ± 0.38 cd 1.77 ± 0.06 de 200 7.20 ± 0.11 cde 2.19 ± 0.26 cd 1.57 ± 0.04 bcd 300 4.96 ± 0.26 a 1.10 ± 0.06 a 1.37 ± 0.07 bc 刺槐 0 9.56 ± 0.80 fg 2.69 ± 0.21 de 2.02 ± 0.18 ef 100 6.69 ± 0.19 bcd 1.93 ± 0.07 bc 1.28 ± 0.05 ab 200 5.15 ± 0.16 ab 1.47 ± 0.03 ab 1.03 ± 0.02 a 300 4.97 ± 0.33 a 1.40 ± 0.12 ab 0.99 ± 0.04 a P -Value S **** **** **** T **** **** **** S × T * ** *** Table 2. The effects of NaCl on photosynthetic pigment content of M. azedarach, U. pumila and R. pseudoacacia.
与0 mmol·L−1 NaCl处理相比,300 mmol·L−1 NaCl处理使苦楝幼苗叶片的Pn、Gs、Ci和E分别降低了52.7%、80.1%、38.9%和81.3%,使白榆幼苗叶片上述指标分别下降了71.1%、83.7%、33.8%和79.1%,使刺槐幼苗叶片上述指标分别下降了68.8%、76.9%、21.8%和80.0%;而三种幼苗叶片的WUE分别升高了165.0%、37.8%和56.1%,Ls分别升高了107.4%、70.6%和28.6%(表3)。
树种/
SpeciesNaCl浓度/
(mmol·L−1)净光合速率
Pn/(μmol·m−2·s−1)气孔导度
Gs/ (mol·m−2·s−1)胞间CO2浓度
Ci / (μmol ·mol−1)蒸腾速率
E/(mmol·m−2·s−1)水分利用效率
WUE/(μmol·mmol−1)气孔限制值
Ls苦楝 0 11.2 ± 0.1 i 0.211 ± 0.009 g 270.2 ± 5.2 f 2.89 ± 0.11 i 4.0 ± 0.2 a 0.27 ± 0.01 a 100 8.5 ± 0.2 g 0.101 ± 0.010 e 228.1 ± 13.1 de 1.30 ± 0.11 fg 7.0 ± 0.6 cd 0.41 ± 0.03 bc 200 6.9 ± 0.3 f 0.071 ± 0.008 d 209.1 ± 14.3 bcd 0.79 ± 0.08 e 9.0 ± 0.7 ef 0.45 ± 0.04 cde 300 5.3 ± 0.2 d 0.042 ± 0.001 c 165.0 ± 5.5 a 0.54 ± 0.04 cd 10.6 ± 0.3 g 0.56 ± 0.01 f 白榆 0 9.7 ± 0.1 h 0.123 ± 0.004 f 251.2 ± 1.7 ef 2.15 ± 0.10 h 4.5 ± 0.2 a 0.34 ± 0.00 ab 100 6.0 ± 0.3 e 0.060 ± 0.003 d 205.3 ± 22.1 bcd 1.15 ± 0.06 f 5.4 ± 0.6 ab 0.47 ± 0.05 cde 200 3.9 ± 0.0 c 0.030 ± 0.001 b 161.3 ± 9.1 a 0.61 ± 0.01 d 6.5 ± 0.2 bc 0.58 ± 0.02 f 300 2.8 ± 0.1 a 0.020 ± 0.001 a 166.3 ± 12.0 a 0.45 ± 0.02 bc 6.2 ± 0.3 bc 0.58 ± 0.03 f 刺槐 0 9.3 ± 0.1 h 0.104 ± 0.003 e 227.5 ± 7.3 de 1.45 ± 0.05 g 6.6 ± 0.2 bc 0.42 ± 0.01 bc 100 4.1 ± 0.1 c 0.042 ± 0.004 c 214.4 ± 9.5 cd 0.55 ± 0.05 cd 8.3 ± 0.5 de 0.44 ± 0.02 cd 200 3.4 ± 0.2 b 0.029 ± 0.001 b 183.8 ± 10.9 abc 0.38 ± 0.03 b 9.3 ± 0.4 efg 0.51 ± 0.02 def 300 2.9 ± 0.0 ab 0.024 ± 0.002 ab 177.8 ± 18.3 ab 0.29 ± 0.03 a 10.3 ± 1.0 fg 0.54 ± 0.05 ef P -Value S **** **** * **** **** ** T **** **** **** **** **** **** S × T **** * ns * ** ns 注:ns:不显著
Note: ns: not significantTable 3. The effects of NaCl on photosynthetic parameters, WUE and Ls of M. azedarach, U. pumila and R. pseudoacacia.
-
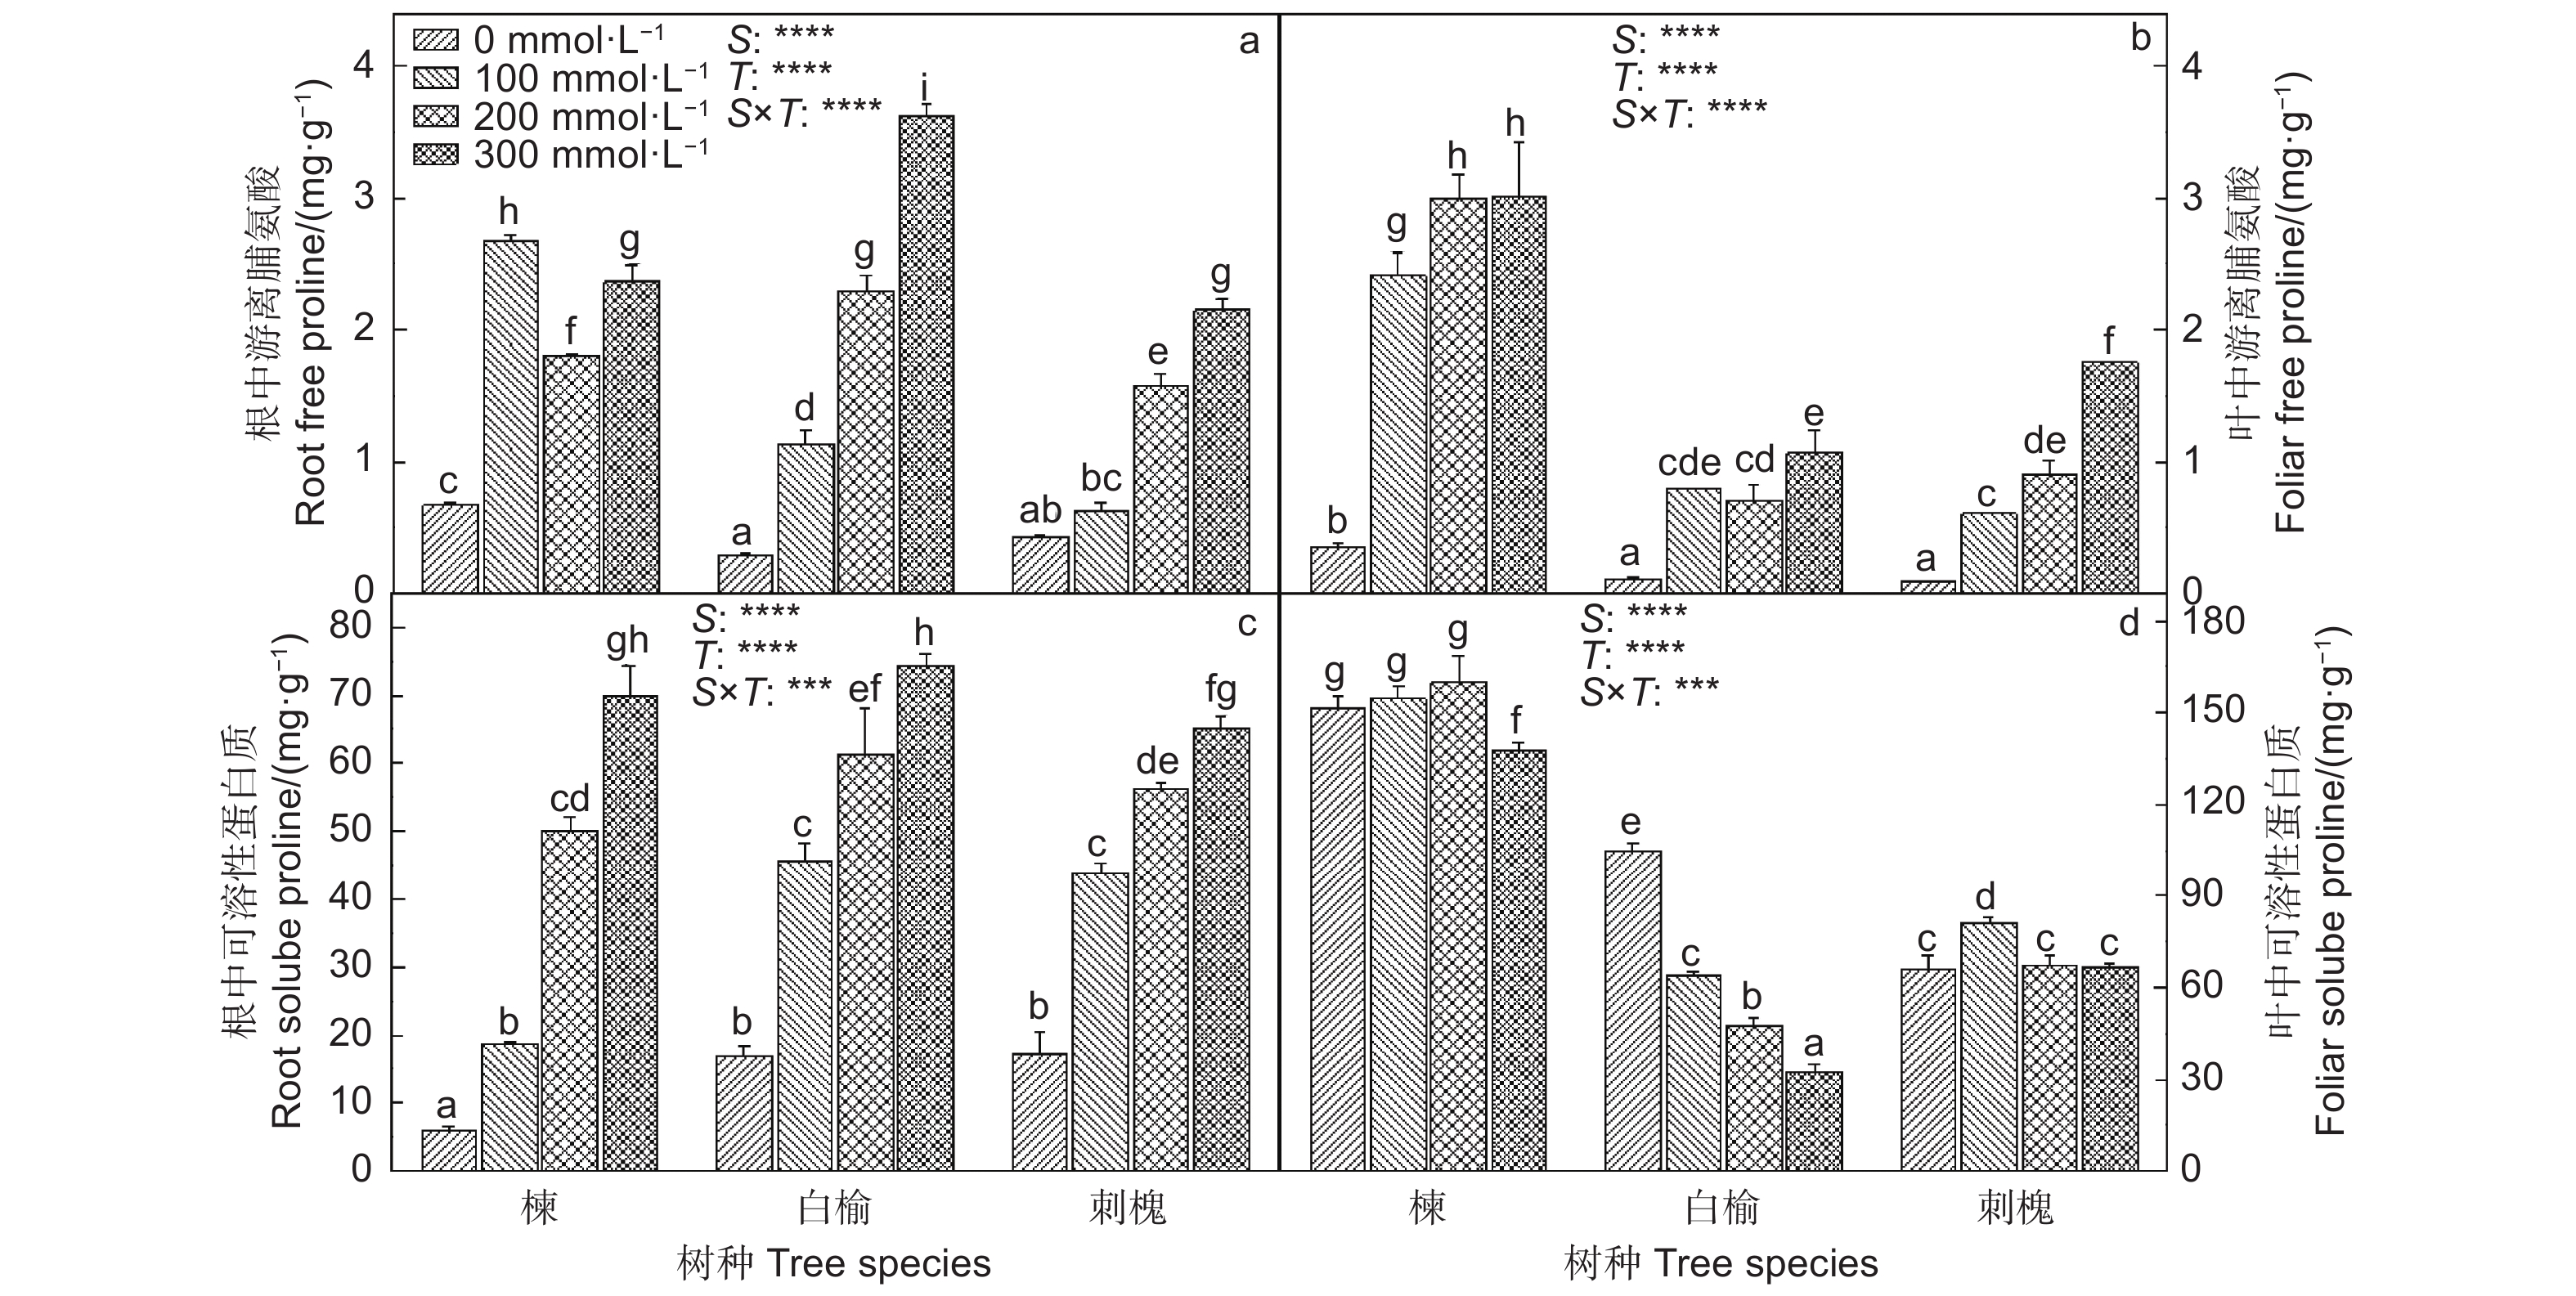
苦楝、白榆和刺槐根和叶中游离脯氨酸含量出现不同程度的增加(图1)。在300 mmol·L−1 NaCl处理下,苦楝、白榆和刺槐根中游离脯氨酸含量分别比0 mmol·L−1 NaCl处理提高了2.4、11.0和4.3倍,叶中游离脯氨酸分别升高了65、10和16倍。三者幼苗根中可溶性蛋白质在NaCl胁迫下显著增加,与0 mmol·L−1 NaCl处理相比,300 mmol·L−1 NaCl处理使它们根中可溶性蛋白质含量分别升高了10.7、3.4和2.8倍;苦楝叶中可溶性蛋白质含量仅在300 mmol·L−1 NaCl处理下显著降低;白榆叶中可溶性蛋白在受到盐胁迫后显著下降;而刺槐叶中可溶性蛋白在100 mmol·L−1 NaCl处理下却显著增加。

Figure 1. The effects of NaCl on free proline (a, b) and soluble protein (c, d) contents in roots and leaves of of M. azedarach, U. pumila and R. pseudoacacia
-
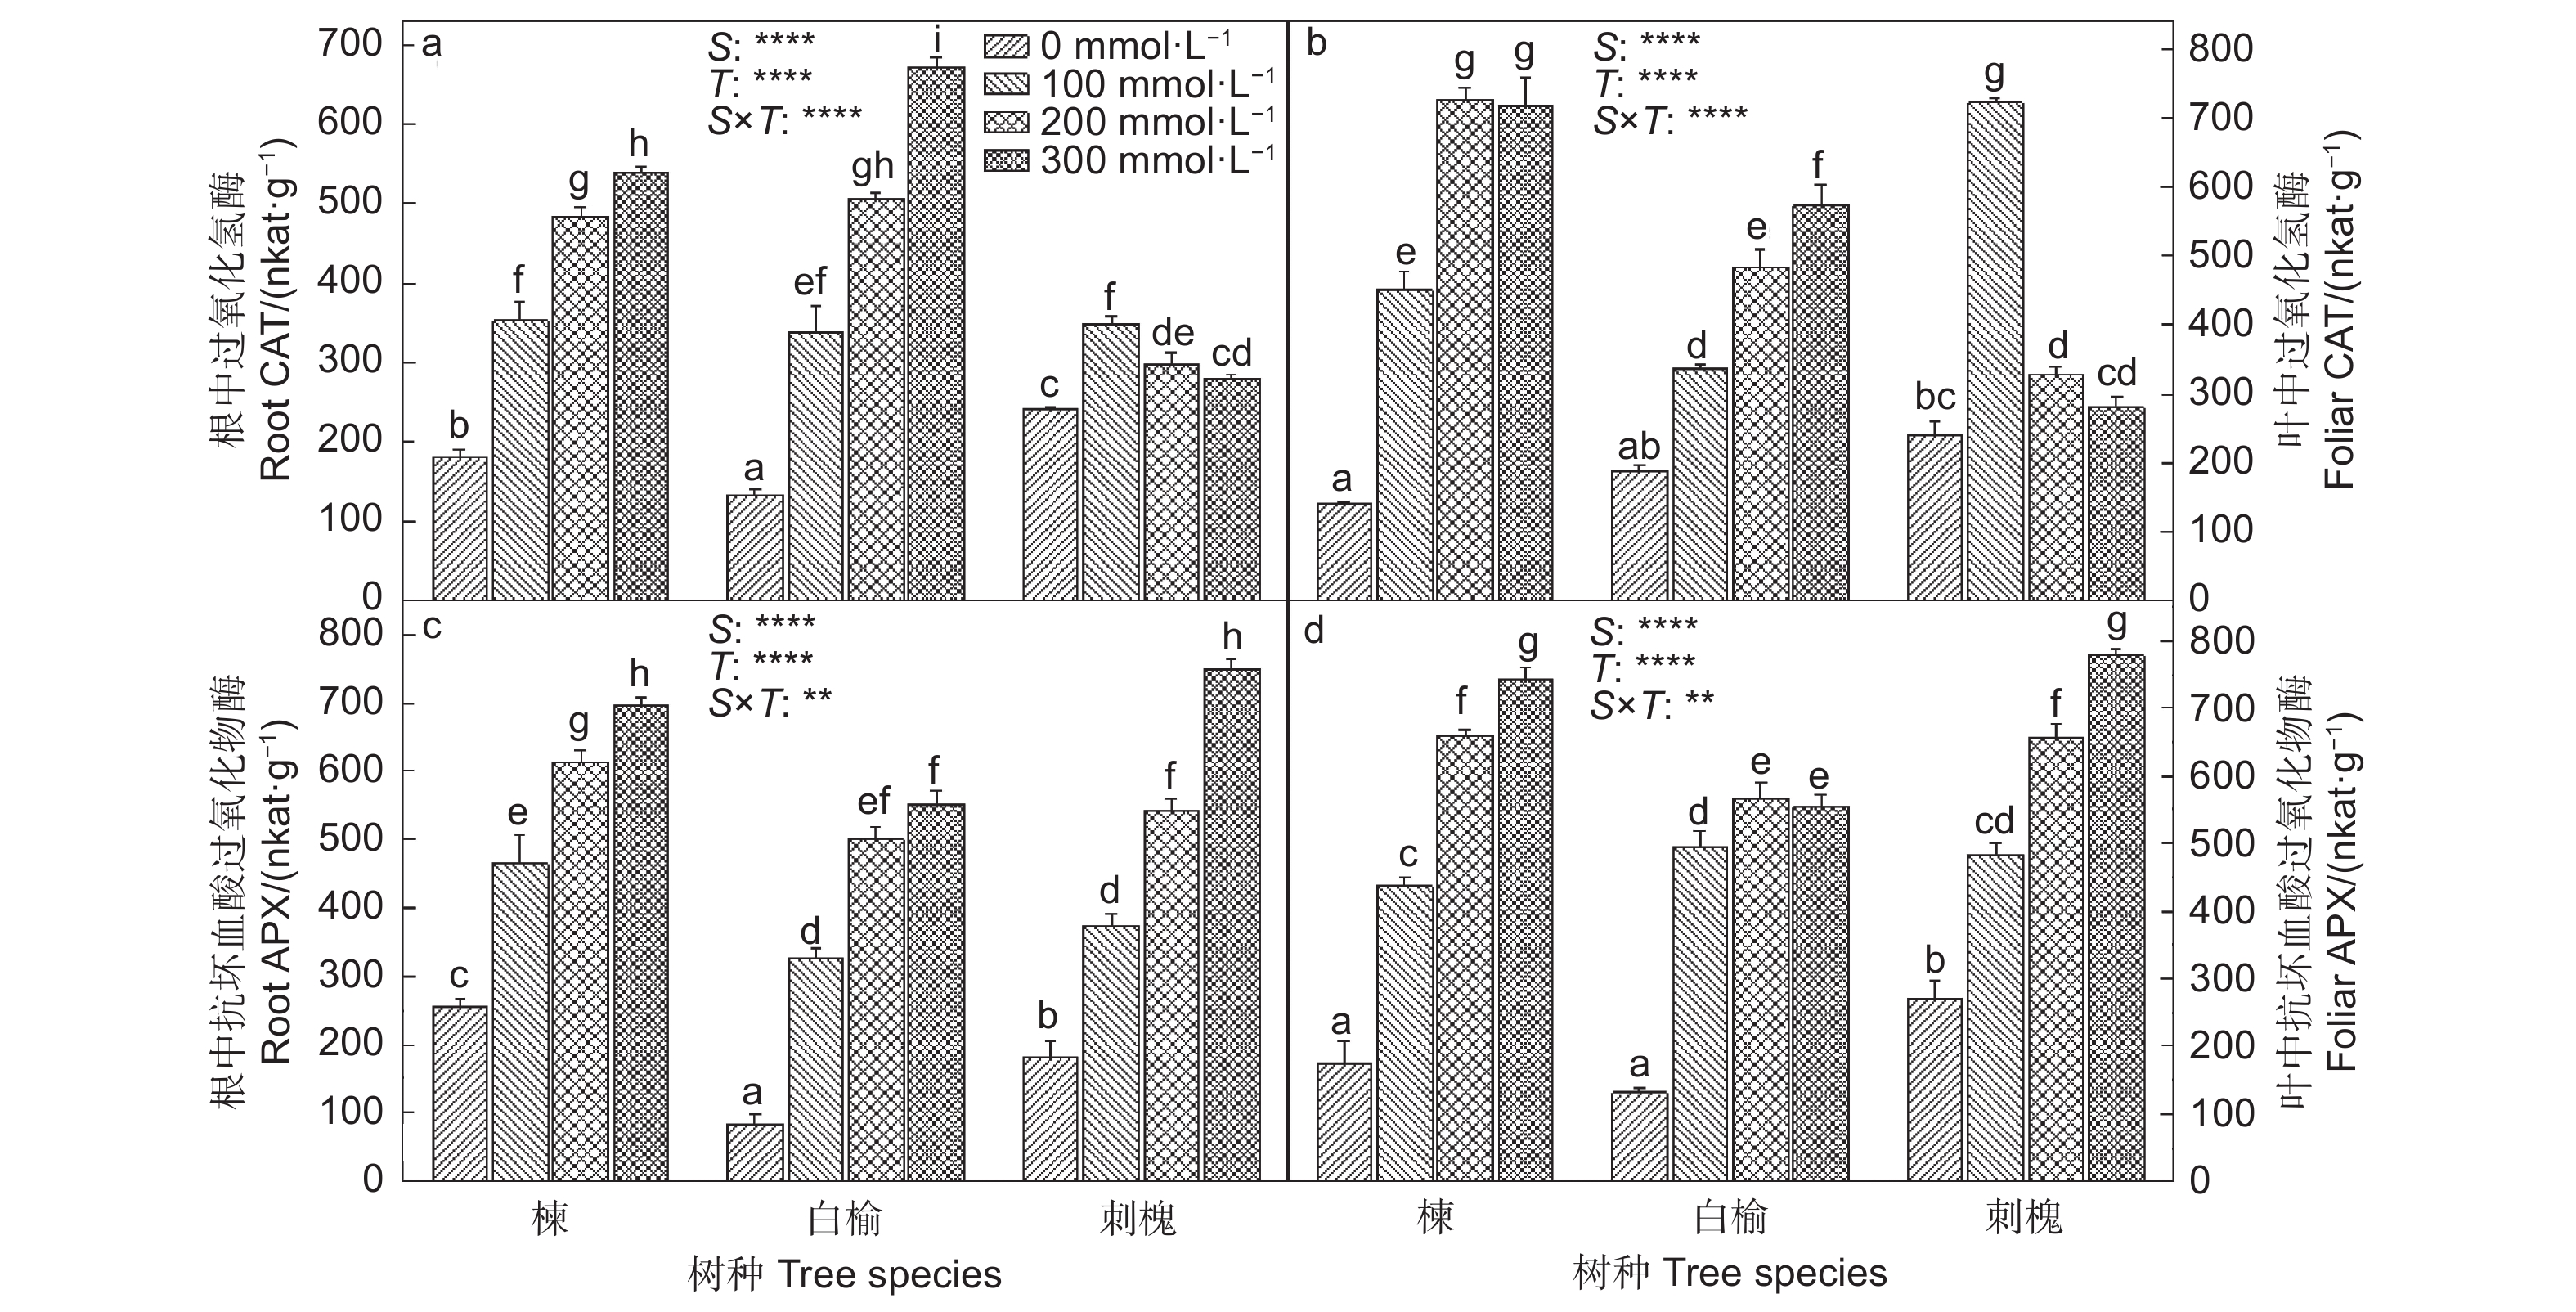
随着NaCl浓度增加,苦楝和白榆根和叶中CAT活性逐渐增强,与0 mmol·L−1 NaCl处理相比,CAT活性在300 mmol·L−1 NaCl处理的苦楝和白榆刺槐根中分别增加了197.0%和408.0%,在叶中分别增加了411.4%和204.3%(图2)。刺槐根和叶中CAT活性在100 mmol·L−1 NaCl处理下分别比0 mmol·L−1 NaCl处理升高了43.2%和199.2%。在300 mmol·L−1 NaCl处理下,三者根和叶中APX活性分别比0 mmol·L−1 NaCl处理提高了1.7、5.6、3.1倍和3.3、3.2、1.9倍。
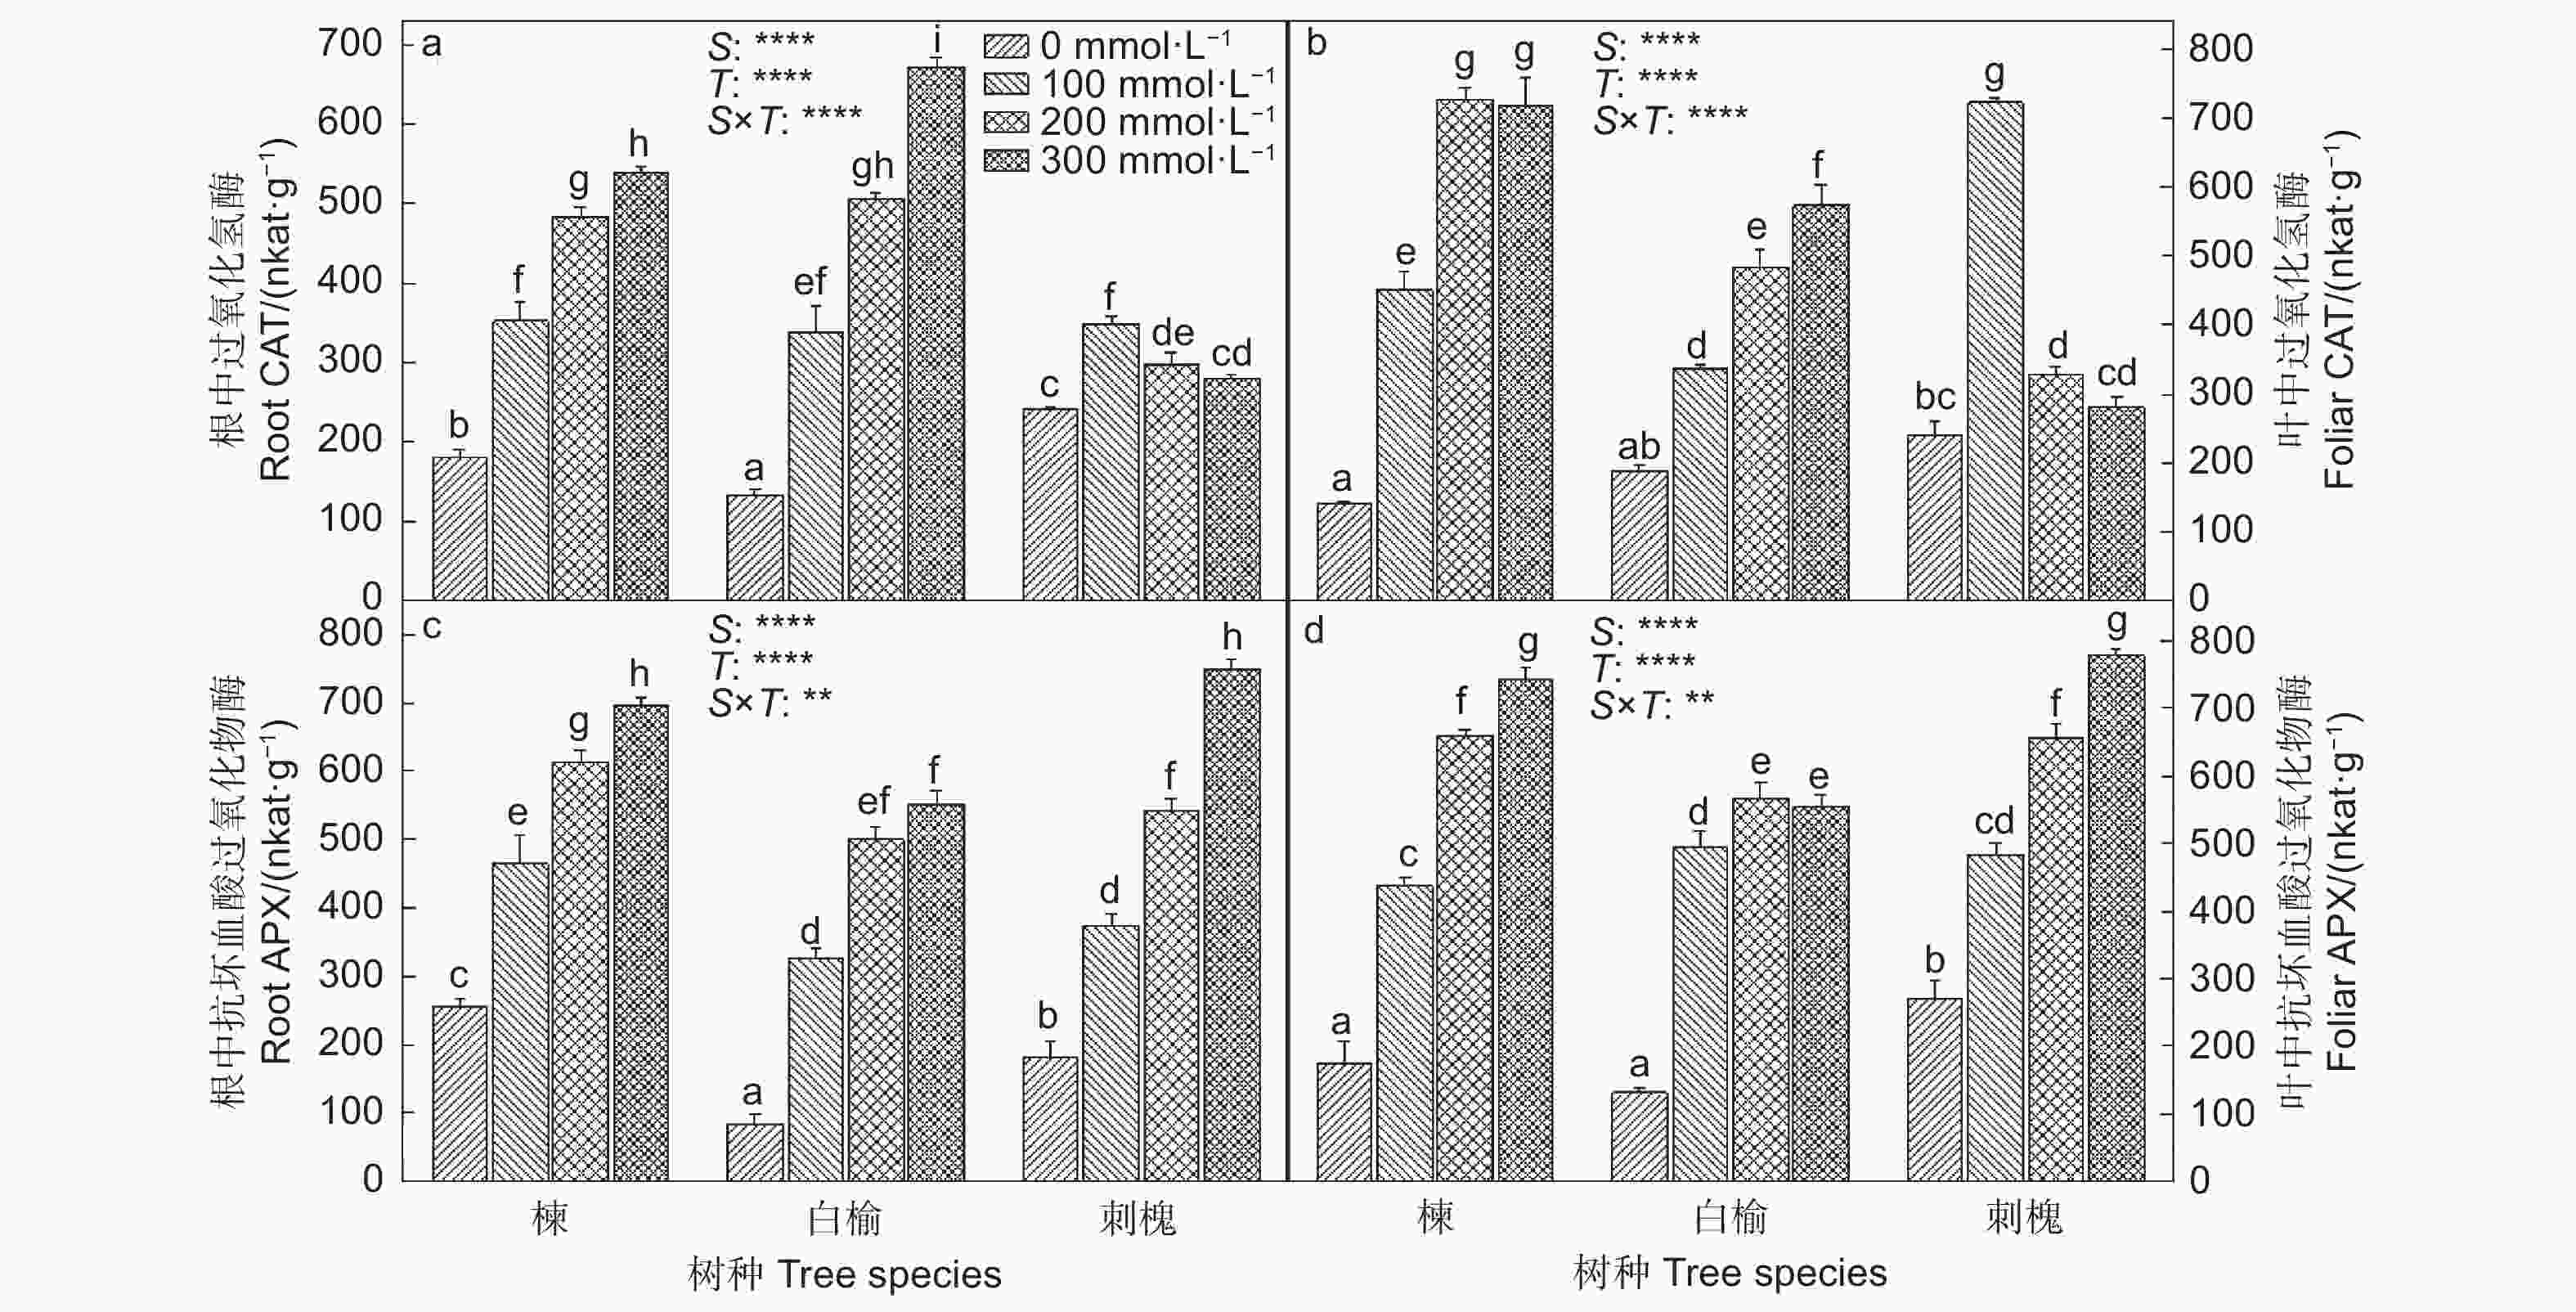
Figure 2. The effects of NaCl on CAT (a, b) and APX (c, d) activities in roots and leaves of of M. azedarach, U. pumila and R. pseudoacacia.
-
NaCl胁迫使苦楝、白榆和刺槐幼苗根和叶中的Na+ 含量升高(表4)。在300 mmol·L−1 NaCl处理下,苦楝、白榆和刺槐幼苗根中Na+ 含量比0 mmol·L−1 NaCl处理分别升高了99.3%、601.2%和594.0%,叶中Na+ 含量分别增加了151.9、128.1和7.1倍。另外,苦楝幼苗根中Na+ 含量在不同浓度NaCl处理间无显著差异,白榆幼苗根中Na+ 含量在100 mmol·L−1 和200 mmol·L−1 NaCl间无显著差异,但刺槐幼苗根中Na+ 含量随NaCl浓度增加而显著升高。
树种/
SpeciesNaCl浓度/
(mmol·L−1)根 Root 叶 Foliar Na+含量/
(mg·g−1)K+含量/
(mg·g−1)Ca2+含量/
(mg·g−1)Mg2+含量/
(mg·g−1)Na+含量/
(mg·g−1)K+含量/
(mg·g−1)Ca2+含量/
(mg·g−1)Mg2+含量/
(mg·g−1)苦楝 0 1.41 ± 0.21 a 11.88 ± 0.92 c 2.87 ± 0.13 a 1.97 ± 0.39 a 0.08 ± 0.01 a 18.99 ± 1.88 bcd 15.93 ± 0.66 b 4.74 ± 0.19 ef 100 2.73 ± 0.12 b 12.04 ± 0.44 c 3.06 ± 0.38 a 2.10 ± 0.18 ab 0.57 ± 0.28 c 22.35 ± 0.22 fgh 15.17 ± 0.15 ab 3.67 ± 0.08 abc 200 2.71 ± 0.36 b 11.49 ± 0.05 c 2.86 ± 0.15 a 1.80 ± 0.11 a 4.57 ± 1.28 e 22.82 ± 0.95 gh 13.09 ± 0.49 ab 3.40 ± 0.18 a 300 2.81 ± 0.33 b 8.90 ± 0.77 b 2.86 ± 0.30 a 1.76 ± 0.15 a 12.23 ± 1.08 f 21.37 ± 0.84 efg 12.75 ± 0.34 a 3.36 ± 0.10 a 白榆 0 1.71 ± 0.15 ab 7.57 ± 0.43 b 10.32 ± 1.19 d 3.36 ± 0.11 de 0.08 ± 0.01 a 13.00 ± 0.19 a 23.23 ± 0.52 bc 5.26 ± 0.04 f 100 8.50 ± 0.46 c 4.46 ± 0.28 a 8.26 ± 0.17 c 3.16 ± 0.15 de 0.15 ± 0.01 ab 17.28 ± 0.38 bc 23.17 ± 1.17 bc 4.64 ± 0.25 def 200 9.02 ± 0.35 c 4.46 ± 0.15 a 8.05 ± 0.44 c 2.99 ± 0.07 cd 0.29 ± 0.03 bc 16.72 ± 0.41 b 22.01 ± 0.71 b 4.52 ± 0.23 de 300 11.99 ± 0.36 d 3.29 ± 0.12 a 7.69 ± 0.72 c 2.99 ± 0.29 cd 10.33 ± 0.45 f 19.94 ± 0.32 def 20.62 ± 0.76 b 4.49 ± 0.16 de 刺槐 0 1.99 ± 0.16 ab 16.52 ± 0.09 e 4.69 ± 0.12 b 2.59 ± 0.08 bc 0.21 ± 0.03 b 24.44 ± 1.09 hi 21.89 ± 0.25 b 4.05 ± 0.25 bcd 100 9.11 ± 0.95 c 14.69 ± 0.07 d 4.42 ± 0.11 b 3.36 ± 0.07 de 1.41 ± 0.32 d 26.05 ± 1.30 ij 22.39 ± 2.02 b 3.61 ± 0.38 ab 200 11.23 ± 0.06 d 12.24 ± 0.22 c 4.28 ± 0.09 b 3.59 ± 0.29 e 0.43 ± 0.05 c 27.89 ± 0.25 j 27.38 ± 1.37 d 4.09 ± 0.20 bcd 300 13.81 ± 0.76 e 8.80 ± 0.74 b 5.03 ± 0.05 b 3.11 ± 0.09 cde 1.71 ± 0.22 d 34.10 ± 1.50 k 25.82 ± 2.04 cd 4.25 ± 0.28 cde P -Value S **** **** **** **** **** **** **** **** T **** **** ns ns **** **** ns ** S × T **** *** ns * **** ** ** * Table 4. The effects of NaCl on the ion contents in roots and leaves of M. azedarach, U. pumila and R. pseudoacacia.
与0 mmol·L−1 NaCl处理相比,100 mmol·L−1 和200 mmol·L−1 NaCl处理对苦楝幼苗根中K+含量无显著影响,但使白榆和刺槐幼苗根中K+ 含量显著降低(表4)。与0 mmol·L−1 NaCl处理相比,300 mmol·L−1 NaCl处理使苦楝、白榆和刺槐幼苗根中K+ 含量分别下降了25.1%、56.5%和46.7%,但使三者幼苗叶中K+ 含量分别升高了12.5%、53.4%和39.5%。另外,NaCl胁迫使苦楝、白榆和刺槐幼苗根和叶中的K+/ Na+ 显著降低,与0 mmol·L−1 NaCl处理相比,在300 mmol·L−1 NaCl处理下,它们根和叶中的K+/ Na+ 分别降低了62.5%、94.0%、92.3%和99.1%、98.8%、85.3%(表5)。
树种/
SpeciesNaCl浓度/
(mmol·L−1)根 Root 叶 Foliar K+/Na+ Ca2+/Na+ Mg2+/Na+ K+/Na+ Ca2+/Na+ Mg2+/Na+ 苦楝 0 8.59 ± 0.57 g 2.09 ± 0.20 d 1.38 ± 0.06 e 196.83 ± 10.49 h 196.26 ± 3.40 g 58.41 ± 1.77 g 100 4.44 ± 0.31 f 1.14 ± 0.20 c 0.78 ± 0.10 d 36.88 ± 9.84 c 24.90 ± 6.45 d 6.24 ± 1.66 c 200 4.37 ± 0.49 f 1.08 ± 0.08 c 0.68 ± 0.06 cd 3.78 ± 0.04 ab 2.17 ± 0.06 b 0.56 ± 0.00 a 300 3.22 ± 0.33 e 1.04 ± 0.15 c 0.63 ± 0.02 c 1.76 ± 0.10 a 1.07 ± 0.13 a 0.28 ± 0.02 a 白榆 0 4.48 ± 0.23 f 6.02 ± 0.18 e 1.99 ± 0.13 f 161.41 ± 10.17 g 288.25 ± 18.53 h 65.35 ± 4.11 h 100 0.53 ± 0.06 ab 0.98 ± 0.03 c 0.37 ± 0.01 b 113.64 ± 6.55 e 152.58 ± 4.22 f 29.57 ± 1.00 f 200 0.50 ± 0.04 ab 0.90 ± 0.06 c 0.33 ± 0.02 b 60.72 ± 6.42 d 80.11 ± 7.02 e 16.41 ± 1.00 e 300 0.27 ± 0.00 a 0.64 ± 0.05 b 0.25 ± 0.02 a 1.97 ± 0.19 a 2.02 ± 0.16 ab 0.44 ± 0.04 a 刺槐 0 8.47 ± 0.75 g 2.39 ± 0.14 d 1.34 ± 0.02 e 139.15 ± 1.45 f 138.00 ± 1.25 f 27.11 ± 0.76 f 100 1.67 ± 0.18 d 0.51 ± 0.07 ab 0.38 ± 0.03 b 21.18 ± 3.89 bc 16.74 ± 2.98 cd 2.87 ± 0.38 b 200 1.09 ± 0.03 c 0.38 ± 0.01 a 0.32 ± 0.02 b 65.97 ± 6.84 d 65.03 ± 8.62 e 9.59 ± 0.69 d 300 0.65 ± 0.09 b 0.38 ± 0.07 a 0.23 ± 0.01 a 20.47 ± 3.17 bc 14.67 ± 1.07 c 2.54 ± 0.17 b P-Value S **** **** **** **** **** **** T **** **** **** **** **** **** S × T **** **** **** **** **** **** Table 5. The effects of NaCl on the ion ratios in roots and leaves of M. azedarach, U. pumila and R. pseudoacacia
NaCl胁迫苦楝、白榆和刺槐幼苗根和叶中Ca2+ 含量的影响并不一致(表4)。NaCl胁迫对苦楝和刺槐幼苗根中Ca2+ 含量无显著影响,但使白榆幼苗根中Ca2+ 含量显著下降。与0 mmol·L−1 NaCl处理相比,100 mmol·L−1 NaCl处理对苦楝、白榆和刺槐幼苗叶中Ca2+ 含量无显著影响;200 mmol·L−1 NaCl处理对苦楝和白榆幼苗叶中Ca2+ 含量无显著影响,但使刺槐幼苗叶中Ca2+ 含量显著升高;300 mmol·L−1 NaCl处理使苦楝幼苗叶中Ca2+ 含量显著降低,使刺槐幼苗叶中Ca2+ 含量显著升高,但对白榆幼苗叶中Ca2+ 含量无显著影响。苦楝、白榆和刺槐幼苗根和叶中Ca2+/Na+ 均在受到NaCl胁迫后显著降低,300 mmol·L−1 NaCl处理使它们根中Ca2+/Na+ 比0 mmol·L−1 NaCl处理分别减少了50.2%、89.4%和84.1%,使叶中Ca2+/Na+ 分别减少了99.5%、99.3%和89.4%。
NaCl胁迫对苦楝和白榆幼苗根中Mg2+ 含量没有显著影响,但使刺槐幼苗根中Mg2+ 含量升高(表4)。在叶中,NaCl胁迫使苦楝和白榆幼苗的Mg2+ 含量显著降低,但对刺槐幼苗没有显著影响。然而,NaCl胁迫使苦楝、白榆和刺槐幼苗根和叶中的Mg2+/Na+ 显著降低,在300 mmol·L−1 NaCl处理下,它们根和叶中的Mg2+/Na+ 分别下降了54.3%、87.4%、82.8%和99.5%、99.3%、90.6%。
苦楝幼苗的离子转运系数SK,Na、SCa,Na 和SMg,Na 随着NaCl浓度增加而显著增大,在300 mmol·L−1 NaCl处理下达到最大值,分别为0 mmol·L−1 NaCl处理组的39.3、85.1和96.3倍(表6)。100 mmol·L−1 和200 mmol·L−1 NaCl处理使白榆幼苗的离子转运系数显著降低,但300 mmol·L−1 NaCl处理使其显著升高。刺槐幼苗的离子转运系数在100 mmol·L−1 NaCl处理下升高,但在200 mmol·L−1 NaCl处理下下降,而300 mmol·L−1 NaCl仅使SCa,Na 和SMg,Na 显著升高。
树种/Species NaCl浓度/ (mmol·L−1) SK, Na SCa, Na SMg, Na 苦楝 0 0.047 ± 0.003 ef 0.012 ± 0.000 b 0.024 ± 0.001 b 100 0.180 ± 0.027 h 0.068 ± 0.004 f 0.178 ± 0.012 g 200 1.156 ± 0.133 i 0.497 ± 0.046 h 1.219 ± 0.112 i 300 1.849 ± 0.262 j 1.021 ± 0.211 i 2.311 ± 0.234 j 白榆 0 0.028 ± 0.001 d 0.021 ± 0.002 cd 0.030 ± 0.000 c 100 0.005 ± 0.000 a 0.007 ± 0.000 a 0.013 ± 0.001 a 200 0.009 ± 0.000 b 0.011 ± 0.000 b 0.021 ± 0.000 b 300 0.143 ± 0.016 h 0.318 ± 0.021 g 0.568 ± 0.042 h 刺槐 0 0.060 ± 0.006 fg 0.017 ± 0.001 c 0.046 ± 0.008 d 100 0.077 ± 0.010 g 0.029 ± 0.003 de 0.127 ± 0.011 f 200 0.017 ± 0.002 c 0.006 ± 0.001 a 0.033 ± 0.000 c 300 0.040 ± 0.008 de 0.030 ± 0.004 e 0.093 ± 0.007 e P -Value S **** **** **** T **** **** **** S × T **** **** **** Table 6. The effect of NaCl on SK, Na, SCa, Na and SMg, Na of M. azedarach, U. pumila and R. pseudoacacia
-
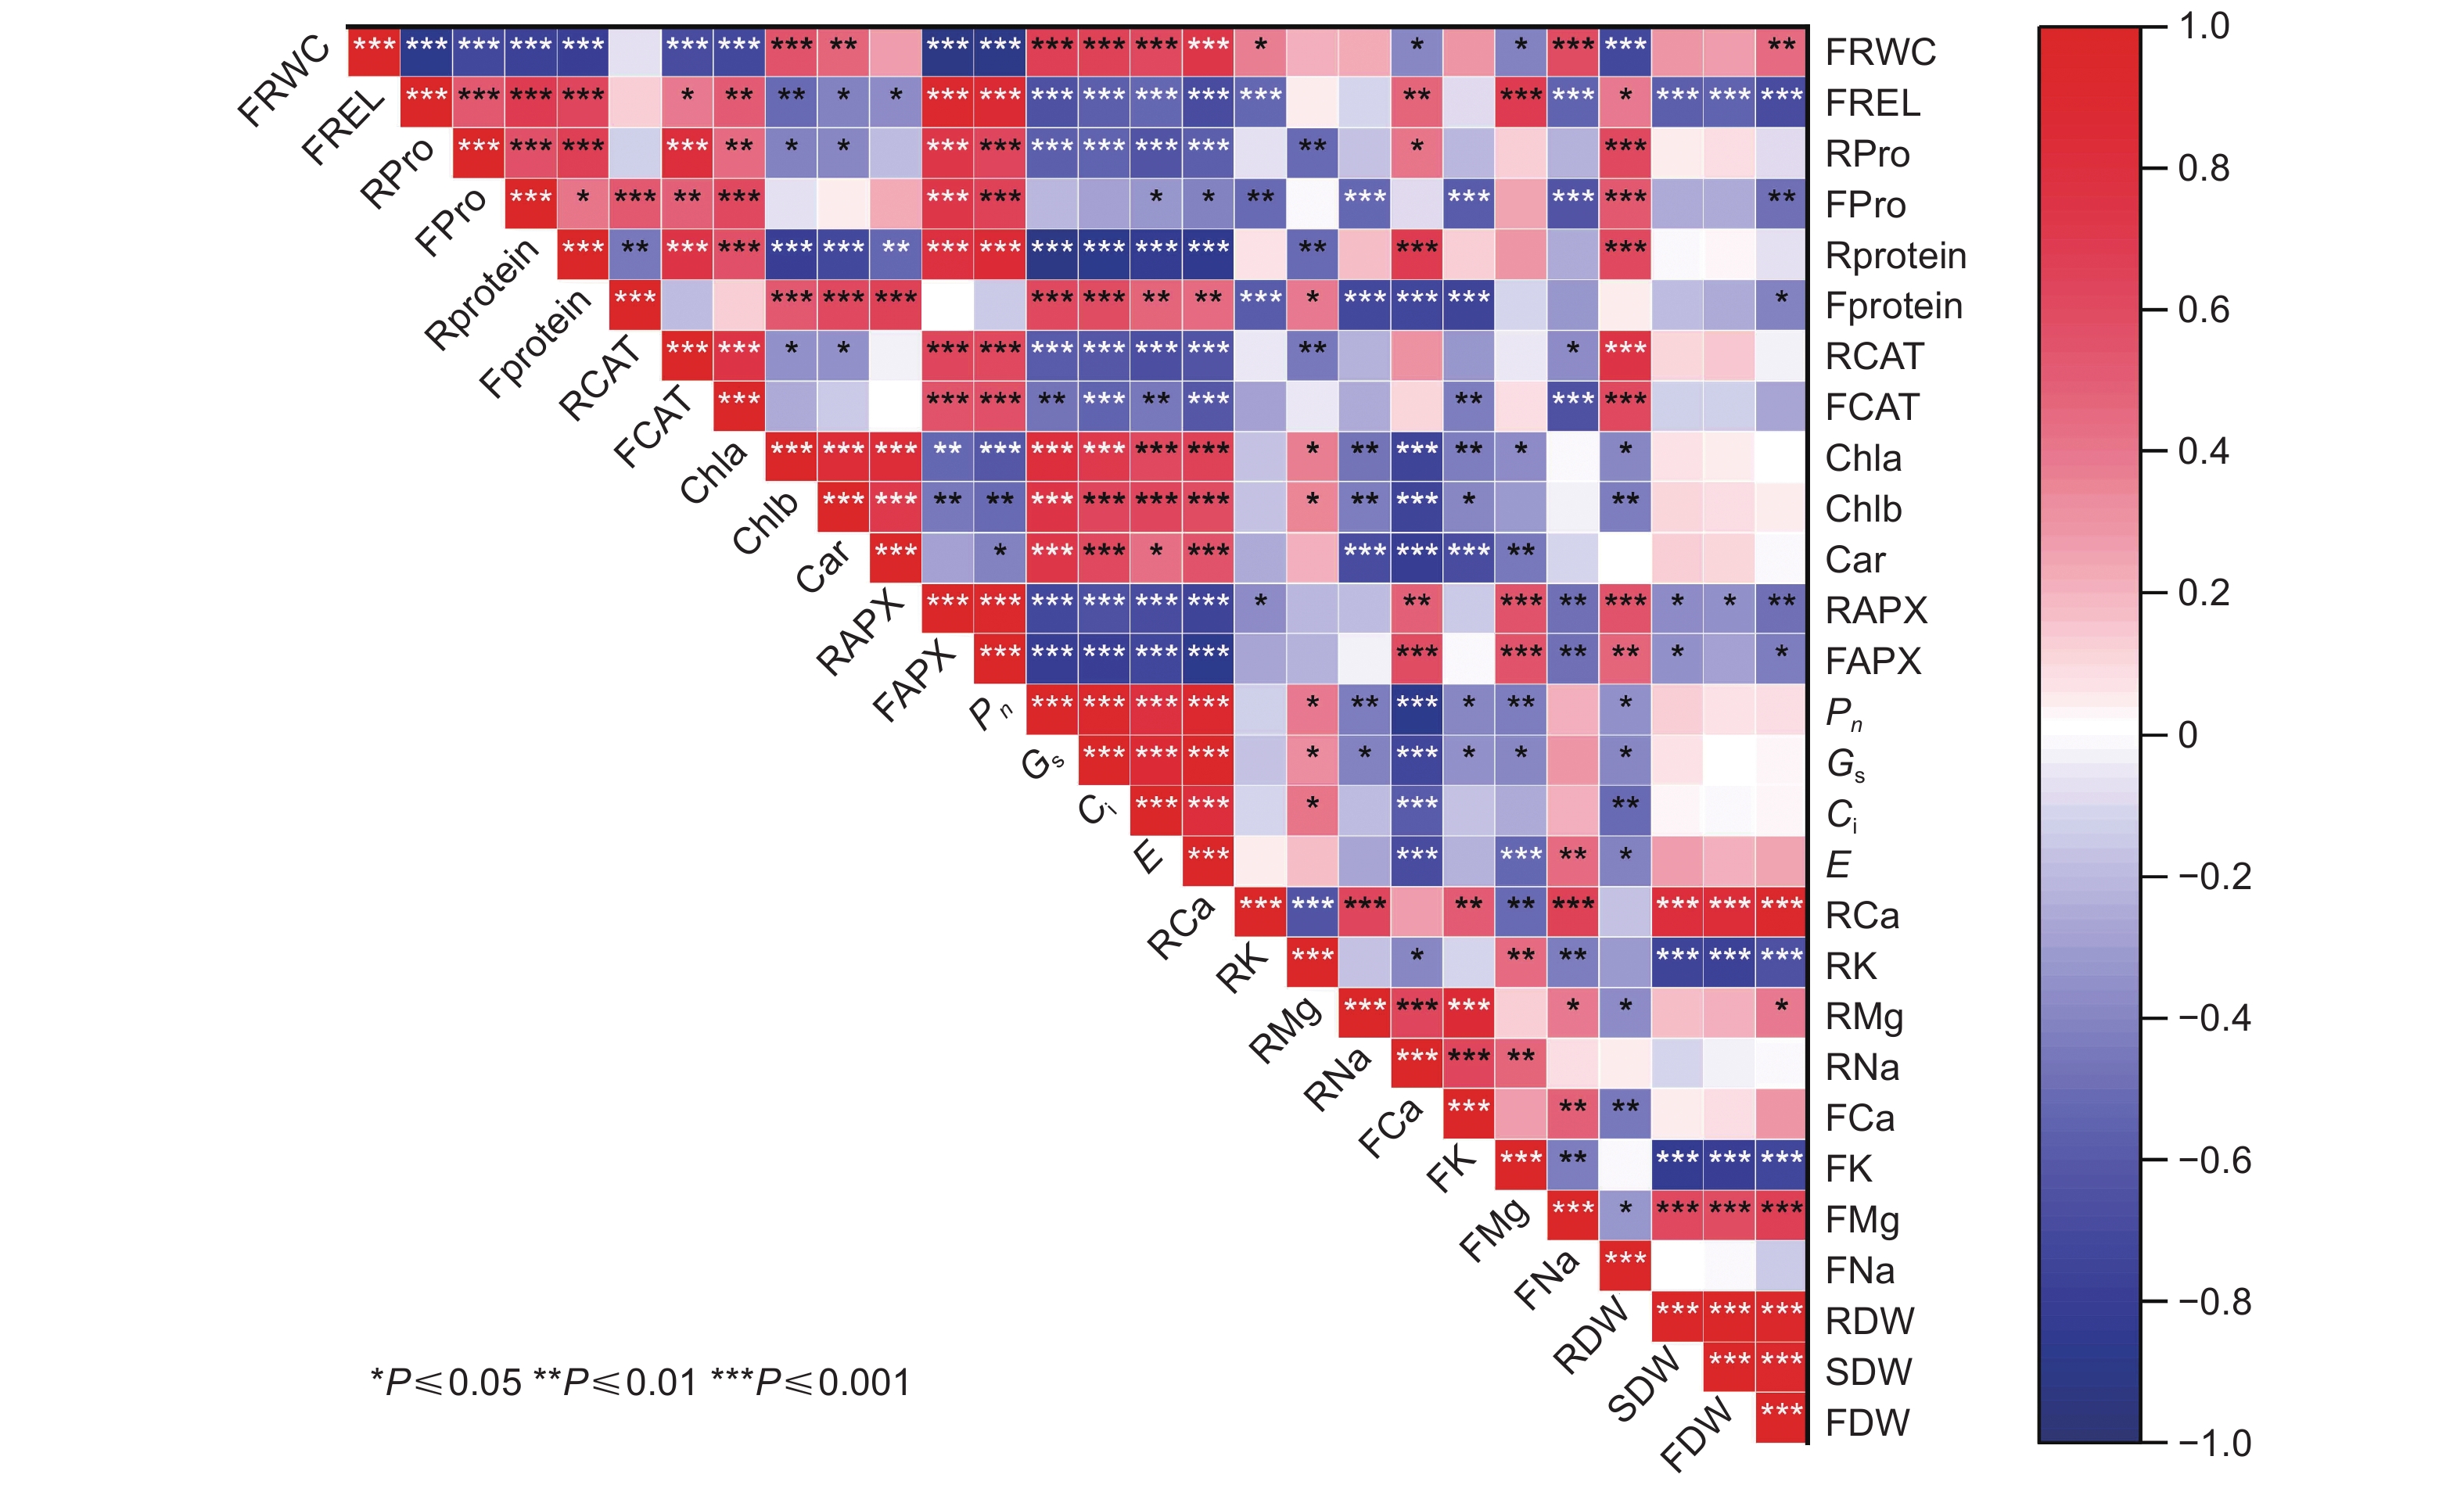
由相关系数矩阵可知(图3),除个别指标间相关性较小外,其余指标之间存在显著相关关系,这使得它们提供的评价信息发生重叠。由于这些指标在植物适应盐胁迫中所发挥的作用不同,导致直接利用上述指标对苦楝、白榆和刺槐幼苗的耐盐性进行评价会产生较大的偏差,因此,需要进一步鉴定才能够筛选出适宜的耐盐指标。
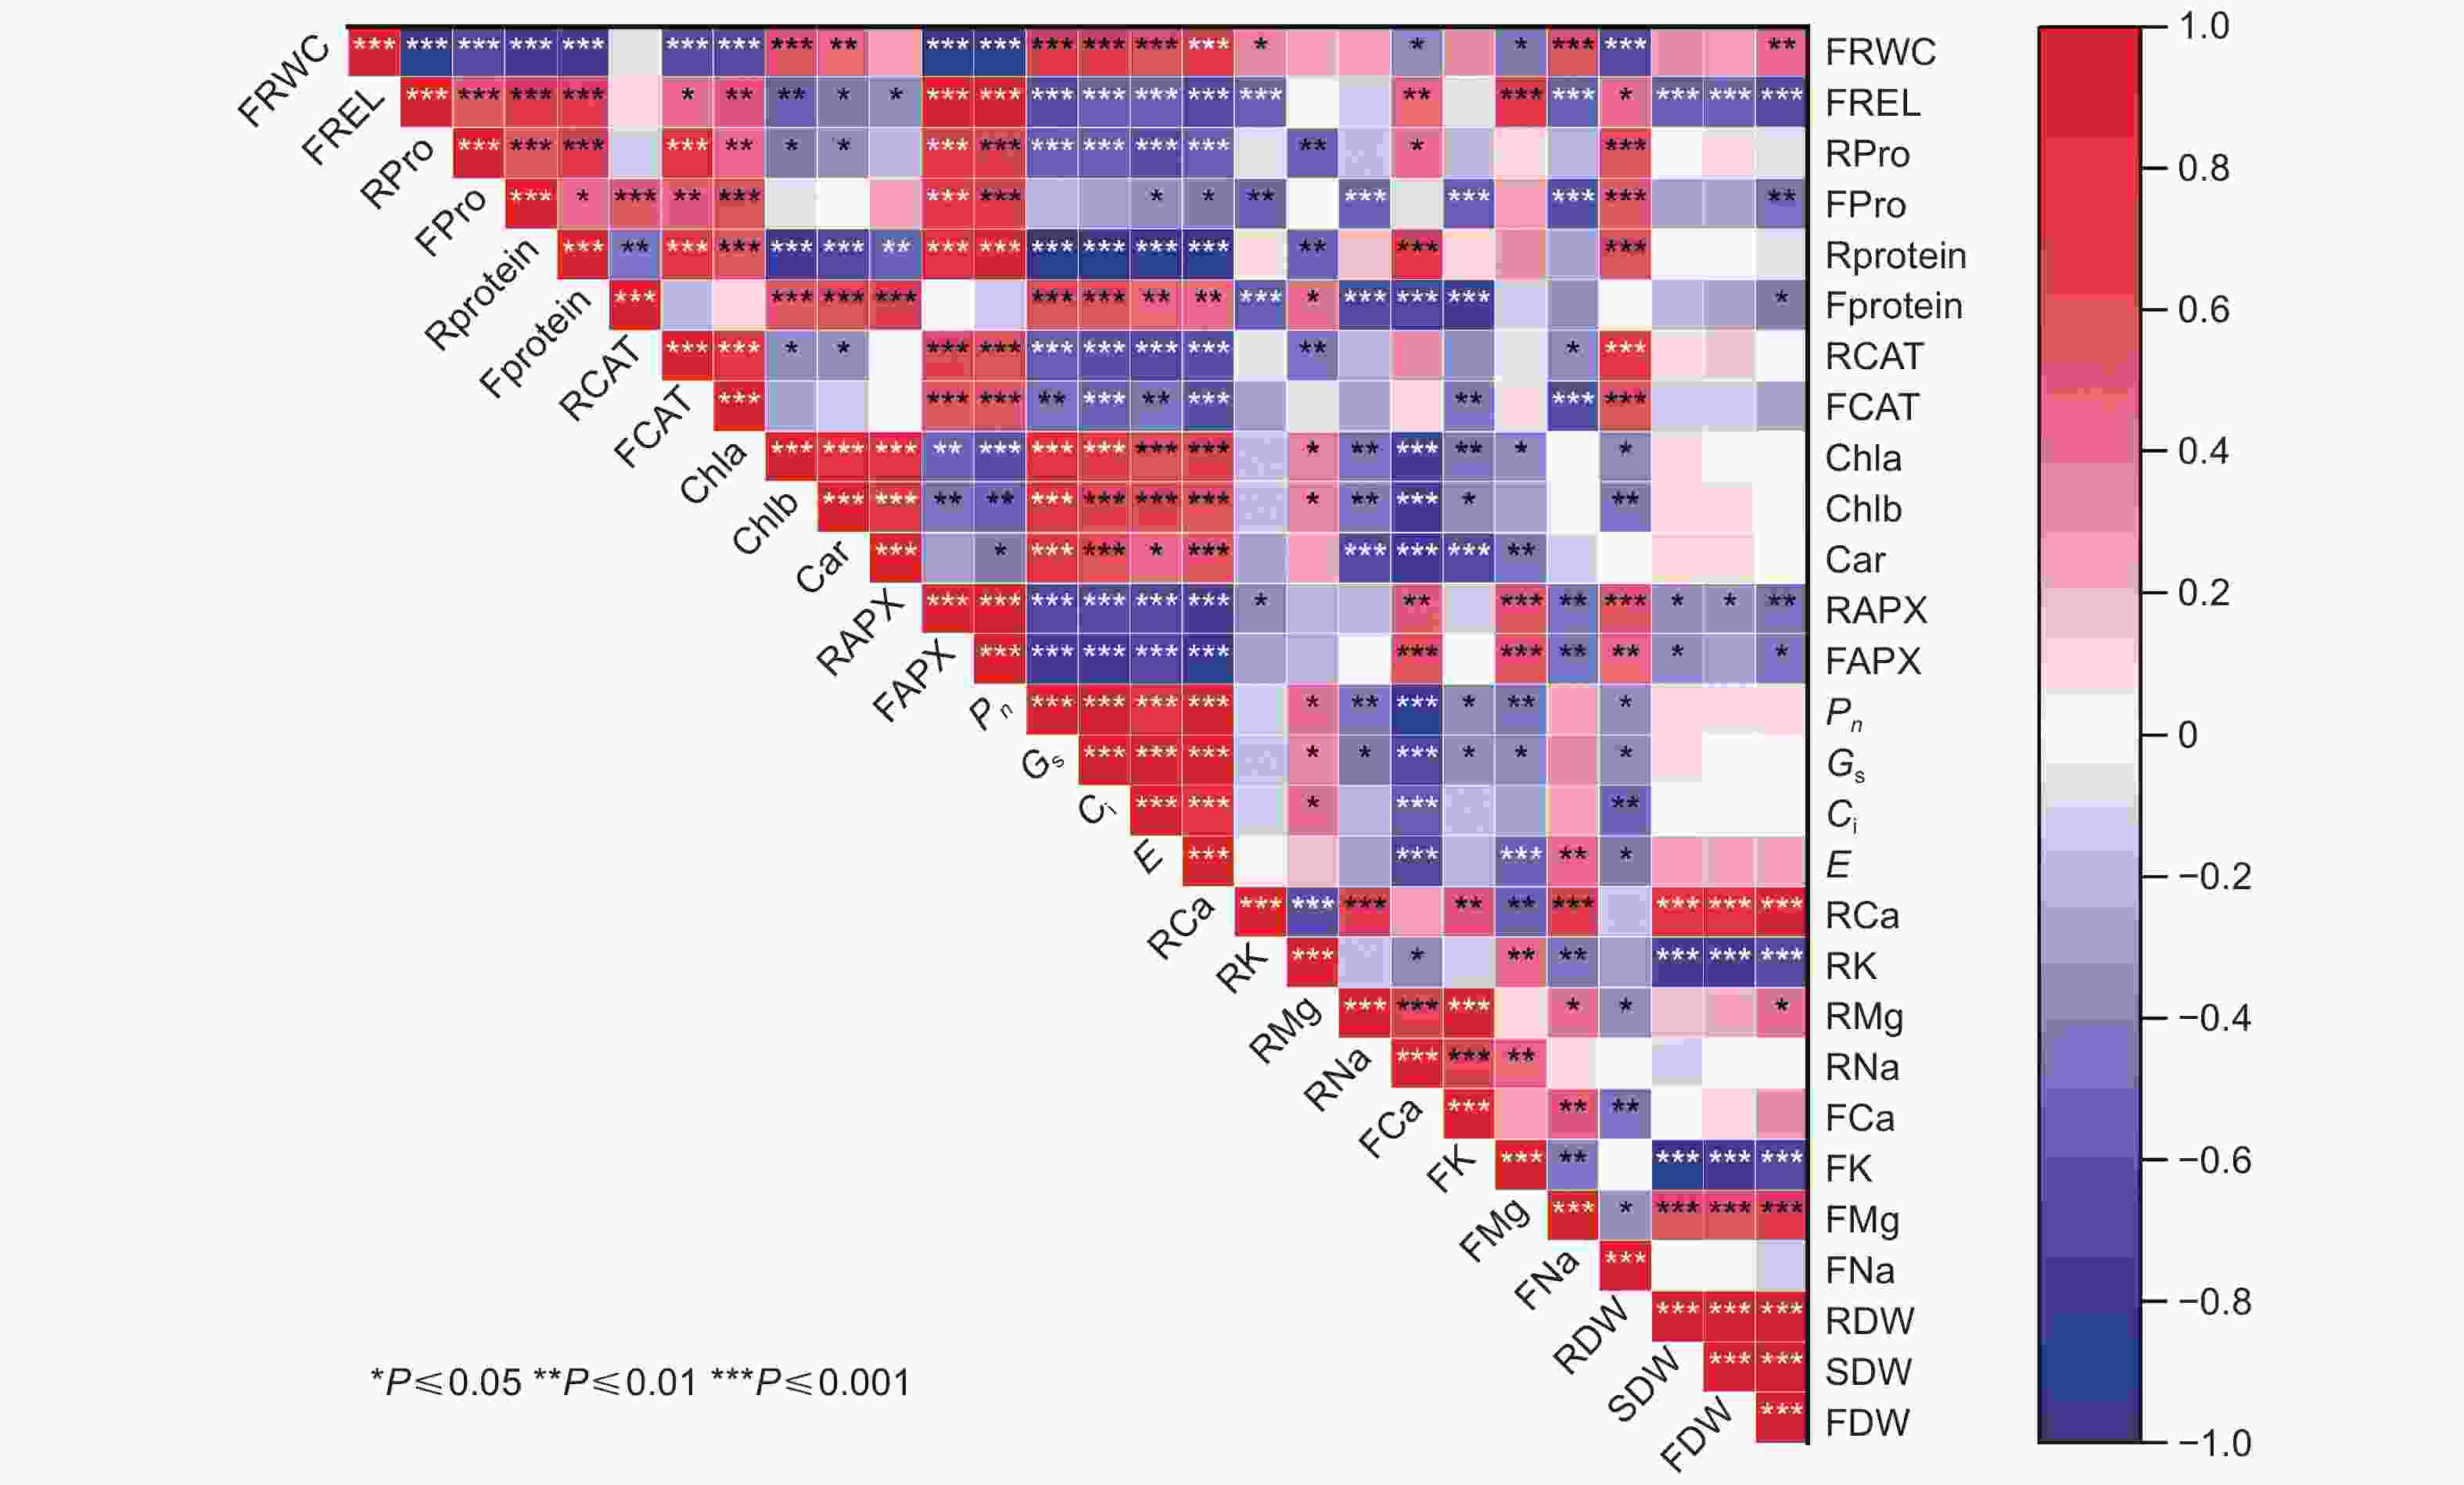
Figure 3. Correlation coefficient matrix and significance of variation of 28 indexes of M. azedarach, U. pumila and R. pseudoacacia
-
对不同NaCl浓度下苦楝、白榆和刺槐幼苗的这些指标进行主成分分析,结果如表7。前4个综合评价指标(CI)的贡献率分别为42.8%、25.6%、15.6%和3.9%,累计贡献率为87.9%,已经对苦楝、白榆和刺槐幼苗的大多数指标信息给出了充分的概括,因此,可将28个初始测定指标转换为4个相互独立的综合指标,分别为 CI1、CI2、CI3和CI4。数据显示,对CI1贡献较大的指标有叶片相对含水量、根中可溶性蛋白质、根和叶中APX活性、净光合速率、气孔导度和蒸腾速率;CI2主要和叶中可溶性蛋白质、根和叶中Mg2+、叶中Ca2+和叶片干质量相关;在CI3中贡献较大的指标有根中CAT、根和叶中K+、叶中Ca2+ 和Na+、根和茎干质量;对CI4贡献较大的指标为气孔导读、蒸腾速率、根中K+、叶中Mg2+。同时根据28个直接测定指标在盐胁迫下的标准化值及各综合指标的特征向量系数,计算出苦楝、白榆和刺槐幼苗的4个综合指标值。
主成分 CI1 CI2 CI3 CI4 特征值 11.983 7.177 4.360 1.096 贡献率/% 42.800 25.632 15.572 3.913 累计贡献率/% 42.800 68.427 83.999 87.912 特征向量 FRWC 0.256 0.112 −0.108 −0.109 FREL −0.241 −0.144 −0.083 0.206 RPro −0.205 −0.006 0.212 0.219 FPro −0.154 −0.232 0.182 0.099 Rprotein −0.267 0.086 0.089 0.003 Fprotein 0.094 −0.300 0.116 0.198 RCAT −0.202 −0.010 0.282 −0.181 FCAT −0.179 −0.122 0.187 −0.440 Chla 0.217 −0.156 0.082 −0.191 Chlb 0.198 −0.156 0.088 −0.207 Car 0.159 −0.199 0.232 −0.120 RAPX −0.258 −0.101 0.045 0.216 FAPX −0.270 −0.051 0.010 0.050 Pn 0.264 −0.128 0.048 0.088 Gs 0.254 −0.118 0.004 0.286 Ci 0.236 −0.088 −0.075 0.097 E 0.268 −0.039 0.038 0.279 RCa 0.052 0.338 0.114 −0.090 RK 0.076 −0.236 −0.292 −0.292 RMg −0.033 0.290 −0.219 −0.170 RNa −0.202 0.199 −0.158 0.091 FCa −0.024 0.274 −0.288 −0.016 FK −0.157 −0.113 −0.338 0.070 FMg 0.131 0.259 0.011 0.392 FNa −0.167 −0.071 0.256 0.080 RDW 0.090 0.238 0.325 0.027 SDW 0.077 0.249 0.317 −0.005 FDW 0.103 0.296 0.215 −0.079 Table 7. The coefficients and contribution ratio of comprehensive indicators of principal component of M. azedarach, U. pumila and R. pseudoacacia seedings
-
苦楝、白榆和刺槐幼苗各综合指标的隶属函数值使用以下公式计算:μi= (Xi−Ximin) /( Ximax−Ximin)。其中,Xi为苦楝、白榆和刺槐幼苗的第i 个综合指标值,Ximin和Ximax 分别为该综合指标值中的最小值和最大值。根据公式求出苦楝、白榆和刺槐幼苗所有综合指标的隶属函数值(表8)。
树种/Species 综合指标值 隶属函数值 综合评价值 D CI1 CI2 CI3 CI4 μ1 μ2 μ3 μ4 苦楝 0.553 −3.159 1.142 0.388 0.999 0.000 0.910 1.000 0.693 白榆 0.555 3.114 1.515 −0.067 1.000 1.000 1.000 0.359 0.970 刺槐 −1.108 0.045 −2.657 −0.321 0.000 0.511 0.000 0.000 0.148 权重 0.487 0.292 0.177 0.045 注:CI为综合指标值
Notes: CI represents comprehensive indexTable 8. The value of comprehensive index, index weight, subordinative function and comprehensive evaluation of M. azedarach, U. pumila and R. pseudoacacia seedings
利用公式
$ Wi=Pi/\sum _{i=1}^{n}Pi $ ,根据各综合指标贡献率的大小计算各综合指标在主成分贡献率中的权重。其中,Wi表示第i个综合指标的权重;Pi表示苦楝、白榆和刺槐幼苗的第i个综合指标的贡献率。经计算,求得4个综合指标的权重分别为0.487、0.292、0.177和0.045。利用公式${D}=\sum _{i=1}^{n}[\mu i\times Wi]$ 计算苦楝、白榆和刺槐幼苗的综合耐盐性评价值(D)。结果发现,D值最高的为白榆(0.970)、最低的为刺槐(0.148),表明白榆幼苗的耐盐性在三者中最强,刺槐幼苗的耐盐性最弱(表8)。 -
使用灰色关联分析法筛选苦楝、白榆和刺槐幼苗的关键性耐盐指标。将3个树种的耐盐综合评价值(D,表8)及测定得到的28个指标作为一个整体。其中,耐盐综合评价值为因变量,其余生理生化指标为自变量。将自变量进行标准化处理后,计算因变量和各自变量之间的关联系数及关联度[8]。结果发现,根中游离脯氨酸和可溶性蛋白质含量,根和叶中CAT和APX活性,根中Ca2+和叶中Na+含量与苦楝、白榆和刺槐幼苗的耐盐性关联度较高(表9)。
指标
Index关联度
Correlation degree排序
SequenceFRWC 0.549 24 FREL 0.685 9 RPro 0.859 2 FPro 0.626 15 Rprotein 0.761 6 Fprotein 0.564 22 RCAT 0.869 1 FCAT 0.784 3 Chla 0.612 18 Chlb 0.650 12 Car 0.613 17 RAPX 0.768 4 FAPX 0.738 7 Pn 0.558 23 Gs 0.545 25 Ci 0.575 20 E 0.529 27 RCa 0.704 8 RK 0.612 19 RMg 0.567 21 RNa 0.617 16 FCa 0.537 26 FK 0.521 28 FMg 0.631 14 FNa 0.762 5 RDW 0.665 10 SDW 0.639 13 FDW 0.661 11 Table 9. The degree of association of 28 salt indexes
-
土壤中过量的盐分会影响植物正常的生理发育过程,导致植物生长减缓、光合作用减弱、渗透调节物质和抗氧化酶活性改变等,最终阻碍了植物生物量的累积[5, 13-14, 21-22]。生物量作为植物耐盐性评价的最可靠指标,是植物响应盐胁迫的综合表现特征[23]。本研究中,NaCl抑制了苦楝、白榆和刺槐幼苗的生物量,并且对刺槐幼苗生物量的抑制最强。叶片相对含水量是衡量植物水分状况的重要指标之一,盐胁迫会降低植物根系向地上部分的水分运输[13]。本研究发现NaCl胁迫导致苦楝、白榆和刺槐幼苗叶片的相对含水量显著降低,且在300 mmol·L−1 NaCl处理下降低幅度大小为苦楝>刺槐>白榆。电解质渗透率是衡量植物细胞膜完整性的重要指标之一[24]。盐胁迫会导致植物叶片膜系统受损、电解质外渗,使电解质渗透率升高,在相同NaCl浓度下,三种幼苗叶片电解质渗透率升高幅度大小为刺槐>白榆>苦楝。叶片相对含水量下降及膜系统受损引起叶绿体结构破坏、叶绿素酶活性升高,导致叶绿体色素合成受阻或者分解加快[13, 25]。本研究发现,苦楝、白榆和刺槐幼苗叶片的色素含量在NaCl处理下出现不同程度下降[2],使植物光合作用受阻、光合参数降低。在相同NaCl浓度下Pn降低幅度大小为刺槐≥白榆>苦楝。WUE反映了植物对外界环境的适应能力[13],Ls反映了NaCl胁迫对叶片气孔通过气体能力的影响。NaCl处理使苦楝、白榆和刺槐幼苗叶片的WUE和Ls升高,说明NaCl提高了三种幼苗叶片的WUE但限制了气孔功能。
盐胁迫破坏植物的渗透势,导致细胞内渗透失衡[26-27]。脯氨酸和可溶性蛋白质是调节植物细胞渗透势的重要有机物质,能够增强植物对盐胁迫的适应能力[28-31]。本研究中,苦楝、白榆和刺槐幼苗根和叶中游离脯氨酸含量,以及根中可溶性蛋白质含量在受到NaCl胁迫后增加,其中苦楝根中积累量高于白榆和刺槐,表明苦楝根的渗透调节能力强于白榆和刺槐。盐胁迫还对植物造成氧化胁迫,使植物体内抗氧化酶活性增强[13, 26, 32-33],从而加快对细胞内过量活性氧的清除,抑制细胞膜的过氧化,尽可能保证植物正常的生理代谢过程[34]。本研究发现,苦楝、白榆和刺槐幼苗根和叶中CAT和APX的活性在受到NaCl胁迫后均显著升高,并且在同一NaCl浓度下,白榆幼苗根中CAT活性最强,苦楝幼苗叶中CAT活性强于白榆和刺槐;根中APX活性大小排序为白榆>刺槐>苦楝,叶中APX活性强弱排序为白榆>苦楝>刺槐,表明白榆清除活性氧、维持细胞膜稳定的能力强于苦楝和刺槐。
矿质离子在植物适应盐胁迫过程中起着重要作用[5, 28]。本研究中,NaCl胁迫导致苦楝、白榆和刺槐幼苗根和叶中Na+ 含量显著升高,并且苦楝幼苗根中Na+ 升高程度小于白榆和刺槐,但叶中Na+ 却相反;表明在较高浓度的NaCl胁迫下,白榆和刺槐倾向于把Na+ 留存在根中,而苦楝则倾向于把Na+ 转移到叶中。同时,苦楝幼苗叶片的离子选择运输系数SK,Na、SCa,Na 和SMg,Na 在受到NaCl胁迫后显著增加,表明K+、Ca2+ 和Mg2+ 向叶片的选择性运输增强;而白榆和刺槐幼苗的离子选择系数变化趋势与苦楝幼苗并不一致。这表明,三种幼苗可能采取了不同措施应对NaCl胁迫。
植物的耐盐性是受众多指标控制的综合性状,而各指标间也存在着相互关系[35]。因此,通过单一指标存在局限性,不能有效的评价不同植物的耐盐性,而采用生长、生理、生化等多种指标可以准确的筛选耐盐性植物 [9-10, 35]。本研究通过相关性分析、主成分分析、隶属函数法及灰色关联分析等方法对苦楝、白榆和刺槐幼苗的耐盐性进行综合评价,并筛选关键的耐盐性鉴定指标,发现白榆幼苗的耐盐性最强,刺槐幼苗的耐盐性最差。然而,植物在不同的土壤中以及不同的生长发育阶段,其耐盐性是不同的。而本文仅探讨了苦楝、白榆和刺槐幼苗适应NaCl胁迫的生长、生理、生化指标变化,故此仍需深入研究它们在土壤盐分环境中的响应差异。
-
本研究采用生长、生理、生化指标来评价苦楝、白榆和刺槐幼苗的耐盐能力,分析比较了三者在不同NaCl浓度下的生长、生理和生化响应差异,并通过综合评价,初步确定了苦楝、白榆和刺槐幼苗的耐盐能力强弱为白榆>苦楝>刺槐。同时,发现根中游离脯氨酸和可溶性蛋白质含量、根和叶中CAT和APX活性、根中Ca2+ 和叶中Na+ 含量与苦楝、白榆和刺槐幼苗的耐盐性关联度较高,这些指标反映了苦楝、白榆和刺槐幼苗响应NaCl胁迫下的渗透调节能力、抗氧化能力和对离子的选择吸收转运能力,可以用来评价苦楝、白榆和刺槐幼苗对盐胁迫的适应能力。
Comprehensive Evaluation and Index Screening of Salt Tolerance for Three Afforestation Specie Seedlings in China
- Received Date: 2023-08-16
- Accepted Date: 2024-02-26
- Available Online: 2024-04-01
Abstract:


 DownLoad: