


-
森林经营是林业发展的永恒主题,森林经营的原理就是遵从自然规律进行既定目标的森林结构调整[1-2]。森林结构影响林木之间的竞争、大小差异、更新、生长以及死亡[3-5],并决定了森林的功能、健康程度和未来的发展[6]。森林结构由空间结构和非空间结构组成[7]。近年来, 人们越来越重视通过调整林分的空间结构以发挥森林多功能作用[1, 7];而调整林分结构的前提是要充分了解经营林分的空间结构,所以, 如果可以找到有效的林分试验设计方法,便可以提高森林经营试验的精度,减少误差。利用完全随机优化设计方法可以有效的减小林分不同处理间的林分状态差异[8];而不论应用何种试验设计方法,都涉及到样地中小区的划分[9-10],为减少小区边缘相邻木之间的影响,提高试验的准确性,可以在小区间设置合理大小的隔离带,或者采用抽样调查的方法以减小这种影响带来的误差。因此如何更好地利用林分调查数据,通过对数据的处理而获取有效的数据信息并进行分析显得尤为重要。目前, 有关林分空间结构调查已有成熟的抽样调查方法,特别是基于相邻木关系的点抽样调查,由于其具有较高的工作效率、精准的数据测量以及受野外地形因子影响较小等优点[11]被广泛应用。该方法在确保一定精度和可靠性的前提下,通过调查一定的样本量(抽样点数)就可以测算出整体林分的状态特征(空间与非空间结构参数)。
森林经营试验通常需要增加重复次数来提高试验精准度。利用全面调查数据和完全区组设计方法进行经营时,处理个数多于4~5个,一般需设置3~6次重复[12];如处理间变异系数很大,则需要7~9次[13];当处理数大于7或10时,最少需要重复3次[9]。抽样调查方法以抽样个数为试验重复,而根据抽样单元内距抽样点调查的株数不同又分为不同的方法,如6株木法是指测定距样点中心最近的6株木,并用这些样本单元的数值去估测整体林分的方法,用6株木法测定了落叶松人工林的蓄积量, 估计精度在80%以上[14],且易于操作、节省时间、受森林结构复杂性程度影响较小和受空间与林分大小的限制较小[15]。在林分结构抽样调查中,当采用样点中心最近的4木[11, 16]为样本单元时,天然林林木空间分布格局调查时的最小样本量为49个点[17],调查人工林空间结构最小样本量的研究还未见报道。因此,如何将样地数据调查分析更好地应用于森林经营试验,是该研究的主要内容,主要有以下几个方面:(1)确定试验小区间最合理的隔离带距离, 确定隔离带不同时可满足试验要求的小区重复次数; (2)当对样地进行点抽样调查时,确定抽样点周围需要调查的最小株数(n)以及抽样点的个数等等。这些问题的解决有助于节约试验成本,提高研究效率,特别对于在环境条件相对一致且地段面积有限的林地上进行多因素试验尤为重要。
HTML
-
研究林分位于北京市门头沟区东南部的九龙山,属北京西部山系(115°59’~116°07’E,39°54’~39°59’N),海拔130 m,坡度20°。大陆性季风气候,年平均日照时数2 621.1h,年平均气温11.7℃,全年平均降水650.4 mm,主要集中在7、8、9月。土壤以山地棕壤为主。试验林分植于20世纪70年代。林分具体特征见表 1。
平均树高
Mean height/m平均胸径
Mean DBH/cm林分密度
Number of trees/
(株·hm-2)树种组成
Species composition郁闭度
coverage断面积
Basial area/
(m2·hm-2)角尺度
Uniform angle index大小比数
Dominance混交度
Mingling7.2 10.1 2 331 10侧-其它 0.85 20.3 0.428 0.490 0.196 Table 1. The characters of Platycladus orientalis plantation in Beijing Xishan Mountain
-
在京西山地人工侧柏试验地内设置1个大样地(图 1),分为24个面积为15 m×12 m=180 m2的小区,依次编号(1~24号)。该林分计划施行包含4个处理的森林经营试验,分别为结构化森林经营、结构化森林经营与割灌、割灌和对照。利用完全随机优化设计方法将小区分为4组,每组6个重复。利用全站仪(Topcon_GTS600)对各小区的林木进行每木定位,测量每木的胸径、树高,并记录树种及其健康状况。各小区参数见表 2。本研究中涉及到的林分空间结构参数计算和数据处理以及模拟抽取小区重复,均使用R语言编程软件完成。
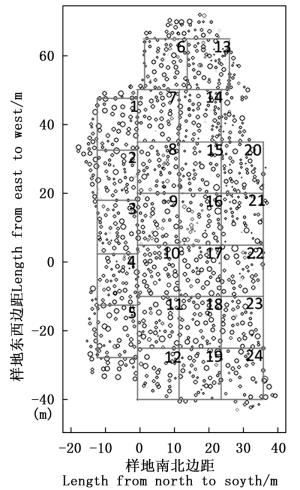
Figure 1. Arrangement and plot numbers in the sample stand
经营措施
Management小区编号
Plots平均树高(H)
Mean height/m平均胸径(D)
Mean DBH/cm角尺度(W)
Uniform angle index大小比数(U)
Dominance混交度(M)
Mingling结构化森林经营与割灌
Structure-based forest
management and
cutting brush14 7.972 11.378 0.383 0.484 0.117 15 6.189 8.972 0.452 0.473 0.069 16 7.948 11.208 0.375 0.550 0.044 17 7.828 10.975 0.431 0.475 0.169 18 6.547 9.676 0.478 0.551 0.015 7 6.955 9.164 0.425 0.528 0.179 割灌
Cutting brush22 6.484 10.028 0.470 0.520 0.300 13 7.002 9.809 0.441 0.516 0.245 19 7.468 10.479 0.414 0.493 0.132 6 7.321 10.444 0.419 0.512 0.285 8 7.863 11.384 0.388 0.500 0.053 2 6.602 9.515 0.447 0.441 0.351 结构化森林经营
Structure-based forest
management23 6.995 9.833 0.438 0.479 0.208 9 6.356 8.573 0.459 0.514 0.150 12 7.556 10.592 0.493 0.410 0.278 1 7.581 10.272 0.424 0.483 0.355 4 7.154 10.724 0.439 0.493 0.223 5 7.062 9.752 0.417 0.494 0.161 对照
Control20 6.987 9.804 0.428 0.478 0.256 21 8.036 11.018 0.410 0.506 0.269 24 6.037 8.410 0.474 0.513 0.051 10 6.473 9.668 0.419 0.494 0.250 11 7.458 9.991 0.461 0.472 0.261 3 7.400 10.457 0.473 0.473 0.134 Table 2. Basic parameters and spatial structure parameters of each plots
当改变小区隔离带距离或利用点抽样方法分析数据时,各小区林分状态也相应改变,因此,需要重新确定最佳隔离带距离及相应的小区重复个数、点抽样林木株数和最佳抽样点个数。因此, 本研究的数据处理方法主要分为2部分:(1)小区数据为全面调查数据,逐渐增加各小区间的隔离带距离,缩小每个小区的调查面积,找到最佳的隔离带大小;(2)只调查距离各小区中心点最近n(n=4~12)株的林木,找到最佳调查林木株数。这2种方法都涉及到小区重复,而不同小区作为重复时,得到的结果存在差异,为了避免这种不确定性,在研究小区重复时,采取了随机抽取小区的办法, 也就是在24个小区中随机抽取m个作为重复,计算各参数的均值并与样地真值比较,这个过程进行1 000次,统计这1 000次中满足条件的次数,当有90%或以上概率满足要求时,则认为结果是可靠的。
-
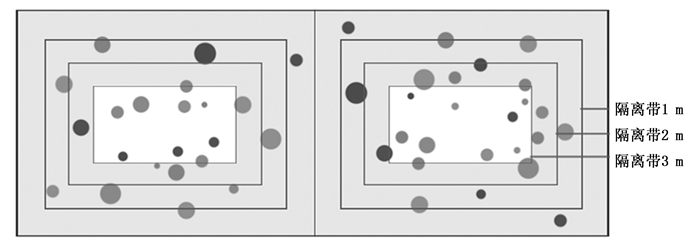
在本研究中将样地中小区设置为15 m×12 m,对调查得到的数据进行分析时忽略各小区边缘一定范围内的林木,划定隔离带,增加小区间隔距离,以减小相邻小区间距离较近的林木相互影响。为了研究小区间隔离带的最适距离,依次增大小区间的间隔距离(图 2)。分别设置为1、2、3、4 m,小区的调查面积相应减小为13 m×10 m、11 m×8 m、9 m×6 m、7 m×4 m。计算所有24个小区不同隔离距离下的基本参数(胸径D、树高H)与空间结构参数(角尺度W、大小比数U、混交度M)均值并与大样地进行比较, 其中,角尺度W的相似性以相同分布格局为准:当W>0.517时,林分为团状分布;W <0.475时为均匀分布;W处于[0.475,0.517]时为随机分布。混交度M为[0,0.25),[0.25,0.75],(0.75,1]时,分别为轻度混交、中度混交和强度混交标准,其它参数以相差10%以内为标准。在进行林分状态比较时,应用以上所有参数。
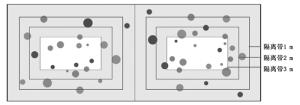
Figure 2. The distance of isolating neighboring plots (grey part are isolated area and the white part are core area for trial)
当固定隔离带距离时,用计算机模拟的方法,随机在24个小区中选择n(1~23)个小区作为重复,计算不同重复小区个数的林分基本参数和空间结构参数并与真值进行比较。当n取值不同时,分别进行1 000次随机模拟,以期找到在不同隔离带大小时最少的小区重复次数。
-
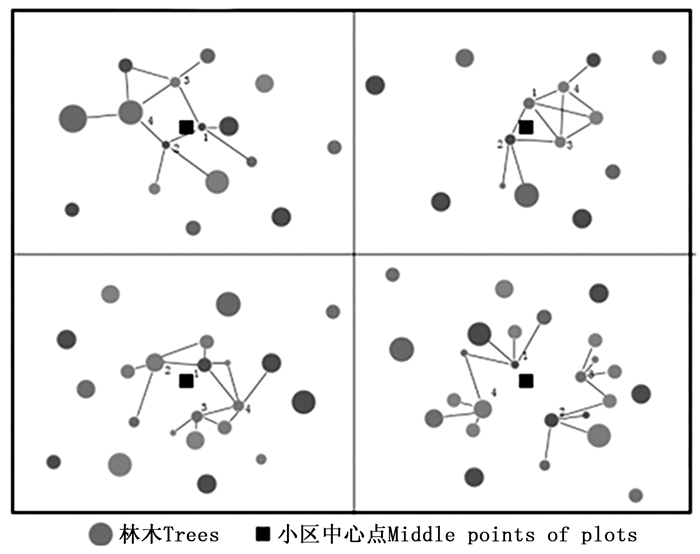
设置每个小区的中心点为抽样点,计算距离抽样点最近n(n=4,5……12)株林木的基本参数与空间结构参数的平均值并与大样地林分状态比较。图 3为调查n=4株木为例的调查方法,以调查林木不重复为原则,黑色方块为小区中心点。在该样地中, 横向为每隔12 m、纵向每隔15 m都有一个抽样点,其他株数的调查方法雷同。

Figure 3. Method to investigate n trees around the middle points (for example as n=4)
当随机抽取n(1~23)个小区时,为确定与样地林分状态基本一致的重复小区数,首先在24个小区中随机抽取任意n个小区(无重复),计算这n个小区各参数平均值并与大样地林分状态比较。调查不同株林木时各重复1 000次,以期找到最佳的小区重复次数。
2.1. 数据调查和处理
2.2. 隔离带距离的确定方法
2.3. 小区中心点最近林木株数的确定方法
-
当隔离带由1 m增加到4 m时,小区的调查面积由130 m2逐渐减小至28 m2,得到表 3中24小区基本参数与空间结构参数均值。与大样地参数相差不大,说明当调查区域达到一定面积时,与大样地的基本参数、空间结构参数有一定相似性,尤其当隔离带为2 m时最相近。
隔离带
Distance/m平均树高(H)
Mean height/m平均胸径(D)
Mean DBH/cm角尺度(W) Uniform
angle index大小比数(U)
Dominance混交度(M)
Mingling平均剩余株数
Trees remained/株1 7.054 9.975 0.469 0.489 0.176 30.2 2 7.180 10.181 0.434 0.490 0.193 21.1 3 7.225 10.128 0.426 0.491 0.194 12.6 4 7.218 10.043 0.430 0.491 0.200 6.5 大样地Stand 7.200 10.100 0.428 0.490 0.196 —— Table 3. Basic parameters and spatial structure parameters with different distance of isolating for 24 plots
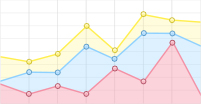
由表 3中数据与大样地数据得到的相对误差见图 4。在图 4中,当小区间的隔离带设置为2 m或3 m时,基本生长参数和空间结构参数与大样地的相对误差均小于5%,其中,当隔离带为2 m时,也就是当小区面积为88 m2时的相对误差最小。因此,进行全面调查时,小区间的隔离带应设置为2 m。即相邻小区间的距离为4 m。
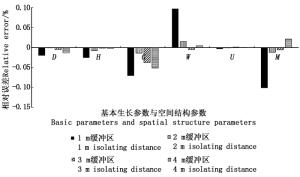
Figure 4. The relative error between plots and stand of basic parameters and spatial
-
当隔离带大小不同时,需要不同个数的重复。当隔离带越小、核心调查面积越大时,需要的重复越少。当隔离带为1 m时,任意抽取5个小区作为重复即可达90%以上的概率与样地林分状态基本一致;当隔离带为2 m时也只需要6个重复;隔离带达到最大即4 m时,最多只需要11个重复。当重复个数达到19个或更多时,不论小区间的隔离带多大,均有100%的概率与林分状态相似。表 4给出了不同隔离带时,1 000次模拟随机抽取n个小区作为重复达到与样地林分状态相似的个数。当重复大于19个时,1 000次随机抽取的结果都与大样地林分状态相似的。
随机抽取
小区个数(n)
Number of plots/个隔离带距离Distance of isolating/m 1 2 3 4 1 288 239 419 260 2 596 536 527 447 3 736 679 619 535 4 830 794 719 611 5 913 841 769 672 6 925 901 845 714 7 973 934 886 763 8 984 964 900 794 9 990 970 930 855 10 996 985 953 853 11 999 993 974 902 12 999 994 979 918 13 1 000 1 000 994 953 14 1 000 1 000 994 973 15 1 000 999 995 981 16 1 000 1 000 996 994 17 1 000 1 000 1 000 998 18 1 000 1 000 1 000 999 Table 4. The number of times of similar stand state between n plots and sample stand when selected n plots randomly for 1 000 times
-
当改变每个小区点抽样附近株数时,得到的基本参数与空间结构参数也随之改变。表 5为调查抽样点最近4株至12株林木24个小区均值的变化。将不同抽样结果的参数与大样地参数比较得到其相对误差。当选取的抽样点附近的树木过少时,误差相对较大,可达到40%。当抽样点达到4个时,除了混交度(M)误差为-12.24%,其余基本参数与空间结构参数其误差基本控制在15%以内。当抽样点达到5个时,误差可控制在10%以内,其中,以6株木为佳,其误差均在5%内。当改变小区中心点最近调查林木株数时,得到的基本参数与空间结构参数也随之改变。
调查株数
Number of trees/株平均树高(H)
Mean height/m平均胸径(D)
Mean DBH/cm角尺度(W)
Uniform angle index大小比数(U)
Dominance混交度(M)
Mingling4 7.266 10.035 0.432 0.492 0.172 5 7.168 9.913 0.421 0.510 0.206 6 7.176 10.045 0.427 0.493 0.203 7 7.138 9.976 0.421 0.502 0.214 8 7.127 9.949 0.421 0.504 0.204 9 7.144 9.961 0.424 0.502 0.206 10 7.152 9.979 0.424 0.501 0.208 11 7.175 10.050 0.431 0.492 0.206 12 7.201 10.079 0.435 0.488 0.208 大样地Sample stand 7.200 10.100 0.428 0.490 0.196 Table 5. The change of basic parameters and spatial structure parameters when investigating different number of neighboring trees around the middle points
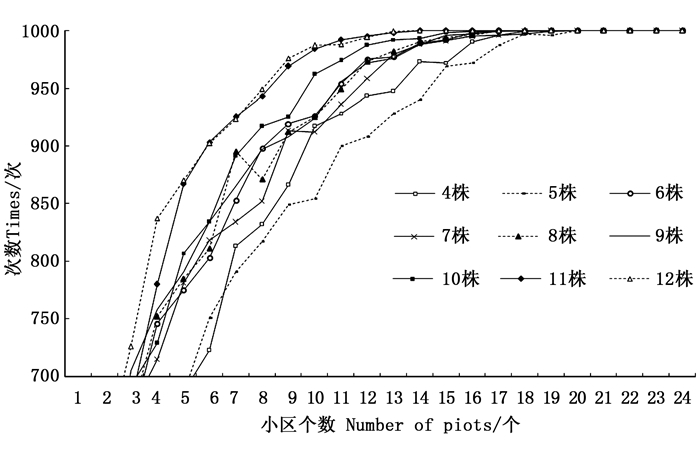
随后研究了当调查株数不同时需要的重复。随机抽取n(1~23)个小区作为重复,统计模拟1 000次时其小区均值与大样地相似的概率(图 5)。随着调查株数的增多,需要的重复逐渐减少。当调查株数达到6株时,只需要9个小区即可与大样地林分状态相近;当达到11株或12株时,只需要6个小区即可。当重复的小区个数达到22个或更多时,不论每个小区调查的株数多少,都有100%的概率可以满足与大样地参数基本相似的要求。

Figure 5. The number of times of the investigating results similar to the stand when changing the number of neighboring tree around the middle point or repeat times
调查不同株数时,林木代表的面积不同。一般来说,调查株数越多代表的面积越大,调查株数距离中心点最远的1株林木距离边缘也越近。研究统计了调查不同株数时距离各小区边界的距离,从表 6可见:当调查株数逐渐增加时,距小区边界逐渐减小。当调查4株时,第4株林木距小区边缘的平均距离约为4 m,当调查林木增加至10株以上时,最后1株林木到小区边缘的平均距离约为3 m。这从另一个方面反应出小区间间隔的程度,说明2个小区间的隔离带只要小于3即可。在上文中将小区之间的隔离带设置为2 m。
项目Item 调查株数Number of trees/株 4 5 6 7 8 9 10 11 12 平均距离
Mean distance/m4.8 4.7 4.1 4.1 3.6 3.4 3.3 3.2 3.0 Table 6. The distance between the farthest trees from middle points and edge of plots when investigating different number of trees
3.1. 隔离带的确定
3.1.1. 隔离带大小对林分状态的影响

3.1.2. 隔离带与小区重复
3.2. 距离中心点最近林木调查株数的确定
-
将小区的调查面积设置为88 m2时,其基本参数与空间结构参数与大样地林分状态最为接近,其与大样地的误差均小于2%,其中, 角尺度(W)的相对误差只有-0.14%。将各小区调查面积设置为88 m2, 以保证其与大样地林分状态基本相似,小区重复后的各参数与大样地相似度可达到98%以上,且只需要6个重复小区就可达到90%概率与样地林分状态相似。因此,在该林分经营试验中将小区间的隔离带设置为2 m,也就是相邻的小区间距为4 m。
当只对各小区中心点附近林木进行调查比较时发现,选取林木株数过少则误差相应增大,当选取树木达到4株时,小区各参数与大样地林分相似度达85%;当抽样点附近树木达到5个时,小区各参数与大样地林分相似度达90%, 其中,以6株木为佳,小区各参数与大样地林分相似度达95%。当选取6株木为调查对象时,逐渐减少重复小区,开始相对误差变化较小,表明与林分状态仍很接近,直到重复小区减少到11块时,林分基本参数与空间结构参数与大样地误差均保持在5%以内;当重复小区继续减少时,误差开始明显增大,一些参数的相对误差可超过10%。当减少为7块小区时,误差可达到20%以上。若调查林木选取为11株以上时,只需要6个重复即可保证与大样地林分特征一致。
研究首先尝试了当设置小区之间的隔离带分别为1、2、3、4 m时,其各项参数与不设置隔离带的各小区的参数比较。显然,当隔离带逐渐增大、小区调查面积逐渐减小时,与其本身参数相近的小区个数越来越少。当隔离带为1 m时,只有1/3的小区偏离了原来的取值,而当隔离带增大到4 m时,只有1/3的小区没有偏离原来的取值。这一结果说明设置隔离带后并不能准确的表达小区原本的林分状态,而应设置重复。研究这个问题涉及到2个变量:隔离带的最佳距离和最少重复个数。本研究的结果也证实当小区隔离带过小为1 m时误差相对更大,2 m误差最小,重复6次最为适宜;而对距小区中心点最近林木的研究发现,当选取6个小区作为重复时,需要11株或更多林木,而距小区中心点最远的林木到小区边缘的平均距离约为3 m,这也从另一个方面说明,小区间的隔离带不能大于3 m。因此, 对于该样地来说,应将小区间的隔离带设置为2 m,相邻小区间的间距为4 m。
在抽样调查中,分别研究了4株至12株的调查方法。从理论上分析,株数越多,调查覆盖面积越大,精度应越高,但从计算结果来看,7株至12株的效果并不比6株好,这可能是由于样圆过大时林木分布不均,林间空地、林道等多方面对其产生了影响。在调查较少株数时这种情况较少,而增大样圆面积无疑会增加这种情况发生的概率。这个结果与刘凤阁等[20]的6株调查优于20株调查效果的结论相似。
-
(1) 将小区的调查面积设置为88 m2时,其基本参数与空间结构参数与大样地林分状态最为接近,其与大样地的误差均小于2%,且只需要6个重复小区就可达到90%概率与样地林分状态相似。因此,在该林分经营试验中可将小区间的隔离带设置为2 m,也就是相邻的小区间间距为4 m。
(2) 在对该样地进行抽样调查时,调查12个小区内距中心点最近的4株木即可满足调查的要求,或6个小区内各调查距中心点最近的11株林木。
 DownLoad: