• 中国中文核心期刊
  • 中国科学引文数据库(CSCD)核心库来源期刊
  • 中国科技论文统计源期刊(CJCR)
  • 第二届国家期刊奖提名奖
Volume 32 Issue 2
Jul.  2019
Article Contents
Turn off MathJax

Citation:

Study on Azimuthal Variation of Sap Flow Velocity of Apple Trees in Loess Plateau Area, Western Shanxi Province

  • Corresponding author: DANG Hong-zhong, hzdang@caf.ac.cn
  • Received Date: 2018-06-20
    Accepted Date: 2018-11-05
  • Objective To determine the azimuthal character of sap flow velocity (Js) of apple trees. Method the thermal dissipation probe technology (TDP) was used to simultaneously and continuously monitor the sap flow velocity in the four locations of apple trees during the whole growing season in the loess region. The soil moisture and meteorological factors were measured simultaneously, too. Result The Js was significant different among directions (P < 0.01). The highest Js in the sapwood was observed in the north side with an average of 189.3 cm per day over the entire growing season, followed by that in the south side (83% of the north side) and the east side (80% of the north side). The Js from the west side was the smallest (63% of the north side). The Js of all sides showed seasonal dynamics, i.e. increasing in May-August, dropping in September-October, and nearly stopped in November. The Js showed an exponentially increasing relationship with the net radiation above canopy (Rn) as well as with vapor pressure deficit (VPD). On a typical sunny day, the diurnal peak time of Js in different directions appeared earlier than that of the VPD (1.6 hours in average with the maximum of 2.43 hours). The length of advancing time increased linearly with the increasing of the daily mean VPD. The time advancing reflects that the peak Js of apple was limited by VPD while over 2.0~2.2 kPa. The difference of time advancing between Js and VPD in four directions was not significant (P=0.97). Conclusion There are obvious azimuthal differences (P < 0.01) in the sap flow velocity of the apple tree. The Js in the north side and the south side are high than that of the east or the west side. However, the process of sap flow in different directions is consistent with the influence of atmospheric environment. In order to improve the accuracy of estimating sap flux of apple trees, the azimuthal difference should be taken into account in actual measurement.
  • 加载中
  • [1]

    Børja I, Světlík J, Nadezhdin V, et al. Sap flux-a real time assessment of health status in Norway spruce[J]. Scandinavian Journal of Forest Research, 2016, 31(4):450-457.
    [2]

    Nadezhdina N, Cermák J, Downey A, et al. Sap flow index as an indicator of water storage use[J]. Journal of Hydrology and Hydromechanics, 2015, 63(2):124-133. doi: 10.1515/johh-2015-0013
    [3]

    Roberts J. The role of plant physiology in hydrology: looking backwards and forwards. (Special issue: A view from the watershed revisited.)[J]. Hydrology and Earth System Sciences, 2007, 11(1): 256-269.
    [4]

    Aroca R. Plant Responses to Drought Stress: From Morphological to Molecular Features[M]. Springer, 2012.
    [5]

    Ryan M G. Tree responses to drought[J]. Tree Physiology, 2011, 31(3):237-239. doi: 10.1093/treephys/tpr022
    [6]

    Lu P. A Direct method for estimating the average sap flux density using a modified Granier measuring system[J]. Functional Plant Biology, 2001, 24(28):701-705.
    [7]

    Lubinda A K, Murray-Hudson M, Green S. Sap flow variation in selected riparian woodland species in the Okavango Delta, Botswana[J]. African Journal of Ecology, 2017, 55(4):654-663. doi: 10.1111/aje.2017.55.issue-4
    [8]

    Nadezhdina N. Revisiting the Heat Field Deformation (HFD) method for measuring sap flow[J]. Forest-Biogeosciences and Forestry, 2018, 11(1):118-130. doi: 10.3832/ifor2381-011
    [9]

    Zhao X H, Zhao P, Zhang Z Z, et al. Sap flow-based transpiration in Phyllostachys pubescens:applicability of the TDP methodology, age effect and rhizome role[J]. Trees-Structure and Function, 2017, 31(2):765-779. doi: 10.1007/s00468-016-1407-4
    [10]

    Granier A. A new method of sap flow measurement in tree stems[J]. Annales Des Sciences Forestieres, 1985, 42(2):193-200. doi: 10.1051/forest:19850204
    [11]

    Tsuruta K, Kume T, Komatsu H, et al. Azimuthal variations of sap flux density within Japanese cypress xylem trunks and their effects on tree transpiration estimates[J]. Journal of Forest Research, 2010, 15(6):398-403. doi: 10.1007/s10310-010-0202-0
    [12]

    Kume T, Otsuki K, Du S, et al. Spatial variation in sap flow velocity in semiarid region trees:its impact on stand-scale transpiration estimates[J]. Hydrological Processes, 2012, 26(8):1161-1168. doi: 10.1002/hyp.8205
    [13] 白志强, 刘华, 佘春燕, 等.西伯利亚落叶松树干液流的动态变化[J].河北农业大学学报, 2016, 39(3):49-54.

    [14] 马建鹏, 汪有科, 陈滇豫, 等.不同时间尺度上枣树树干液流的变异特性[J].干旱地区农业研究, 2016, 34(3):95-101.

    [15] 徐丹丹, 尹立河, 侯光才, 等.毛乌素沙地旱柳和小叶杨树干液流密度及其与气象因子的关系[J].干旱区研究, 2017, 34(2):375-382.

    [16] 李吉跃, 翟洪波.木本植物水力结构与抗旱性[J].应用生态学报, 2000, 11(2):301-305. doi: 10.3321/j.issn:1001-9332.2000.02.037

    [17]

    Čermák J, Nadezhdina N, Fernández E, et al. Application of a sap flow technique for characterizing the whole tree architecture, crowns and roots[J]. Acta Horticulturae, 2009, 846(846):219-228.
    [18]

    Komatsu H, Shinohara Y, Kume T, et al. Does measuring azimuthal variations in sap flux lead to more reliable stand transpiration estimates?[J]. Hydrological Processes, 2016, 30(13):2129-2137. doi: 10.1002/hyp.v30.13
    [19] 毕华兴, 云雷, 朱清科.晋西黄土区农林复合系统种间关系研究[M]:北京:科学出版社, 2011. 189.

    [20] 张静, 王力, 韩雪, 等.不同时间尺度下黄土塬区19年生苹果树干液流速率与环境因子的关系[J].中国农业科学, 2016, 49(13):2583-2592. doi: 10.3864/j.issn.0578-1752.2016.13.014

    [21] 蔡智才, 毕华兴, 许华森, 等.晋西黄土区苹果花生间作系统光合有效辐射及其对花生生长的影响[J].西北农林科技大学学报:自然科学版, 2017, 45(4):51-58.

    [22]

    Dang H, Zha T, Zhang J, et al. Radial profile of sap flow velocity in mature Xinjiang poplar (Populus alba L. var. pyramidalis) in Northwest China[J]. Journal of Arid Land, 2014, 6(5): 612-627.
    [23] 党宏忠, 张劲松, 赵雨森.应用热扩散技术对柠条锦鸡儿主根液流速率的研究[J].林业科学, 2010, 46(3):29-36.

    [24]

    Granier A. Evaluation of transpiration in a Douglas-fir stand by means of sap flow measurements[J]. Tree Physiology, 1987, 3(4):309-320. doi: 10.1093/treephys/3.4.309
    [25]

    Lu P, Urban L, Zhao P. Granier's thermal dissipation probe (TDP) method for measuring sap flow in trees:theory and practice[J]. Acta Botanica Sinica, 2004, 46(6):631-646.
    [26]

    Kume T, Komatsu H, Kuraji K, et al. Less than 20-min time lags between transpiration and stem sap flow in emergent trees in a bornean tropical rainforest[J]. Agricultural and Forest Meteorology, 2008, 148(6-7):1181-1189. doi: 10.1016/j.agrformet.2008.02.010
    [27] 赵平, 饶兴权, 马玲, 等.马占相思(Acacia mangium)树干液流密度和整树蒸腾的个体差异[J].生态学报, 2006, 26(12):4050-4058. doi: 10.3321/j.issn:1000-0933.2006.12.018

    [28] 党宏忠, 杨文斌, 李卫, 等.新疆杨树干液流的径向变化及时滞特征[J].生态学报, 2015, 35(15):5110-5120.

    [29] 党宏忠, 杨文斌, 李卫, 等.民勤绿洲二白杨树干液流的径向变化及时滞特征[J].应用生态学报, 2014, 25(9):2501-2510.

    [30] 刘家霖, 满秀玲, 胡悦.兴安落叶松天然林不同分化等级林木树干液流对综合环境因子的响应[J].林业科学研究, 2016, 29(5):726-734. doi: 10.3969/j.issn.1001-1498.2016.05.015

    [31] 赵春彦, 司建华, 冯起, 等.荒漠河岸胡杨(Populus euphratica)树干液流的时滞效应[J].中国沙漠, 2014, 34(5):1254-1260.

    [32] 徐世琴, 吉喜斌, 金博文.典型荒漠植物沙拐枣茎干液流密度动态及其对环境因子的响应[J].应用生态学报, 2016, 27(2):345-353.

    [33] 池波, 蔡体久, 满秀玲, 等.大兴安岭北部兴安落叶松树干液流规律及影响因子分析[J].北京林业大学学报, 2013, 35(4):21-26.

    [34] 孙慧珍, 孙龙, 王传宽, 等.东北东部山区主要树种树干液流研究[J].林业科学, 2005, 41(3):36-42. doi: 10.3321/j.issn:1001-7488.2005.03.006

    [35]

    Morgan H D, Barton C. Forest-scale sap flux responses to rainfall in a dryland eucalyptus plantation[J]. Plant and Soil, 2008, 305(1-2):131-144. doi: 10.1007/s11104-008-9558-8
    [36]

    Saugier B, Granier A, Pontailler J Y, et al. Transpiration of a boreal pine forest measured by branch bag, sap flow and micrometeorological methods[J]. Tree Physiology, 1997, 17(8-9):511-519. doi: 10.1093/treephys/17.8-9.511
  • 加载中
通讯作者: 陈斌, bchen63@163.com
  • 1. 

    沈阳化工大学材料科学与工程学院 沈阳 110142

  1. 本站搜索
  2. 百度学术搜索
  3. 万方数据库搜索
  4. CNKI搜索

Figures(5) / Tables(1)

Article views(3936) PDF downloads(141) Cited by()

Proportional views

Study on Azimuthal Variation of Sap Flow Velocity of Apple Trees in Loess Plateau Area, Western Shanxi Province

    Corresponding author: DANG Hong-zhong, hzdang@caf.ac.cn
  • 1. Institute of Desertification Studies, Chinese Academy of Forestry, Beijing 100091, China
  • 2. College of Desert Control Science and Engineering, Inner Mongolia Agricultural University, Hohhot 010018, Inner Mongolia, China
  • 3. Research Institute of Forestry, Chinese Academy of Forestry, Beijing 100091, China

Abstract:  Objective To determine the azimuthal character of sap flow velocity (Js) of apple trees. Method the thermal dissipation probe technology (TDP) was used to simultaneously and continuously monitor the sap flow velocity in the four locations of apple trees during the whole growing season in the loess region. The soil moisture and meteorological factors were measured simultaneously, too. Result The Js was significant different among directions (P < 0.01). The highest Js in the sapwood was observed in the north side with an average of 189.3 cm per day over the entire growing season, followed by that in the south side (83% of the north side) and the east side (80% of the north side). The Js from the west side was the smallest (63% of the north side). The Js of all sides showed seasonal dynamics, i.e. increasing in May-August, dropping in September-October, and nearly stopped in November. The Js showed an exponentially increasing relationship with the net radiation above canopy (Rn) as well as with vapor pressure deficit (VPD). On a typical sunny day, the diurnal peak time of Js in different directions appeared earlier than that of the VPD (1.6 hours in average with the maximum of 2.43 hours). The length of advancing time increased linearly with the increasing of the daily mean VPD. The time advancing reflects that the peak Js of apple was limited by VPD while over 2.0~2.2 kPa. The difference of time advancing between Js and VPD in four directions was not significant (P=0.97). Conclusion There are obvious azimuthal differences (P < 0.01) in the sap flow velocity of the apple tree. The Js in the north side and the south side are high than that of the east or the west side. However, the process of sap flow in different directions is consistent with the influence of atmospheric environment. In order to improve the accuracy of estimating sap flux of apple trees, the azimuthal difference should be taken into account in actual measurement.

  • 树木边材液流监测是表征树木蒸腾过程、诊断树木水分状况的有力工具[1-2],也是估算单株蒸腾量的有效手段之一[3]。边材液流速率的准确测定对于研究树木个体的生物学结构、水分利用特征及其对环境变化的响应,系统认识树木抗旱特征及水分利用策略[4-5]具有重大意义。

    以插针式为特点的热技术如热扩散(Thermal dissipation probe)、热脉冲(heat pulse methods)、热场变形技术(Heat field deformation)等技术正成为树木液流测定的最主要手段,并得到广泛运用[6-10],然而,越来越多的报道表明,树木边材液流速率可能存在着方位差异[11-12]。对于某一树种而言,方位差异是否都显著,是否有固定的关系可寻,目前仍没有统一的认识。如报道认为西伯利亚落叶松(Larix sibirica Ledeb.)南侧树干液流较高[13],而枣树(Ziziphus jujuba Mill.)西侧液流速率较高[14],旱柳(Salix matsudana Koidz)与小叶杨(Populus simonii Carr.)的方位差异关系不确定,或随季节而变化等[15]。这些研究结果提示我们,从某一方位测定的边材液流速率可能并不足以可靠地用于单株液流通量的估算,另一方面,方位差异可能与边材水力结构的非均质性[16]、树冠几何形状或根系分布的空间不对称性[17-18]等有关联,或与地球公转引起的太阳辐射有规律的年周期性变化而相关联。

    黄土残塬沟壑区是典型的旱作农耕区,这里光照充足、辐射能源丰富、昼夜温差大,已经成为全国最佳的苹果优生地区之一[19]。该区生产的苹果色艳质佳、产量高,是主要的经济来源,是当地的主导产业。精准确定果树单株在生长季的蒸腾用水规律是进行果园水肥管理的重要基础[20]。为此,本研究通过对果树不同方位边材液流速率的测定与比较,并分析其与主导环境因子如太阳辐射及大汽水分亏缺间的关系,旨在明确苹果树液流速率的方位特征,从而为通过测定液流来估算单株蒸腾用水量的方法提供更科学的依据。

1.   材料与方法
  • 研究区选择在属于黄土残塬沟壑区的山西省临汾市吉县,该地区年均气温10.2℃,年均日较差11.5℃,年均降水522.8 mm,大于10℃的有效积温3 361.5℃,霜期年平均172 d,多年平均日照时数2 538 h,属暖温带大陆性季风气候,春季干旱多风,夏季降雨集中;秋季多连阴雨,冬季寒冷干燥[21]。试验地具体选择在东城乡上社堤村,110°35.655′ E,36°04.739′ N,海拔910 m,所选样地为2000年建植的苹果园,面积为1.7 hm2,品种为红富士(Malus pumila Mill),栽植密度为4 m×6 m。果园布设有防雹网,经营管理技术完备(施肥、修剪、人工授粉、生草覆盖、铺设反光膜、套袋、病虫害防治等),果树处于经济成熟期,生长良好。

  • 在试验林分内架设包括7个要素的小型气象站(空气温湿度,AV-10TH;风速传感器AV-30WS;风向传感器AV-30WD;大气压力传感器AV-410BP; 净辐射传感器NR-LITE2;雨量传感器AV-3665R)(其中AV系列传感器来自于美国AVALON公司,NR系列传感器来自于荷兰Kipp & Zonen公司)。数采器为SQ2020(英国Grant公司)。所有探头均通过主杆与支架安装在果树冠层以上(离地面约3 m处)。采样间隔为10 min,记录间隔为30 min。

    大汽水分亏缺(VPD)的计算公式:

    式中:T为气温(℃),RH为空气湿度(%)。

  • 在样地内选择3处(株间、行的两侧带间)监测土壤水分动态。每处均在距表层50、100、150、200、250和300 cm处分别安装ECH2O土壤水分传感器,连接Em50数据采集器,采集间隔为30 min。

  • 试验苹果树品种为17龄红富士苹果,株行距为4 m×6 m,果树生长健壮,树体长势整齐,修剪量适中。选定3株冠形完整、生长健康的果树为试验样株,样株基本情况见表 1。采用Granier式热扩散传感器(TDP-3 cm,澳大利亚Plantsensor公司)测定果树树干边材的液流速率值。每个样株分别在东、南、西、北4个方位(根据手持罗盘仪确定)各安装1套TDP-3 cm,并连接32通道SQ2040数采器(英国Grant公司)。数据采集间隔为10 min,记录间隔为30 min。采用100 W多晶太阳能板接12V-100AH铅酸蓄电瓶连续供电。TDP安装过程及技术要点见文献[22-23]。边材液流速率的计算采用Granier公式。

    样株
    Samples
    胸径
    DBH/cm
    树高
    Height/m
    冠幅Crown width
    南-北×东-西
    S-N×E-W/(m×m)
    日平均液流速率值(平均值标准差)
    Means and standard deviation of daily sap flow velocity /(cm·d-1)
    北侧North side 南侧South side 东侧East side 西侧West side
    Tree 1 20.2 2.4 4.2×4.0 172.0±204.3 140.5±189.0 140.5±173.2 108.3±139.5
    Tree 2 21.5 2.5 4.4×4.2 175.2±231.0 122.8±170.5 103.2±154.2 77.4±122.5
    Tree 3 20.1 2.4 4.1×4.0 153.0±184.4 136.0±197.3 131.1±170.4 109.1±149.3

    Table 1.  Information of sample trees and statistics for sap flow velocity

    式中,ΔT为上下两探针间实际温差(), ΔT0为液流为零时上下两探针间的温差(最大值,℃),该值采用两次回归法确定[25-26]

  • 对样株在各个方位的液流速率值分别进行平均作为本研究分析的基础数据。JsVPDJsRn间的关系均采用指数函数(式3)进行拟合。选择典型晴天,对每个晴天液流速率的日变化过程(逐小时)采用Gauss模型(式4)进行拟合,来确定Js的峰值时刻,用同样的方法同步确定VPDRn的峰值时刻。不同处理中均值间差异的比较采用单因素方差分析方法,在统计软件OriginPro2017中完成,多重比较采用Tukey HSD post hoc在P < 0.05或0.01为显著性临界水平进行判断。图均在OriginPro2017中完成。

    式中abc均为参数。

    式中参数xc代表峰值时刻,参数y0代表基值(最小值),Aw分别为参数。

2.   结果分析
  • 试验期间共观测到69次降雨事件,总计降水量为334.4 mm,降水具有明显的季节分异特征,近1/3的降雨出现在7月份,其次为8月份(73.1 mm),该2个月份的降水占全年降水的54.2%。降水最少的月份为11月份,仅为0.4 mm,但整个生长季内03 m内土壤平均含水率(θ)并没有明显受降水波动的影响,各个月份θ值在16.09%~17.17%间变动,试验期间苹果树的土壤水分状况一直处在较优的状况(图 1a)。

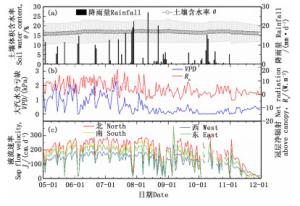
    Figure 1.  Seasonal dynamics of sap flow velocity(Js)along four directions of trunk, soil water content(θ)and the main meteorological elements in the site

    5—10月份,VPD表现出总体连续下降的季节变化趋势,其中5月份VPD日平均值为1.14 kPa,10月份仅为0.1 kPa,VPD日平均值最高出现在7月份,为2.27 kPa(图 1b)。冠层净辐射Rn的季节变化表现为先增(5、6月份)后减(7、8、9、10、11)的趋势,6月份Rn日平均值为8.43 W·m-2,试验期间Rn日平均的最大值出现在7月份,为18.60 W·m-2(图 1b)。

    各个方位的日平均液流速率Js表现出较一致的季节变化动态。从图 1c可以看出,整个生长季期间,液流速率的日平均值基本都呈北侧(189.3 cm·d-1) >南侧(157.6 cm·d-1) >东侧(151.6 cm·d-1) >西侧(118.4 cm·d-1)的方位格局,且差异显著(P < 0.05,F=34.9);最大值分别可达364.6,328.0,359.7,236.4 cm·d-1,各方位的最大值均出现在9月份。多重比较表明,北侧液流速率日平均值与其它方位间均差异显著(P < 0.05),西侧液流速率日平均值与其它方位间均差异显著(P < 0.05),而南侧与东侧液流速率日平均值差异不显著(P=0.82)。整个试验期间,北侧液流速率是4个方位平均液流速率的1.02~1.63倍。

  • 对液流速率Js与冠层净辐射Rn间的回归关系表明,Rn与不同方位液流速率间均呈较好的指数关系(图 2)。一般在Rn较低时(如Rn < 0.8 W·m-2), 各方位的液流速率均随Rn增加而上升的更快,表现出更强劲的正效应。其中北侧、南侧的液流速率更大,因此拟合曲线的斜率更大(参数b);西侧由于液流速率值普遍较低,反映在拟合曲线的斜率较小。太阳辐射对不同方位液流的传输均具有明显的正相关关系。

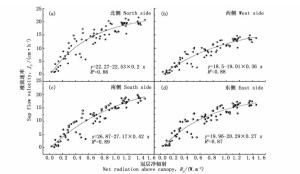
    Figure 2.  Sap flow density(Js)from each of four direction around trunk of apple trees varied with solar net radiation above canopy(Rn)

  • 苹果树不同方位的JsVPD间均具有良好的指数回归关系(图 3)。总体来说,JsVPD增加而增加,其增加的平均速率分别为:北侧4.7,南侧4.7,东侧4.1,西侧3.6 cm·h-1·kPa-1,北、南两侧液流速率随VPD的增加而快速升高。对拟合曲线求导数的结果表明,VPD在1.1~1.3 kPa是曲线变化的拐点,当VPD低于该值时,各方位的液流速率均随VPD的增加而快速上升,表明大汽水分亏缺对液流速率强劲的驱动效应。而当VPD高于该拐点时,液流速率随VPD而上升的趋势变缓,当VPD达到更高值时(东、西、北侧VPD> 2.0~2.2 kPa,南侧VPD> 2.5 kPa), JsVPD的变化趋势表现出平台效应,表明此时VPD值对冠层气孔的开放度表现出明显的抑制效应,气孔调控使得树木不至于损失更多水分。

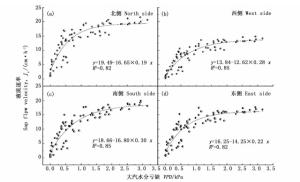
    Figure 3.  Sap flow velocity(Js)from each of four direction around trunk of apple trees varied with VPD

  • 为便于确定峰值时刻,逐日对不同方位JsVPD的值标准化,并逐日进行拟合(式4)求得峰值出现的具体时刻。对比结果表明,不同方位的液流速率值的日变化格局基本一致,表现出较明显的宽峰特征。各方位液流速率均表现出明显提前于VPD。整个试验期间,JsVPD间峰值时刻差异的时长(TJ-V)的变化范围分别为:北侧0.36~2.30 h、南侧0.23~2.42 h、东侧0.32~2.27 h、西侧0.13~2.43 h。不同方位间TJ-V差异不显著(P=0.97)。

    进一步分析表明,各方位的TJ-V均随着VPD日平均值的增加而增大(图 4),VPD的增加会激发气孔调控敏感度的加强,气孔较早地降低导度或关闭,反映在树木个体上将使液流速率峰值较早地出现,从而加大时长。

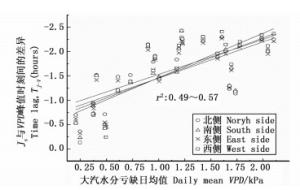
    Figure 4.  Relationships between time lag of TJ-V and daily mean vapour pressure deficit(VPD) in typical sunny days

3.   讨论
  • 果树由于较频繁的修剪,其冠层结构以及树干木质部结构的变化较大,成年树的偏心现象、边材分布不对称现象比较普遍。本研究中监测到黄土区苹果液流速率呈北侧>南侧>东侧>西侧的总体的方位差异特征,这可能与北、南侧面向行间而东、西侧面向株间,前者对应着更广阔的根系分布和水分吸收能力有关(试验林行的走向为东西向)。然而,关于不同树种液流速率方位差异的规律,目前研究并没有一致的认识,甚至有完全相反的报道,如在黄土区对苹果树的测定认为南侧液流速率最大,北侧最小,东、西侧较为接近[20],尽管由于其观测时间较短(5 d),难于与本结果进行比较,但也说明果树液流方位差异的复杂性。如研究发现黄土丘陵区枣树表现为西向液流速率较高[14],而沙柳和小叶杨的方位差异关系不固定,并且随季节而变化[15]。本试验中也观测到不同季节方位差异相对大小的变化(图 1c)。对于经济林(人工林)树种而言,由于林分配置模式相对固定,及较频繁的修剪扰动带来的枝条空间分布、树冠致密性等树形特征的较大变化,使得树干木材结构分布的不对称性比较普遍(图 5),这可能是边材液流速率方位差异更为复杂的主要原因。

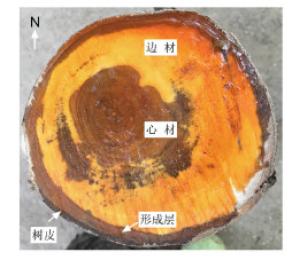
    Figure 5.  Asymmetrical distribution of wood structure, apple trees

  • 液流速率与气象因子峰值时刻差异的长短被认为是能够反映树体组织在夜间补充和储存的水分用于次日上午较早时间蒸腾所占的比例,并且是木质部水力传输阻力的有力测度[26]。与马占相思(Acacia mangium Willd.)[27]、新疆杨(Populus alba L.var.pyramidalis)[28]、二白杨(Populus gansuensis C. Wang et H. L. Yang)[29]、兴安落叶松(Larix gmelinii (Rupr.) Rupr.Kuzen)[30]、胡杨(Populus euphratica Oliv.)[31]、沙拐枣(Calligonum mongolicum Turcz.)[32]等这类生态树种相比,本研究中苹果树的TJ-V(最大值为2.43 h)时长相对比较大,这可能与果树冠层相对饱满、叶量大、树体贮存水分量大有关。但不同方位间的TJ-V没有显著性差异,这说明方位间的液流的差异可能与冠层光照时间或辐射量间没有紧密的联系,事实上,不同方位液流速率与VPD峰值时刻差异的长短与日平均VPD有较紧密的线性关系(图 5),因此,气象因子是影响苹果树液流速率时刻差异的主要因子。在本研究中,太阳辐射相对较高而不再是限制因子,而TJ-V值比较高,说明在半干旱黄土区VPD对树木蒸腾过程的限制作用比较明显。

  • 在众多的气象因子中,太阳辐射与大汽水分亏缺对叶片气孔行为具有主导作用,因而被许多研究证实为影响液流过程的主导气象因子(较短时间尺度)[33-35],而土壤水分的变化一般只在较长时间尺度上才可能对液流速率产生较明显的影响。本研究结果表明,苹果树不同方位的液流速率与冠层净辐射间具有较好的指数递增关系(图 2),反映了太阳辐射对蒸腾过程的直接驱动效应。但对于大气水分亏缺,只有当VPD> 2.0~2.2 kPa时,VPD的抑制效应突显出来,这一拐点值也在其它树种上得到了证实[36]

4.   结论
  • (1) 黄土高原苹果树液流速率表现出北侧>南侧>东侧>西侧的方位特征,各方位间差异显著(P < 0.01)。试验期间北侧日平均液流速率为189.3 cm·d-1,其它方位的日平均液流速率分别只占北侧的83%,80%和63%。

    (2) 不同方位间液流速率的变化均具有同步、一致性,不同方位液流速率与冠层净辐射、大汽水分亏缺间均呈较好的指数关系。各方位液流速率均表现出:5—8月份(枝叶快速生长期)总体表现出递增,9—10月份(果实成熟期)逐渐减少,11月份(落叶)基本停止的季节变化。

    (3) 不同方位间液流的日峰值时刻均提前于大汽水分亏缺(最大2.43 h),且提前时间与日平均大汽水分亏缺呈线性递增关系。当VPD大于2.02.2 kPa时,Js不再随VPD的增加而上升。

Reference (36)

Catalog

    /

    DownLoad:  Full-Size Img  PowerPoint
    Return
    Return