


-
特定树种或林型的木材生产潜能取决于立地质量和林分密度。目前,针对许多针叶树种、阔叶树种开展了林分密度或立地效应研究[1-9]。杉木(Cunninghamia lanceolata (Lamb). Hook.)是我国南方亚热带重要乡土速生针叶用材树种[10]。杉木人工林密度与立地效应研究开展较早,重点集中在密度或立地控制下林分树高、胸径、材积生长量、直径分布、自然稀疏规律、生长模拟预测等响应研究[11-18]。刘景芳和童书振等对杉木中带、南带、北带林分生长的密度与立地早期作用规律进行了系统分析[13],发现造林密度、间伐保留密度及立地指数显著作用于杉木林生长过程。已有研究大多是基于临时样地或林分生长发育中幼龄阶段,且研究区域主要为中亚热带,而在同样为杉木主产区的南亚热带,杉木林分生长的密度与立地效应的长期定位研究尚为空白。鉴于此,本研究基于广西凭祥36 a生杉木密度试验林定位观测数据,对杉木人工林林分蓄积生长量的长期密度与立地作用规律进行了研究,以期揭示南亚热带杉木林长期密度与立地效应,为区域杉木林高效培育提供理论与实践依据。
HTML
-
试验区位于中国林业科学研究院热带林业实验中心伏波林场,位于广西凭祥市境内(106°43′ E,22°06′ N),属南亚热带季风气候区,湿润半湿润气候。海拔500 m,低山,坡度25°~30°;母岩为花岗岩,土壤为红壤;光照条件极好,降水充沛,但夏湿冬干,10月至次年3月为干季,4—9月为湿季;年平均气温19.9℃,年均降水量1 400 mm,年均蒸发量1 200 mm。
-
大青山杉木密度试验林由中国林业科学研究院林业研究所设置于国家“六五”科技攻关期间,在1982年春采用1 a生杉木裸根苗营造,5种初植密度,分别为1 667、3 333、5 000、6 667、10 000株·hm-2(株行距分别为2 m×3 m、2 m×1.5 m、2 m×1 m、1 m×1.5 m、1 m×1 m,分别记为A、B、C、D、E)。采用随机区组排列,每个密度设置3块样地(A1、A2、A3,B1、B2、B3,C1、C2、C3,D1、D2、D3,E1、E2、E3),共15块样地,每块样地面积为600 m2(表 1)。每个小区周围各栽植2行相同密度的杉木作为保护带。
样地
Sample
plots初植密度
Initial density/
(trees·hm-2)年龄
Age/a调查次数
Survey
times立地指数级
Site index
class/mA1 1 667 1~36 20 14 A2 1 667 1~36 20 18 A3 1 667 1~36 20 16 B1 3 333 1~36 20 16 B2 3 333 1~36 20 14 B3 3 333 1~36 20 16 C1 5 000 1~36 20 16 C2 5 000 1~36 20 10 C3 5 000 1~36 20 16 D1 6 667 1~36 20 18 D2 6 667 1~36 20 16 D3 6 667 1~36 20 14 E1 10 000 1~36 20 16 E2 10 000 1~36 20 10 E3 10 000 1~36 20 18 Table 1. The basic information of the sample plots
-
在杉木固定样地内,对每株杉木进行挂牌记号,每年停止生长后进行调查。林分1982—1991年10 a间逐年调查,1991年(12 a生)后分别于1993、1994、1995、1997、1999、2003、2005、2007、2009、2015年进行了调查。3~4 a生时,每年测定每木树高;5~6 a生时,每年测定每木树高、冠径及树高达1.3 m以上的胸径;7 a生开始,每年测量每木树高、胸径、冠径及枝下高;林分达10 a生开始,除检尺每木胸径外,每个小区改测50株的树高,冠径和枝下高。在每个小区的上、中、下坡位各选2株优势木,将这6株优势木的平均高作为该林分优势木平均高(上层高),如上一观测年度选定的优树枯死或其它原因缺失,则在原选定优势木附近选择一株上层木作为替补;林龄20 a时,以6株优势木平均高作为小区立地指数级值。截至2015年,连续定位测定至林龄36 a,期间未进行间伐。
-
用EXCEL、SPSS 19等软件进行数据处理,用SigmaPlot 10.0等软件制作图形。胸径以2 cm为1个径级,林分平均胸径采用林分内测得单株胸径的均方值,林分平均树高采用林分内测得树高的算术平均高。采用部颁杉木二元立木材积表经验式,先求出平均单株材积,再乘以小区株数,即为小区材积,然后换算为每公顷总蓄积。总蓄积含活立木蓄积和枯损木材积。
1.1. 试验地概况
1.2. 研究方法
1.2.1. 样地设置
1.2.2. 测树因子调查
1.2.3. 数据分析处理
-
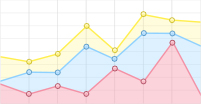
从图 1及表 2可以看出,不同初植密度林分总蓄积及活立木蓄积总体上随林龄增加呈增长趋势,且前期增长迅速,后期D、E两种高密度林分蓄积量增长趋缓,而相对低的A、B、C等3种低中密度林分蓄积量后期仍表现出较快的增长趋势。初植密度对林分蓄积量具有明显的影响。15 a前,林分蓄积量总体上随着林分初植密度的增大而增加,D、E两种高密度林分蓄积量始终高于其它3种密度;林分达15 a后,中密度的C密度林分蓄积量表现为最高。当林分达到36 a时,16立地指数级林分总蓄积表现为E1 < D2 < A3 < B3 < C3,分别达283.640 9、331.456 1、361.313 2、416.949 1、504.581 1 m3·hm-2,A、B、C 3种中低密度林分蓄积量要明显高于D、E 2种高密度林分。

Figure 1. The dynamics of total wood volume (A) and mean annual increment (B) of stands with different planting densities at 16-site-index class
林龄
Stand age
/a活立木蓄积
Living trees wood volume /(m3·hm-2)活立木蓄积比较
Comparison of living trees wood volume between sample plotsA3 B3 C3 D2 E1 E1/A3 E1/B3 E1/C3 E1/D2 5 2.81 2.54 4.19 11.04 11.81 4.20 4.65 2.82 1.07 15 153.17 211.23 259.22 248.93 208.45 1.36 0.99 0.8 0.84 20 206.74 275.09 321.86 313.25 279.58 1.35 1.02 0.87 0.89 26 261.89 325.6 386.36 311.95 237.6 0.91 0.73 0.61 0.76 36 328.09 379.72 452.52 273.96 283.64 0.86 0.75 0.63 1.04 Table 2. Comparison of living trees wood volume between stands with different planting densities at 16-site-index class
从林分蓄积量年平均生长量动态变化可知(图 1),15 a前,林分初植密度越大,林分蓄积量年平均生长量随林龄增加而增加的趋势愈明显,且年平均生长量最大值越大,而林分蓄积量年平均生长量维持较大值的时间随初植密度的增大而降低,即初植密度越低的林分能维持一个较长时间段的快速生长。
图 2、图 3、图 4分别描述了立地指数10、14、18 m时不同初植密度林分蓄积动态变化情况。从图 2可知,10指数级时C、E两种初植密度林分均在20 a生时林分蓄积达最高值,但最高密度的E林分最大蓄积量要高于C密度。当立地指数为14 m时,与16指数级相似,A、B、D等3种不同初植密度林分蓄积量在15 a前增长较快,15 a后增长趋缓;相对高的D密度林分总蓄积及活立木蓄积量要明显高于相对低的A、B两种密度,且36 a生时,D密度林分枯损木材积明显高于A、B两种密度。当立地质量达18指数级时,A、D、E 3种密度林分在后期能达到的最高蓄积量十分接近,初植密度越高的林分蓄积量越早达到最高值。显然,随着立地指数级的提高,林分总蓄积量与活立木蓄积量越高。

Figure 2. The total wood volume dynamics of stands with different planting densities at 10-site-index class

Figure 3. The total wood volume dynamics of stands with different planting densities at 14-site-index class

Figure 4. The total wood volume dynamics of stands with different planting densities at 18-site-index class
从表 2可知,16立地指数级时,初植密度最大的E密度与其它林分活立木蓄积的差异随着林龄增长逐渐变小。在幼龄时(5 a生),初植密度对林分活立木蓄积影响最明显;15 a后,初植密度对林分间活立木蓄积相对差异的影响减小,但在成熟龄36 a生时,初植密度对林分活立木蓄积的最大影响程度能达37%。
-
从表 3可看出,林分总蓄积连年生长量多在10 a时达到高峰,最早7 a,最晚11 a,由此判断第一次间伐应在10 a前完成,最晚不超过11 a;A、B、C等3种初植密度林分蓄积连年生长量高峰出现时间基本相近,而D密度,尤其是E密度林分连年生长量高峰出现时间更早,这表明林分连年生长量高峰出现的林龄随密度的增大出现得愈早,密度越大第一次间伐时间越早。总蓄积平均生长量达到高峰(即数量成熟)的年龄多为14 a,最早12 a,最晚15 a,指示最后一次间伐应在14 a前完成;如以总蓄积生长率下降到3%作为评判蓄积生长量增幅实质性减缓的依据[13],各试验小区达到的林龄为19~25 a(表 3),且相对低密度的A密度和B密度林分在总蓄积生长率下降到3%时林龄要明显高于C、D、E等3种密度林分。
样地Plots A1 A2 A3 B1 B2 B3 C1 C2 C3 D1 D2 D3 E1 E2 E3 连年生长高峰林龄Time when CAI peaked /a 10 10 11 10 10 10 11 10 10 10 8 10 10 7 7 平均生长量高峰林龄Time when MAI Peaked /a 14 12 15 14 14 15 14 14 15 14 14 14 14 14 14 生长率下降到3%的林龄Time when growth rate dropped to 3% /a 25 25 25 25 25 25 23 22 25 23 24 25 22 22 19 Table 3. The age when CAI and MAI of total wood volume peaked and the growth rate dropped to 3%
-
从16与14指数级的B1与B2、D2与D3小区林分总蓄积随林龄的变化可知(图 5),相同林龄时,立地指数级越高,林分总蓄积越大。仅发现在林龄36 a时,14指数级的D3的总蓄积超过16指数级的D2,这可能与D2样地在试验地边缘地带,后期试验样地遭受部分人为破坏所导致。15 a前,无论初植密度为3 333株·hm-2还是6 667株·hm-2,16指数级林分总蓄积随林龄增加而增大的趋势较14指数级林分更明显,即立地指数越高的林分,其总蓄积在中幼龄时期的增长速率越大。此外,可以发现,同样相差一个立地指数级,B密度林分总蓄积受立地的影响程度较D密度更深,这表明,立地指数对相对低初植密度林分总蓄积的影响程度更大,而随着初植密度的增大,立地指数对林分总蓄积的影响程度减弱。

Figure 5. The stand total volume dynamics in plots with planting density B (B1、B2) and D (D2、D3) at different site indices
-
通过比较单株平均材积、林分活立木蓄积年平均生长量动态变化情况(表 4),发现除C3外,绝大多数林分的单株材积平均生长量达到最大值的年龄均为36 a,说明在南亚热带,杉木单株材积平均生长量在成熟龄前仍具有良好的生长潜力。林分活立木蓄积年平均生长量达到最高峰的年龄最早为11 a(D2),最晚为24 a(A3、B3、C3),80%的林分活立木数量成熟龄在18 a前达到,且提示主伐的时间节点最晚为24 a,且在同一造林密度时,立地指数高的林分活立木蓄积平均生长量高峰的林龄大多高于立地指数低的林分。
林分因子Stand factors 平均生长量高峰林龄Stand age when mean annual increment reached maximum value/a A1 A2 A3 B1 B2 B3 C1 C2 C3 D1 D2 D3 E1 E2 E3 单株平均材积Mean stem volume 36 36 36 36 36 36 36 36 30 36 36 36 36 36 36 活立木蓄积Standing trees volume 14 18 24 14 14 24 18 14 24 14 11 18 14 14 18 Table 4. Stand age of different plots when individual volume and mean annual increment of living trees wood volume reached maximum value
2.1. 林分密度对林分总蓄积影响
2.1.1. 初植密度对林分总蓄积及活立木蓄积的影响


2.1.2. 初植密度对林分总蓄积连年生长量的影响
2.2. 立地指数对林分总蓄积生长量的影响

2.3. 活立木蓄积年平均生长量与单株平均材积达到峰值的年龄
-
人工林生产力的提高有赖于其合理的林分结构。林分密度是合理林分结构的数量基础,而各时期的林分密度本身又取决于造林时的初植密度、自然稀疏或间伐等因素。林分总蓄积是林分生产力的集中表现。已有研究表明,初植密度较大林分的连年生长量,在较小年龄时大于较疏林分,但在较大年龄时小于较疏林分[17]。本研究发现,在同一立地指数时,随着初植密度的增加,林分总蓄积随着林龄增长总体呈先明显增加后增长减缓的变动趋势,中等密度的C密度即5 000株·hm-2造林密度林分在36 a生时表现出了最高的总蓄积和活立木蓄积生长量,这可能是因为南亚热带中等密度更能适应杉木林分发育规律,可使单株蓄积与保留株数逐步达到最佳的组合效果;同时亦表明,在一定的林龄范围内比较一组不同密度的林分,总是密度大的蓄积量高,但是到了一定年龄以后,这个最高密度会被相邻的较低密度的林分替代,这与盛炜彤相关论述相一致[10]。
基于固定样地连续多年观测数据,本研究发现,立地质量明显影响了林分蓄积中幼龄期生长速率及近成熟与成熟期生长量,立地指数愈高的林分具有更快的早期生长速率及后期总生长量,这与立地质量促进林分形成并决定林分内林木径级大小的研究相统一[16, 18],且立地效应大小受初植密度高低的影响,立地质量对初植密度相对低的林分具有更大的作用效果,表明林分生长存在明显的立地与初植密度的交互作用。
本试验中位于南亚热带气候区的15块不同密度、立地的固定样地林分总蓄积平均生长量达到高峰年龄多为14 a,此时,林分蓄积生长率为5.7%~14.4%,还有较高生长潜力,这可能表明南亚热带杉木人工林具有较好的后期生长潜力,因此单纯以数量成熟龄确定主伐年龄不够科学。参照我国早期做法[13],总蓄积生长率下降到3%时,15块固定样地的林龄为19~25 a,而活立木蓄积均在24 a前达到数量成熟龄,且低密度的A密度和B密度在总蓄积生长率下降到3%时林龄要明显高于C、D、E等3种密度,这说明南亚热带杉木林主伐林龄不宜早于19 a,且造林密度愈低的林分主伐林龄更晚,相对低造林密度的每公顷1 667株及每公顷3 333株林分的主伐林龄可推迟到25 a,与中亚热带杉木人工林相比[18],南亚热带杉木林分主伐林龄相对更早。
-
通过对位于广西凭祥市的36 a生杉木密度试验林的长期定位观测,对南亚热带杉木人工林蓄积生长量的密度与立地效应进行了研究,得到3点主要结论:
(1) 初植密度与立地对林分活立木蓄积生长的影响与总蓄积一致,在15 a前近乎呈线性增长,15 a后增长趋缓;初植密度愈高,林分蓄积尤其是早期蓄积生长量愈高,立地指数愈大林分蓄积生长量愈大;以蓄积生长量最大为培育目标,16指数级时中等初植密度的C密度(5 000株·hm-2)为最适宜造林密度。立地指数越高的林分,其总蓄积在中幼龄时期的增长速率越大,且其对林分总蓄积的影响程度而随着初植密度的增大而减弱。
(2) 林分连年生长量高峰出现时间随密度的增大出现得愈早,第一次间伐应在10 a前完成,最晚不超过11 a,而最后一次间伐应在14 a前完成。
(3) 南亚热带杉木林主伐林龄不宜早于19 a,且初植密度愈低的林分主伐林龄更晚,相对低造林密度的每公顷1 667株及每公顷3 333株林分的主伐林龄可推迟到25 a。
 DownLoad: