

-
开展森林精准经营[1],是未来林业的发展方向,这需区分考虑林分内每株树的生长特征及受不同因素的影响,其中单木树高是最重要的林木特征之一。华北落叶松是我国北方暖温带湿润半湿润气候区山地的主要造林树种,具有速生及适应性强等优点[2]。华北落叶松单木树高生长过程同时受林分结构因子(如林龄、密度、郁闭度等)[3]及立地因子(气候、地形、土壤等)[4]的影响。对华北落叶松林的前期研究表明,林龄直接影响单木树高生长和其他林分结构特征变化[5];林分密度和林分郁闭度等林分结构可影响树木对环境资源(养分、水分、光照等)的占有和利用,从而影响单木树高的生长、竞争、死亡和产量[6-7]。影响林木树高生长的主要立地因子是海拔、坡向、坡度和土层厚度等[8],它们主要通过影响光照、温度、养分和水分而影响树高生长过程[9]。单木模型以树木个体自身生长特征为基础,从林木生长的竞争机制出发,模拟单木生长过程[10]。在以往研究中,采用解析木数据建立了兴安落叶松(Larix gmelinii (Rupr.)Kuzen)的单木树高模型,但并未考虑林分特征因子以及立地因子对单木树高生长的影响[11];为反映多个因素对单木树高生长的综合影响,可用外包线法首先确定生长指标对单因子变化的响应函数,然后建立多因子耦合模型,如杨文娟[12]在祁连山研究青海云杉(Picea crassifolia Kom.)林分生长响应林龄、密度、海拔和坡向的模型,田奥建立了六盘山华北落叶松林分树高与林龄、密度和海拔的耦合模型[3]。在六盘山区华北落叶松林以往的研究中都只建立林龄-树高模型[13],但还没进行过单木树高生长的多因素影响及耦合模型研究。因此,本研究在六盘山区选择华北落叶松人工林典型样地,开展每木调查及解析木分析,定量研究单木树高受立地条件和林龄及其他林分结构的影响,并建立能反映多因子影响的树高生长耦合模型,以便为选择适宜造林立地、预测单木树高生长和林分结构变化、开展森林精准经营等提供理论和技术支撑。
-
本研究在宁夏六盘山南段东坡的香水河小流域(106°12′10.6″~106°16′30.5″ E,35°27′22.5″~35°33′29.7″ N)进行,海拔变化在2070~2931 m,属温带半湿润气候,年均气温3.7 ℃,年均降水量 671 mm[14]。流域内土壤以灰褐土为主。小流域森林覆盖率高达82.91%;以华山松(Pinus armandii Franch.)、白桦(Betula platyphylla Suk.)等天然次生林为主,占小流域面积的58.51%;人工林以华北落叶松纯林为主,占小流域面积的24%[15];灌丛面积占12.01%,主要有西北栒子(Cotoneaster zabelii Schneid.)、沙棘(Hippophae rhamnoides Linn.)等;草地面积占16.25%,主要有狼针茅(Stipa baicalensis Roshev.)、早熟禾(Poa annua L.)等;草甸面积占4.64%,主要有苔草(Carex tristachya Spp.)、蕨(Pteridium aguilinum L.)等[15]。
-
经全面踏査后,沿海拔梯度(2 000~2 200、2 200~2 400、2 400~2 600、2 600~2 800和2 800~3 000 m)选择了23块面积20 m × 20 m的华北落叶松纯林样地(表1),记录样地经纬度及海拔、坡度、坡向等立地条件。调查中,将正北方向记为0度,顺时针偏离正北180度以内的坡向为正,逆时针偏离正北180度以内的坡向为负。
表 1 华北落叶松人工纯林样地基本情况
Table 1. Basic information on sample plots of pure plantation of Larix principis-rupprechtii
样地编号
Sample plot
number林分密度
Stand density/
(tree·hm−2)解析木
Analytic
trees林龄
Age/a海拔
Elevation/m坡度
Slope/°坡向
Slope
aspect/°郁闭度
Canopy
density平均胸径
Mean
DBH/cm平均树高
Mean tree
height/m枝下高
Branch
height/m平均冠幅
Mean canopy
width/m1 1 850 5 14 2 033 10 15 0.72 10.30 8.50 0.85 1.48 2 1 475 5 17 2 042 15 68 0.70 11.13 9.70 1.51 1.68 3 2 000 5 16 2 086 20 115 0.70 10.09 8.73 1.34 1.51 4 1 150 5 36 2 333 18 66 0.67 18.60 19.07 6.38 1.67 5 775 5 33 2 375 20 121 0.70 20.91 20.65 6.64 1.77 6 1 100 5 34 2 285 35 −154 0.72 17.47 17.21 6.42 1.69 7 775 6 32 2 355 19 −100 0.69 20.06 19.04 6.11 1.77 8 1 275 5 32 2 560 33 156 0.71 15.21 12.98 5.12 1.59 9 800 5 32 2 624 16 −104 0.69 18.77 13.98 5.07 1.55 10 1 050 5 34 2 570 25 −122 0.72 18.03 15.87 5.66 2.39 11 1 000 5 32 2 626 23 −160 0.62 19.12 16.11 5.48 1.77 12 1 300 5 33 2 631 20 86 0.67 16.75 15.87 5.27 1.31 13 1 425 5 22 2 693 22 −64 0.73 16.13 11.51 3.53 1.53 14 600 5 19 2 886 30 −94 0.65 10.96 6.73 0.19 1.78 15 725 5 18 2 920 31 −79 0.31 9.18 5.21 0.24 1.35 16 500 5 37 2 150 15 140 0.46 21.97 18.55 6.44 1.81 17 1 150 5 15 2 823 17 −1 0.30 7.78 4.43 2.26 1.08 18 1 150 5 19 2 811 21 −112 0.58 11.59 7.45 2.98 1.50 19 550 5 25 2 813 22 −121 0.40 18.16 9.76 4.01 1.83 20 775 5 25 2 789 19 −91 0.60 15.00 11.39 4.22 1.56 21 1 525 5 26 2 784 12 −172 0.67 13.28 11.74 4.46 1.50 22 1 625 5 28 2 778 30 −131 0.81 14.97 12.52 4.22 1.32 23 1 350 5 32 2 716 36 96 0.82 16.64 10.69 5.39 1.57 -
调查林分的郁闭度、密度,然后对各样地实测全部林木的树高、胸径、冠幅及枝下高等。用相对树高表征树木优势度[16]。优势度计算公式为:
${H_R} = \frac{{{H_i}}}{{{H_{\max }}}} - \frac{{\overline H }}{{{H_{\max }}}}$
(1) 式中
$\overline H $ 为样地平均树高,Hi为每株解析木树高,Hmax为各样地内最大树高,HR为优势度值。然后按Kraft树冠优势度分级标准[17],将各样地内的林木个体优势度分为3级:I代表优势木、Ⅱ代表平均木、Ⅲ代表被压木,每个样地至少选择优势木和平均木各2株及被压木1株,进行解析木调查(共116株)。
-
上外包线法可以剥离出各单一因子影响并分析各单一因子影响以确定响应函数类型[18]。建立模型过程:(1)将林龄对应的各树高值(H)除以理论最大树高Hmax(33 m),得到相对树高[3];把相对树高变化范围分成若干区段,在每段中选取大于本段数据平均值加一倍标准差的数据点[19],或在一些数据偏少的区段中直接选择最大数据点,拟合外包线f(x1);(2)同理,将步骤1中消除了林龄因子影响的数据与下一个影响因子做散点图,并得到响应函数f(x2);(3)用同样方法逐个消除其他因子的影响,直到确定相对树高对最后一个因子的响应函数f(xn);(4)连乘响应函数,得到受多因素影响的树高生长耦合模型:
$H = 33 \times f({x_1}) \times f\left( {{x_2}} \right) \times f\left( {{x_3}} \right) \times f\left( {{x_4}} \right) \times \cdot \cdot \cdot \cdot \cdot \cdot \times f\left( {{x_n}} \right)$
(2) 式中,H为单木树高,
$f({x_1})$ 、$f({x_2})$ 、...等分别表示单木树高生长对各单一因素${x_1}$ 、${x_2}$ 、...等的响应函数,n为考虑的影响因子数。把116株解析木数据分成:92株解析木实测数据拟合模型参数,剩余24株实测解析木数据验证模型拟合优度,选择验证解析木数据时注意了保持解析木在林龄、密度、郁闭度、海拔、坡度、坡向、优势度范围内的均匀分布。评价模型拟合优度的指标包括决定系数
${R^2}$ 、均方根误差RMSE、总相对误差TRE。R2越接近1,RMSE和TRE越小,说明模型拟合越好。计算公式为:${R^2} = 1 - \frac{{\displaystyle\sum\limits_{i = 1}^N {{{\left( {{Y_i} - {{\hat Y}_i}} \right)}^2}\mathop {^{}}\limits^{} } }}{{\displaystyle\sum\limits_{i = 1}^N {{{\left( {{Y_i} - {{\bar Y}_i}} \right)}^2}} }}$
(3) $RMSE = \sqrt {\frac{{\displaystyle\sum\limits_{i = 1}^N {{{\left( {{Y_i} - {{\hat Y}_{\rm{i}}}} \right)}^2}} }}{N}} $
(4) $TRE = \frac{{\displaystyle\sum {({Y_i} - {{\hat Y}_i})} }}{{\displaystyle\sum {{{\hat Y}_i}} }} \times 100{\text{%}} $
(5) 式中,
${Y_i}$ 和${\hat Y_i}$ 为第i个单木树高的实测值和预测值,$\bar Y$ 为所有实测树高的平均值,N为用于参数率定或检验的样本数。 -
用统计Excel软件处理野外调查数据,用统计软件Origin进行绘图及曲线拟合,并用SPSS25.0软件进行典型相关分析等统计分析,用软件1st0pt进行耦合模型的参数拟合。
-
单木树高与各影响因子的相关分析表明(表2),各因子的相关系数排序为:林龄 > 海拔 > 郁闭度 > 优势度 > 林分密度 > 坡向 > 坡度。
表 2 单木树高与各因子的相关性
Table 2. Correlation between tree height and influencing factors
影响因子
Influencing factors海拔
Elevation坡向
Slope aspect坡度
Slope林分密度
Stand density郁闭度
Canopy density林龄
Tree age优势度
Dominance相关系数
Correlation coefficients−0.421** 0.201 0.101 −0.248 0.419** 0.829** 0.413** 注:** 表示在0.01水平上显著相关。
Note: ** indicate a significant correlation at the level of 0.01 . -
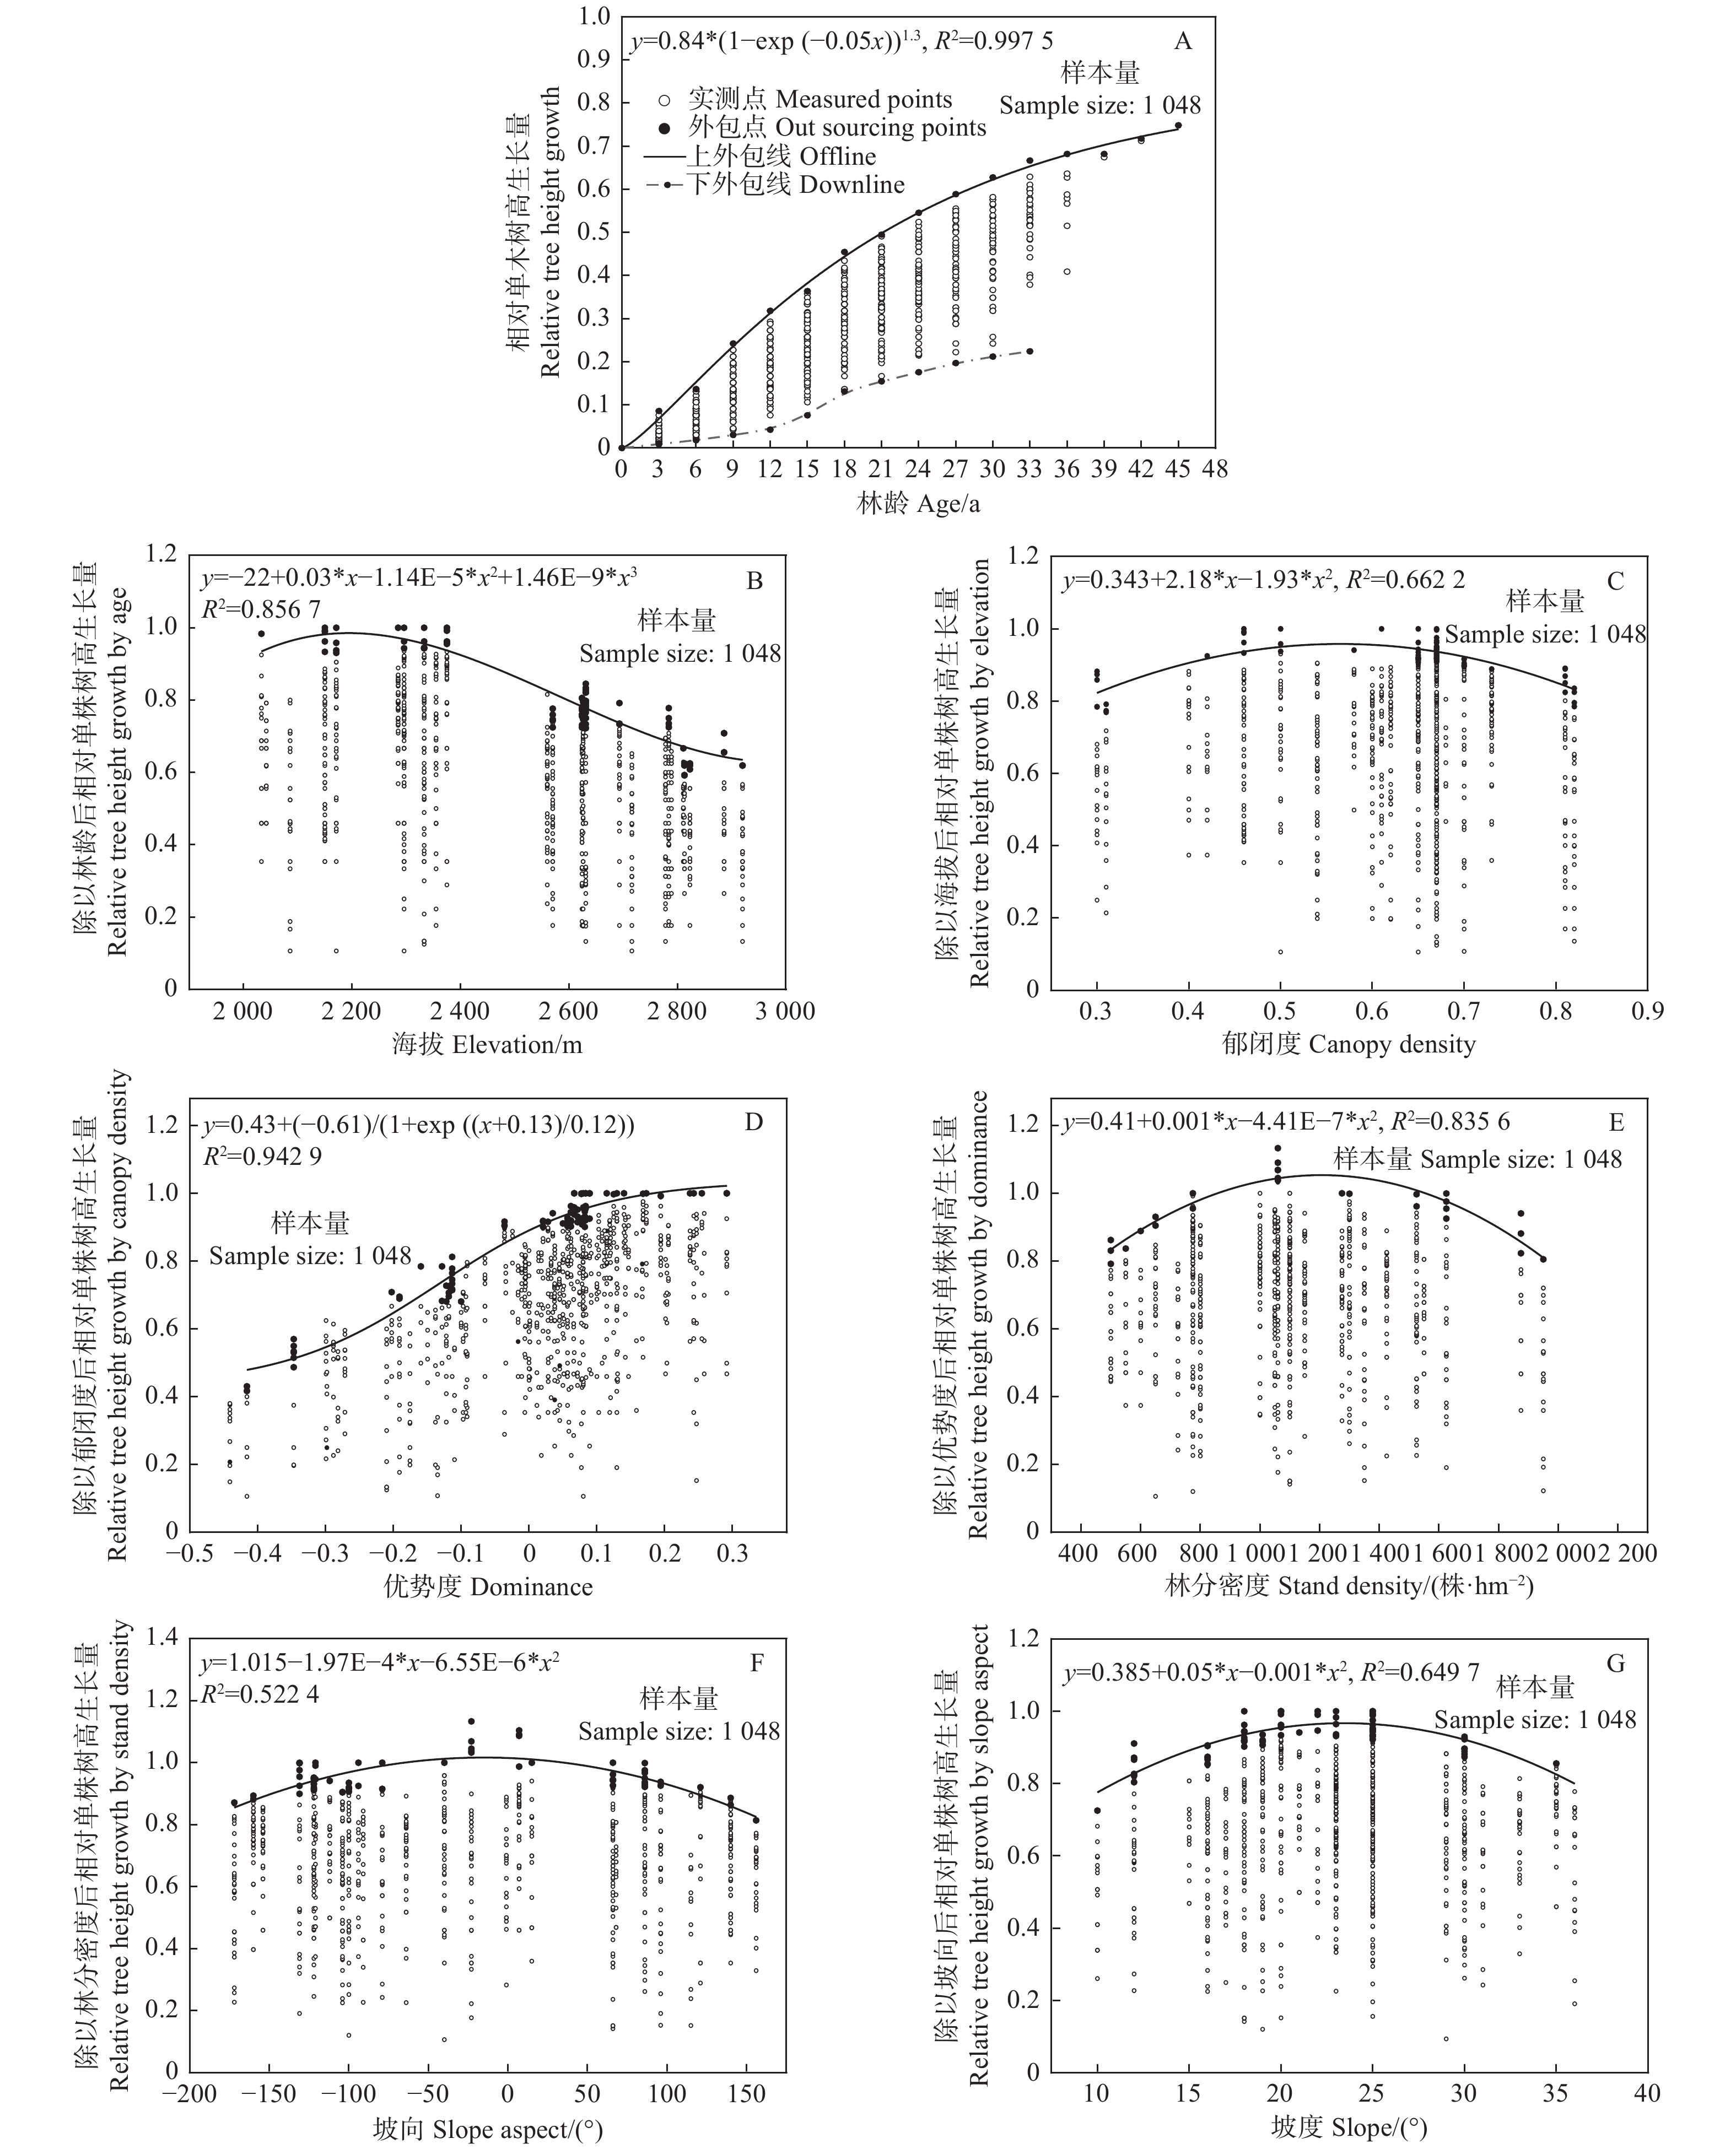
基于所有解析木数据分析得到的单木树高对林龄的响应见图1-A中的上外包线,单木相对树高随林龄增加而逐渐升高,在21 a以前增长较快,随后增速变缓,在45 a时最高可达27.68 m。确定树高生长过程符合Richard方程:
$f\left( {age} \right) = a \times (1 - \exp ( - b \times age))^{\wedge}c$ ,R2 = 0.997 5。单木树高对海拔的响应见图1-B,树高在海拔2 000~2 200 m随海拔升高逐渐变大,之后随海拔继续升高而逐渐下降。树高对海拔的响应呈三次多项式:$f\left( {ele} \right) = d \times el{e^3} + e \times el{e^2} + f \times ele + g$ ,R2 = 0.856 7。单木树高对郁闭度的响应见图1-C中的外包线,单木树高在郁闭度0.3~0.56范围内随郁闭度增大而逐渐增大,在郁闭度 > 0.56后逐渐减小。树高对郁闭度的响应呈二次多项式:$f\left( {cd} \right) = $ $ h \times c{d^2} + i \times cd + j$ ,R2 = 0.662 2。单木树高对优势度的响应特征见图1-D中的外包线,可知单株树高随优势度增加先平缓增加,在优势度为−0.2后增速加快,在优势度为0.08后增速渐趋平缓。树高对优势度的响应符合S型曲线:$f\left( {dom} \right) = k + $ $ (l - k)/ $ $ \left[ {1 + \exp \left( {\left( {dom - m} \right)/n} \right)} \right]$ ,R2 = 0.942 9。单木树高对林分密度的响应见图1-E中的外包线,可知树高随密度增加在400~1 200株·hm−2范围内逐渐增加,之后逐渐下降。单木树高对林分密度的响应呈二次多项式关系:$f\left( {den} \right) = o \times $ $ de{n^2} + p \times den + q$ ,R2 = 0.835 6。单木树高对坡向的响应见图1-F中的外包线,可知最适坡向为阴坡和半阴坡,在坡向180°到0°的范围内,单木树高随坡向靠近正北方向逐渐增加。响应函数为二次多项式:$f\left( {asp} \right) = r \times as{p^2} + $ $ s \times asp + t$ ,R2 = 0.522 4。单木树高对坡度的响应见图1-G中外包线,单木树高在坡度达23.5°之前随坡度增大而增加,之后转而减小,最适坡度在20°~27°。响应函数为:$f\left( {slope} \right) = u \times slop{e^2} + v \times slope + w$ ,R2 = 0.649 7。
图 1 单木树高对立地条件和林分特征的响应
Figure 1. Response of single tree height to site conditions and stand structure characteristics
-
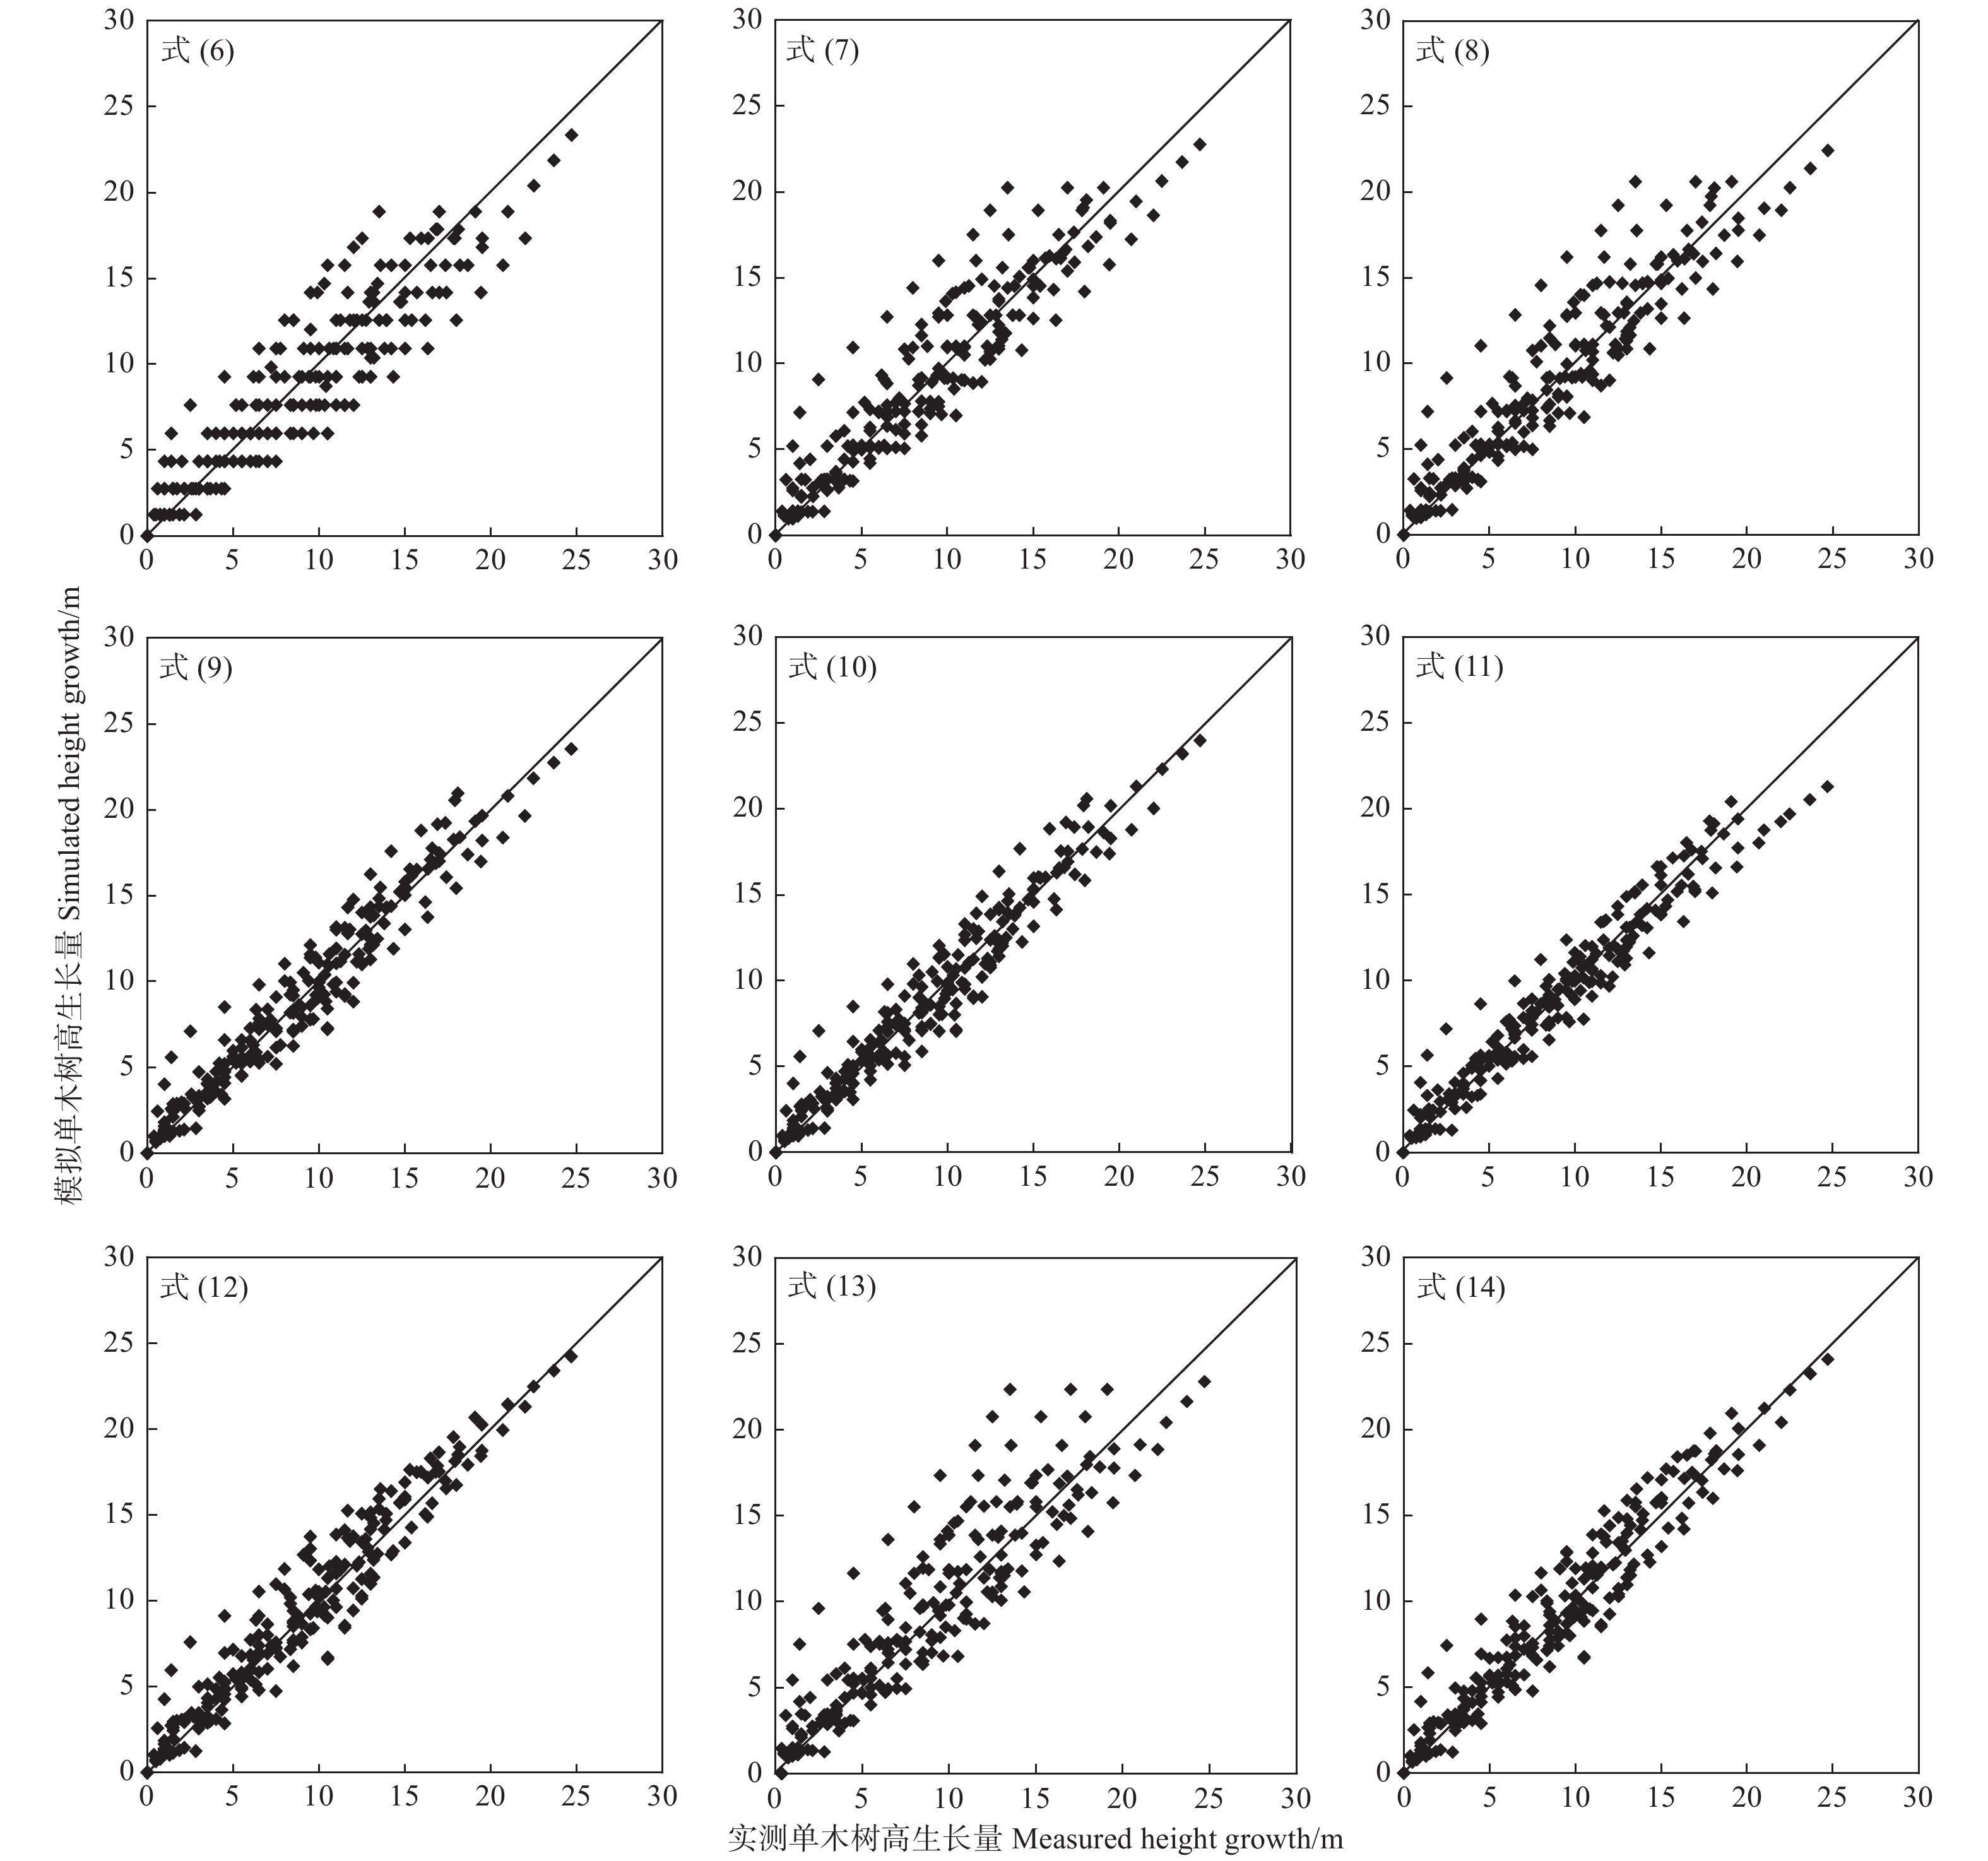
按相关系数的大小排序,从单木树高响应林龄的模型开始,逐个增加耦合其他因子,得出模型(式6~式12)。为便于生产应用,本研究同时建立包括林龄、林分密度、海拔、坡向、坡度这些独立变量的模型(式13),然后在此基础上增加优势度建立了模型式(14)。从表3可看出,从式(6)到式(10),伴随R2升高,RMSE和TRE降低;式(11)为加入坡向后R2降低,RMSE和TRE均上升;式(12)综合考虑了所有因子,其R2升高;式(13)只考虑了独立因子,所以R2下降;式(14)在式(13)的基础上加入了优势度,导致R2升高到和式(12)相近的水平。式(6)~(14)的TRE不超过 ± 0.3%,式(10)以及式(12)的TRE最小,这3个评价指标均证明,式(12)是最优的多因子耦合模型,其次为式(14)。
表 3 单木树高生长模型及其拟合优度
Table 3. Forecasting and calculating models of tree height growth per plant
编号 NO. 模型 Model R2 RMSE/m TRE/% 式(6) f (1)=f (age)=33×(1−exp(−0.029×age))1.41 0.871 2.036 0.228 式(7) f (2)=f (age)×f (ele)=(33×(1−exp(−0.028×age))1.293)×(3.34E−9×ele3−2.58E−5×ele2+0.065×ele−53.6) 0.908 1.717 −0.212 式(8) f (3)=f (age)×f (ele)×f (cd)=(33×(1−exp(−0.025×age))1.275)×(−3.85E−6×ele3+0.03×ele2−72.64×ele+58 516)×
(5E−4×cd2−9.6E−4×cd−6.3E−4)0.911 1.697 −0.200 式(9) f (4)=f (age)×f (ele)×f (cd)×f (dom)=(33×(1−exp(−0.041×age))1.43)×(0.07×ele3−569.14×ele2+1.45E+6×ele−
1.19E+9)×(−9.26E−5×cd2+1.45E−4×cd+0.0001)×(4.41E−5+(2.7E−4)/(1+exp((dom+0.198)/−0.245)))0.961 1.117 −0.072 式(10) f (5)=f (age)×f (ele)×f (cd)×f (dom)×f (den)=(33×(1−exp(−0.044×age))1.46)×(2.02E−16×ele3−1.57E−12×ele2+
4E−9×ele−3.32E−6)×(−1.95×cd2+3.32×cd+1.02)×(567.36+(−1025.4)/(1+exp((dom−7.67)/40.33)))×(0.13×
den2−364.3×den+k/>1.18E+60.962 1.115 0.019 式(11) f (6)=f (age)×f (ele)×f (cd)×f (dom)×f (den)×f (asp)=(33×(1−exp(−0.041×age))1.431)×(−0.65×ele3+643.6×ele2+
5.47E+6×ele+4.701E+7)×(−3.62E−18×cd2+6.57E−18×cd+1.36E−18)×(3.53+(1.22)/(1+exp((dom+0.016)/
−0.001)))×(3.67E−5×den2−0.252×den+1 414.2)×(−0.02×asp2−0.497×asp+4 918.93)0.941 1.380 0.104 式(12) f (7)=f (age)×f (ele)×f (cd)×f (dom)×f (den)×f (asp)×f (slope)=(33×(1−exp(−0.043×age))1.462)×(0.049×ele3−
362.01×ele2+8.86E+5×ele−6.99E+8)×(−0.101×cd2+0.198×cd+0.038)×(−314.96+578/(1+exp((dom+
61.81)/−338)))×(2.57E−16×den2−5.56E−13×den−6.64E−10)×(−0.0034×asp2−0.177×asp−1927)×
(−0.001×slope2+0.026×slope+0.396)0.975 0.906 −0.028 式(13) f (8)=f (age)×f (ele)×f (den)×f (asp)×f (slope)=(33×(1−exp(−0.022×age))1.27)×(0.039×ele3−293.6×ele2+
7.22E+5×ele−5.7E+8)×(−3E−19×den2+7.67E−16×den+6.82E−13)×(−0.007×asp2−0.3×asp+6128.7)×
(−0.009×slope2+0.37×slope+10.31)0.916 1.650 −0.156 式(14) f (9)=f (age)×f (ele)×f (dom)×f (den)×f (asp)×f (slope)=(33×(1−exp(−0.0417×age))1.46)×(1.51E−8×ele3−
0.0001×ele2+0.29×ele−237)×(3.07+(−2.48)/(1+exp((dom+0.11)/0.24)))×(0.28×den2−767.14×den−716549)×
(1.09E−15×asp2+3.36E−14×asp+5.98E−10)×(0.111×slope2−4.186×slope−97.64)0.971 0.960 −0.034 用24株解析木的实测数据对模型(6~14)进行检验(如图2):式(10)、式(12)、式(14)比其他模型拟合的要好,预测点最靠近并均匀分布在45°线两侧。

图 2 单木树高生长模型(式6~14)的检验
Figure 2. Test of tree heights of models of Eq. 6-14
-
林龄是影响树高生长的最重要因子。华北落叶松树高随林龄增加的生长过程表现为“S”型曲线,可划分为生长初期、快速生长期、平缓生长期3个阶段[20]。如图1-A中下外包线表示的树高生长过程S型曲线特征比上外包线更明显,本研究表明采用Richard方程能很好表示树高生长过程[21]。林冠郁闭度直接或间接地影响林木生长及众多服务功能[22],本研究中,华北落叶松单木树高在郁闭度为0.49~0.64时最好,相比多功能森林经营要求的合理郁闭度范围0.6~0.8[23]有些偏低但也差异不大。优势度能直接反映林木对自然资源的利用能力[24],单木树高随优势度增大过程呈“S”型曲线特征,在优势度超过0.08后,树高增大速率趋于平缓,说明优势木和亚优势木的树高可能会接近或达到立地质量决定的潜在树高,是获得木材生产经济效益的主要贡献者。林分密度会影响单木的光照、水分、养分等资源占有量[6],华北落叶松单木树高生长的最适密度平均为1 100~1 300株·hm−2[25]。海拔虽不直接影响树木生长,但会通过影响降水、温度、蒸散等环境因子间接影响树木生长[26-27]。本研究表明六盘山区最适合华北落叶松生长的海拔范围为2000~2400 m,降水不足是六盘山区树木生长的主要限制因子,在海拔超过2200 m后,海拔升高导致的气温降低逐渐成为限制树木生长的主要因素,使得树高随海拔增加而逐渐降低[3]。坡向与坡度会影响地面得到的太阳辐射,阳坡接受的太阳照射比阴坡更多,坡度大时接受太阳垂直照射的程度越大[28],从而影响潜在蒸散和水分条件[3]。本研究表明,单木树高在阴坡和半阴坡最大,这是因光照较弱、蒸散较小导致植物可用水分较多和受干旱胁迫较轻;单木树高随坡度增大表现为先增后减,最适坡度范围为20°~25°,类似于河北塞罕坝林场的华北落叶松生长研究结果[27],因地势平缓时导致的林木相互遮光明显以及坡度过陡导致的土壤偏薄和水土流失均不利于林木生长。
-
在自然环境中,林木生长同时受多因子影响,因而时空差异很大,所以综合考虑多因子影响的模型预测精度一般较高。然而,由于缺少调查资料或追求简单易用等原因,以往的华北落叶松生长模型常仅考虑林龄影响[8],忽略其他因子影响,降低了预测精度和限制了应用范围。相比之下,建立多因素耦合模型,便于准确预测在不同立地及林分结构条件下的生长变化。在以往的六盘山华北落叶松林分生长指标模型中考虑了林龄、密度和海拔这3个主要因素[3],在祁连山青海云杉林分生长指标模型中考虑了林龄、密度、海拔和坡向[10]。在本研究中,经过检验比较模型(6~14)得出,六盘山华北落叶松单木树高生长模型在综合考虑因子的影响时精度最佳,优点是能考虑所有立地条件和林分特征因子对树高生长的影响,会更准确地预测树高。模型在考虑林龄时能准确预测立地条件和林分结构平均情况下的树木生长;考虑海拔的影响可反映树高生长随海拔变化的空间差异;继续增加考虑了郁闭度和林分密度的影响,能在一定程度上反映林分结构对树木生长的影响,利于以林分为空间单元预测单木树高的时空变化;增加优势度的影响能精确到单株精准经营;继续增加考虑坡向和坡度,因为本研究区位于半湿润区,树高的坡向响应较弱,且本研究选取不同坡向的样地较少,无法准确体现坡向对树高生长的影响,在未来研究中应增加所缺坡向的样地,进一步研究不同坡向下的树高生长差异,使模型更精准。综上,可根据研究目的或生产需求,从这里建立的单木树高耦合模型(式6~14)中选择应用。
-
在宁夏六盘山半湿润区,通过华北落叶松人工纯林样地及解析木调查,研究了单木树高受不同立地因子及林分结构特征影响的规律,得到如下结论:
(1)单木树高生长受立地条件及林分结构因子影响的大小排序为:林龄 > 海拔 > 郁闭度 > 优势度 > 林分密度 > 坡向 > 坡度。
(2)单木树高生长随林龄增加和优势度增大均表现为“S”型;单木树高生长随海拔、郁闭度、林分密度、坡向、坡度的增加均呈现“先增后降”的变化。
(3)建立了能反映多因素影响的耦合模型,其中综合考虑立地因子和林分结构特征影响的模型表现最好。可根据研究需要,或考虑生产应用方便,选择利用本研究建立的单木树高生长耦合模型,从而为华北落叶松人工林的精准经营及管理决策提供科学依据。
六盘山华北落叶松单木树高对立地因子和林分特征的响应
Response of Individual Height of Larix principis-rupprechtii Plantation to Site Factors and Stand Characteristics in Liupan Mountain Area
-
摘要:
目的 研究宁夏六盘山林区华北落叶松(Larix principis-rupprechtii )人工林内单木树高对立地条件和林分特征的响应,并建立树高生长模型,以便准确预测树高生长,确定适宜立地条件及林分结构,指导优化林分结构的精准经营。 方法 选择建立典型样地,进行每木调查及树干解析,采用外包线法确定树高对单一因子的响应规律和适宜函数形式,然后连乘耦合多因子影响,构成能反映多因子影响的树高生长模型,并利用实测数据检验,获得可准确预测华北落叶松单木树高的最优模型。 结果 (1)华北落叶松单木树高随林龄增加的生长过程呈现“S”型曲线。(2)相关分析表明,在除林龄外的各因子中,对单木树高生长影响的大小排序为:海拔 > 郁闭度 > 优势度 > 林分密度 > 坡向 > 坡度。(3)最适合华北落叶松生长的海拔范围是2000~2400 m,坡向是阴坡和半阴坡,坡度是20°~25°,郁闭度是0.49~0.64,林分密度是1100~1300 株·hm−2,单木树高随优势度增加而增大,且增大速率在优势度 > 0.2后渐趋平缓。(4)建立了耦合主要因素影响的单木树高生长模型,拟合效果很好。 结论 宁夏六盘山区华北落叶松人工林内的单木树高同时受立地条件和林分结构特征影响,主要影响因素为林龄、海拔、郁闭度、优势度等。在考虑综合因素影响下建立的单木树高生长耦合模型可准确预测单木树高的时空变化,将作为华北落叶松林合理经营的科学依据。 Abstract:Objective For the main afforestation species of Larix principis-rupprechtii in the forest area of Liupan Mountains, To study the response of individual tree height in Larix principis-rupprechtii, the main afforestation species in the forest area of Liupan Mountain Area, to site conditions and stand structure, in order to predict tree height growth more accurately, and to determine the suitable site for afforestation and proper stand structure for forest management, so as to guide the accurate and precise management of stand structure. Method The tree height growth data of L. principis-rupprechtii were obtained by carrying out the survey of analytic trees of various dominances in selected typical plots with various site conditions and stand structure characters, and the response law and suitable function forms of tree height response to all single factors were determined by the upper boundary line method. Then the tree height growth model which can reflect the influence of multiple factors was formed by a continuous multiplication. The model parameters were fitted using the measured data for getting the optimal tree height growth model. Result (1) The growth process of individual tree height of L. principis-rupprechtii showed a "S" curve. (2) Correlation analysis showed that the influence on tree height growth by the factors except tree age followed the order of elevation > canopy density > tree dominance > stand density > slope aspect > slope. (3) The most suitable conditions for the height growth of L. principis-rupprechtii are the elevation range of 2 000−2 400 m, the slope aspect range from shade slope to half shade slope, the slope gradient range of 20°−225°, the canopy density range of 0.49−20.64, the stand density of 1100−21300 trees/hm2. In addition, the height of individual trees increased with rising tree dominance but with a leveling-off increase rate after the dominance is higher than 0.2. (4) The height growth model of individual trees was established by coupling the response functions to the main influencing factors, with a satisfactory fitness. Conclusion The individual tree height growth of L. principis-rupprechtii is affected by both site conditions and stand structure characteristics. The main influencing factors are tree age, elevation, canopy density, and tree dominance. When considering the influencing factors, the coupled model of individual tree height growth can predict the spatio-temporal variation of individual tree height more accurately, and benefit the rational management of L. principis-rupprechtii plantation. -
图 1 单木树高对立地条件和林分特征的响应
Figure 1. Response of single tree height to site conditions and stand structure characteristics
表 1 华北落叶松人工纯林样地基本情况
Table 1. Basic information on sample plots of pure plantation of Larix principis-rupprechtii
样地编号
Sample plot
number林分密度
Stand density/
(tree·hm−2)解析木
Analytic
trees林龄
Age/a海拔
Elevation/m坡度
Slope/°坡向
Slope
aspect/°郁闭度
Canopy
density平均胸径
Mean
DBH/cm平均树高
Mean tree
height/m枝下高
Branch
height/m平均冠幅
Mean canopy
width/m1 1 850 5 14 2 033 10 15 0.72 10.30 8.50 0.85 1.48 2 1 475 5 17 2 042 15 68 0.70 11.13 9.70 1.51 1.68 3 2 000 5 16 2 086 20 115 0.70 10.09 8.73 1.34 1.51 4 1 150 5 36 2 333 18 66 0.67 18.60 19.07 6.38 1.67 5 775 5 33 2 375 20 121 0.70 20.91 20.65 6.64 1.77 6 1 100 5 34 2 285 35 −154 0.72 17.47 17.21 6.42 1.69 7 775 6 32 2 355 19 −100 0.69 20.06 19.04 6.11 1.77 8 1 275 5 32 2 560 33 156 0.71 15.21 12.98 5.12 1.59 9 800 5 32 2 624 16 −104 0.69 18.77 13.98 5.07 1.55 10 1 050 5 34 2 570 25 −122 0.72 18.03 15.87 5.66 2.39 11 1 000 5 32 2 626 23 −160 0.62 19.12 16.11 5.48 1.77 12 1 300 5 33 2 631 20 86 0.67 16.75 15.87 5.27 1.31 13 1 425 5 22 2 693 22 −64 0.73 16.13 11.51 3.53 1.53 14 600 5 19 2 886 30 −94 0.65 10.96 6.73 0.19 1.78 15 725 5 18 2 920 31 −79 0.31 9.18 5.21 0.24 1.35 16 500 5 37 2 150 15 140 0.46 21.97 18.55 6.44 1.81 17 1 150 5 15 2 823 17 −1 0.30 7.78 4.43 2.26 1.08 18 1 150 5 19 2 811 21 −112 0.58 11.59 7.45 2.98 1.50 19 550 5 25 2 813 22 −121 0.40 18.16 9.76 4.01 1.83 20 775 5 25 2 789 19 −91 0.60 15.00 11.39 4.22 1.56 21 1 525 5 26 2 784 12 −172 0.67 13.28 11.74 4.46 1.50 22 1 625 5 28 2 778 30 −131 0.81 14.97 12.52 4.22 1.32 23 1 350 5 32 2 716 36 96 0.82 16.64 10.69 5.39 1.57  下载: 导出CSV
表 2 单木树高与各因子的相关性
Table 2. Correlation between tree height and influencing factors
影响因子
Influencing factors海拔
Elevation坡向
Slope aspect坡度
Slope林分密度
Stand density郁闭度
Canopy density林龄
Tree age优势度
Dominance相关系数
Correlation coefficients−0.421** 0.201 0.101 −0.248 0.419** 0.829** 0.413** 注:** 表示在0.01水平上显著相关。
Note: ** indicate a significant correlation at the level of 0.01 .
下载: 导出CSV
表 3 单木树高生长模型及其拟合优度
Table 3. Forecasting and calculating models of tree height growth per plant
编号 NO. 模型 Model R2 RMSE/m TRE/% 式(6) f (1)=f (age)=33×(1−exp(−0.029×age))1.41 0.871 2.036 0.228 式(7) f (2)=f (age)×f (ele)=(33×(1−exp(−0.028×age))1.293)×(3.34E−9×ele3−2.58E−5×ele2+0.065×ele−53.6) 0.908 1.717 −0.212 式(8) f (3)=f (age)×f (ele)×f (cd)=(33×(1−exp(−0.025×age))1.275)×(−3.85E−6×ele3+0.03×ele2−72.64×ele+58 516)×
(5E−4×cd2−9.6E−4×cd−6.3E−4)0.911 1.697 −0.200 式(9) f (4)=f (age)×f (ele)×f (cd)×f (dom)=(33×(1−exp(−0.041×age))1.43)×(0.07×ele3−569.14×ele2+1.45E+6×ele−
1.19E+9)×(−9.26E−5×cd2+1.45E−4×cd+0.0001)×(4.41E−5+(2.7E−4)/(1+exp((dom+0.198)/−0.245)))0.961 1.117 −0.072 式(10) f (5)=f (age)×f (ele)×f (cd)×f (dom)×f (den)=(33×(1−exp(−0.044×age))1.46)×(2.02E−16×ele3−1.57E−12×ele2+
4E−9×ele−3.32E−6)×(−1.95×cd2+3.32×cd+1.02)×(567.36+(−1025.4)/(1+exp((dom−7.67)/40.33)))×(0.13×
den2−364.3×den+k/>1.18E+60.962 1.115 0.019 式(11) f (6)=f (age)×f (ele)×f (cd)×f (dom)×f (den)×f (asp)=(33×(1−exp(−0.041×age))1.431)×(−0.65×ele3+643.6×ele2+
5.47E+6×ele+4.701E+7)×(−3.62E−18×cd2+6.57E−18×cd+1.36E−18)×(3.53+(1.22)/(1+exp((dom+0.016)/
−0.001)))×(3.67E−5×den2−0.252×den+1 414.2)×(−0.02×asp2−0.497×asp+4 918.93)0.941 1.380 0.104 式(12) f (7)=f (age)×f (ele)×f (cd)×f (dom)×f (den)×f (asp)×f (slope)=(33×(1−exp(−0.043×age))1.462)×(0.049×ele3−
362.01×ele2+8.86E+5×ele−6.99E+8)×(−0.101×cd2+0.198×cd+0.038)×(−314.96+578/(1+exp((dom+
61.81)/−338)))×(2.57E−16×den2−5.56E−13×den−6.64E−10)×(−0.0034×asp2−0.177×asp−1927)×
(−0.001×slope2+0.026×slope+0.396)0.975 0.906 −0.028 式(13) f (8)=f (age)×f (ele)×f (den)×f (asp)×f (slope)=(33×(1−exp(−0.022×age))1.27)×(0.039×ele3−293.6×ele2+
7.22E+5×ele−5.7E+8)×(−3E−19×den2+7.67E−16×den+6.82E−13)×(−0.007×asp2−0.3×asp+6128.7)×
(−0.009×slope2+0.37×slope+10.31)0.916 1.650 −0.156 式(14) f (9)=f (age)×f (ele)×f (dom)×f (den)×f (asp)×f (slope)=(33×(1−exp(−0.0417×age))1.46)×(1.51E−8×ele3−
0.0001×ele2+0.29×ele−237)×(3.07+(−2.48)/(1+exp((dom+0.11)/0.24)))×(0.28×den2−767.14×den−716549)×
(1.09E−15×asp2+3.36E−14×asp+5.98E−10)×(0.111×slope2−4.186×slope−97.64)0.971 0.960 −0.034
下载: 导出CSV
-
[1] 庄宜海. 基于近自然林经营理念的森林质量精准提升技术应用—以张家界市永定区为例[J]. 湖南林业科技, 2020, 47(2):123-128. doi: 10.3969/j.issn.1003-5710.2020.02.024 [2] 周全良, 安永平, 袁彩霞, 等. 宁夏六盘山区华北落叶松优树资源调查与综合评价及开发利用的探讨[J]. 宁夏农林科技, 2012, 53(11):43-47. doi: 10.3969/j.issn.1002-204X.2012.11.020 [3] 田 奥. 六盘山半湿润区华北落叶松人工林的多种功能时空变化与优化管理[D]. 北京: 中国林业科学研究院, 2019. [4] 张冬燕, 王冬至, 张志东, 等. 不同龄组华北落叶松人工林径向生长模型构建[J]. 山东农业大学学报: 自然科学版, 2017, 48(3):449-455. [5] 余杨春, 袁彩霞. 六盘山华北落叶松人工林生长规律研究[J]. 农业科学研究, 2014, 35(3):10-14. doi: 10.3969/j.issn.1673-0747.2014.03.003 [6] 童书振, 盛炜彤, 张建国. 林分生长与产量模型系统研究综述[J]. 林业科学, 2002, 18(1):66-751. [7] He F L, Duncan R P. Density-dependent effects on tree survival in an old-growth Douglas fir forest[J]. Journal of Ecology, 2000, 88(4): 676-688. doi: 10.1046/j.1365-2745.2000.00482.x [8] 王 勇. 燕山山地华北落叶松人工林生长规律研究[D]. 河北保定: 河北农业大学, 2014. [9] Rantzu Primicia, Jesús Julio Camarero, Pavel Janda, et al. Age, competition, disturbance and elevation effects on tree and stand growth response of primary Picea abies forest to climate[J]. Forest Ecology and Management, 2015, 354: 77-86. doi: 10.1016/j.foreco.2015.06.034 [10] 吕沅杭, 伊利启, 王儒林, 等. 基于空间结构参数的大兴安岭天然落叶松单木直径生长模型[J]. 林业科学研究, 2021, 34(2):81-91. [11] 姜立春, 杜书立. 基于非线性混合模型的东北兴安落叶松树高和直径生长模拟[J]. 林业科学研究, 2012, 25(1):11-16. doi: 10.3969/j.issn.1001-1498.2012.01.003 [12] 杨文娟. 祁连山青海云杉林空间分布和结构特征及蒸散研究[D]. 北京: 中国林业科学研究院, 2018. [13] 萨如拉, 徐加睿, 王智慧, 等. 基于树干解析的兴安落叶松人工林单木生长模型研究[J]. 林业资源管理, 2019(2):88-92. [14] 马 菁, 郭建斌, 刘泽彬, 等. 六盘山华北落叶松林分蒸腾日内变化及其对环境因子的响应[J]. 北京林业大学学报, 2020, 42(5):1-11. doi: 10.12171/j.1000-1522.20190468 [15] 刘泽彬, 王彦辉, 田 奥, 等. 六盘山半湿润区坡面华北落叶松林冠层截留的时空变化及空间尺度效应[J]. 水土保持学报, 2017, 31(5):231-239. [16] 李振华, 王彦辉, 于澎涛, 等. 华北落叶松液流速率的优势度差异及其对林分蒸腾估计的影响[J]. 林业科学研究, 2015, 28(1):8-16. [17] 唐守正, 王彦辉. 空气污染对森林影响的统一采样、评价、监测和分析的方法与标准手册[M]. 北京: 中国科学技术出版社, 2002. [18] Matsushita M, Takata K, Hitsuma G, et al. A novel growth model evaluating age-size effect on long-term trends in tree growth[J]. Functional Ecology, 2015, 29(10): 1250-1259. doi: 10.1111/1365-2435.12416 [19] Ahmad B, Wang Y H, Hao J, et al. Optimizing stand structure for trade-offs between overstory timber production and understory plant diversity: A case-study of a larch plantation in northwest China[J]. Land Degradation and Development, 2018, 29(9): 2998-3008. doi: 10.1002/ldr.3070 [20] 王云霓, 高孝威, 苏雅拉巴雅尔, 等. 林分密度和林龄对华北落叶松人工林生长特征的影响[J]. 内蒙古林业科技, 2018, 44(3):12-16. doi: 10.3969/j.issn.1007-4066.2018.03.003 [21] 李兵兵, 原民龙. 华北落叶松人工林生长规律研究[J]. 河北农业大学学报, 2012, 35(2):60-64+71. [22] Cademus R, Escobedo F J, McLaughlin D, et al. Analyzing trade-offs, synergies, and drivers among timber production, carbon sequestration, and water yield in Pinus elliotii forests in Southeastern USA[J]. Forests, 2014, 5: 1409-1431. doi: 10.3390/f5061409 [23] Wang Y H, Xiong W, Gampe S, et al. A water yield-oriented practical approach for multifunctional forest management and its application in dryland regions of China[J]. Journal of the American Water Resources Association, 2015, 51: 689-703. doi: 10.1111/1752-1688.12314 [24] 王希群, 马履一, 贾忠奎, 等. 叶面积指数的研究和应用进展[J]. 生态学杂志, 2005, 24(5):537-541. doi: 10.3321/j.issn:1000-4890.2005.05.015 [25] 郝 佳. 宁夏六盘山华北落叶松人工林密度对多功能的影响[D]. 北京: 中国林业科学研究院, 2012. [26] 惠淑荣, 于洪飞. 日本落叶松林分生长量 Richards生长方程的建立与应用[J]. 生物数学学报, 2003, 18(2):204-206. doi: 10.3969/j.issn.1001-9626.2003.02.011 [27] 阿比亚斯. 塞罕坝林场华北落叶松生长与立地关系研究[D]. 河北保定: 河北农业大学, 2013. [28] Fu B. Simulation of the spatial distribution of climatic element in mountain regions[J]. Acta Meteorologica Sinica, 1989, 3(5): 669-676. -

 点击查看大图
图(2) / 表(3)
计量
- 文章访问数: 5014
- HTML全文浏览量: 2983
- PDF下载量: 117
- 被引次数: 0


